Intermittent downtime from repeated crashes
November 30, 2022 — 14 min read

On Friday 18th November 2022 we experienced 13 minutes of downtime over a period of 32 minutes from 15:40 to 16:12 GMT.
At incident.io, our customers depend on us to be available even when everything else is down, so we take incidents like this seriously. We also sincerely believe in the power of transparency, and want to be as open as possible in these situations, sharing what details we can.
That’s why we’re sharing this technical write-up, explaining what happened and also to share the measures we’ve since taken to improve our reliability.
Here's a summary timeline with links, if you'd like to jump through:
| Time | Event |
|---|---|
| 15:40 | Initial crash |
| 15:42 | Restarted dynos, back up |
| 15:47 | Subsequent crashes |
| 16:00 | Begin purging GCP subscriptions |
| 16:12 | App stops crashing |
| 16:13 | Regroup, start on mitigations |
| 16:48 | Deploy fix to handle panics |
| 17:24 | Deploy split of web, worker and cron into different dynos |
Background
- We run our app as a Go monolith in Heroku deployed using container buildpack, Heroku Postgres as a database, and GCP Pub/Sub as an async message queue.
- Our application runs as a single binary running web, worker and cron threads.
- For async work, we have separate Pub/Sub subscriptions that are served by message handlers within our app. If the message handler returns an error, we rely on Pub/Sub to perform back-off on message redelivery.
- We take care to ensure all entrypoints to the app – incoming web requests, Pub/Sub messages in the event queue, cron jobs – are wrapped in panic handlers to prevent an unhandled panic from taking the app down.
Initial crash
Twenty minutes before our end-of-week team debrief, our on-call engineer was paged due to an "H10 - App crashed" error code from Heroku, which means the app has terminated.
This type of crash happens when a Heroku dyno totally dies, which can happen in response to many events:
- An unhandled panic in the Go runtime has caused the app to die.
- Something has caused the application to exceed its memory limit and we’ve been OOM (out-of-memory) killed.
- Heroku has a fault, or some infrastructure error has caused the process to die.
Regardless of the cause, Heroku responds to this event by following its Dyno crash restart policy, which can be summarised as:
- The first time a dyno crashes, it will be restarted immediately
- If the dyno crashes again, it will be subject to a cool-off period (up-to 20m) before a restart is attempted.
Subsequent crashes increase the ‘cool off’ period, but it matters little to us: waiting 20m to restart our application would be an unacceptable amount of downtime.
From previous incidents, we’ve learned that manually restarting dynos via the Heroku console is a sensible response whenever an H10 occurs that we don’t immediately recover from. We could see from our monitoring that we hadn’t immediately recovered, suggesting we’d crashed quickly after the first restart, so we triggered a manual reboot at 15:42.
The manual reboot brought the app back up, which meant our PagerDuty automation activated (see our response flow) and we get an incident.io incident channel for this incident. The on-call and response team join the channel and start examining logs.
Subsequent crashes
Not yet knowing what caused the crash, the team start collating possible causes. Prior incident experience means our guess is a bad Pub/Sub event being consumed that triggers one of the H10 failure cases whenever it is processed, a situation often called a “poison pill”.
The immediate questions are:
- Can we determine it was an event that caused this?
- If so, which event is it?
As we begin to investigate, we get paged again: the app is down due to – presumably – the same error, and we assign an engineer to watch for subsequent crashes so we can quickly trigger a manual start, which we know brings the app back up.
It’s now 15:47, and we allocate people onto several streams of work:
- Someone to lead the incident, which means coordinating our response.
- As mentioned, one person watching for crashes and manually restarting Dynos.
- Someone is assigned to Communications, which involves updating our public status page.
And a few engineers start debugging using a variety of tools, from logs, metrics and traces to try and figure out what’s going on.
See how we use our tools in Logs and tracing: not just for production.
This investigation continues for some time, due to several roadblocks that slowed us.
Firstly, while we have Heroku capturing logs from each Dyno stdout/stderr into Corologix, when a Go app panics it will print the stacktrace of every goroutine in the application (for those unfamiliar, a goroutine is similar to a thread).
As our application runs with ~300 goroutines, printing the stacktrace of each goroutine caused Heroku to buffer and drop these log lines, preventing us from seeing the original crashing stacktrace.
Then due to Go immediately exiting upon any unhandled panic, even the parts of our app with panic handlers – such as our Sentry error reporting – were terminated, meaning we couldn’t inspect the crash in our exception tracker.
Finally, Heroku’s rate limiting of the logs was even impacting the logs that came just prior to a crash, so we couldn’t even see when we began to process the problematic event.
After 5m of trying and failing to retrieve usable logs, we change strategy.
Knowing that this crash happened about 15m away from the last deploy, we know it’s unlikely to be a frequently used event that’s causing this, and rolling back is therefore unlikely to fix our issue, since we don’t yet know what introduced the bug.
We conclude the original crash was probably the first time we processed this bad event, and start looking at all subscriptions with unacked messages from around the time we first went down. For all subscriptions that match this criteria, we purge the subscription, removing all the events from the queue. This is safe as we treat async events as best-effort, meaning dropping events will only degrade service, which is preferable if it means we come back up.
We also turn off several non-critical parts of the app that trigger async work, prioritising core incident functionality over features such as incident nudges (”It’s been a while since you last updated the incident, would you like to make an update?”).
At 16:12, after purging several subscriptions that matched our criteria, the app stopped crashing and remained stable, without any further intervention.
Regroup
The subscription responsible was used for generating a welcome message whenever people first enter an incident channel. From looking at the code, we determined that for a very small subset of our customers we'd do this in a way which would cause the code to fail.
This meant it was unlikely we’d produce another message like this for a while, and we knew which subscription to purge if we did. So with urgency reduced, we called a pause so we could regroup.
For us, that meant:
- Have the incident lead run a stand-up with all responders, checking what work remains and confirming everyone has what they need (information, support, clarity on role but also "something to eat and drink").
- Confirm our collective understanding of the incident, summarise it into a written update.
- Produce an update we could share with our customers, focused on the impact they’d feel from the incident.
- Decide next steps and allocate work.
Technically, we had a couple of things we wanted to try putting in place to quickly improve our position before closing this incident.
Mitigation 1: Ensuring we handle message panics
One rule you learn quickly when running Go apps is to catch your panics: this means ensuring any goroutine (thread) that might panic – segfault, or crashing via an explicit panic – has added a recover().
As a basic example:
func main() {
  defer func() {
    if err := recover(); err != nil {
      fmt.Println("caught error: ", err)
    }
  }()

  // Try to access a blank user pointer.
  var blankPointer *User
  fmt.Println(blankPointer.Name) // uh-oh, segfault!
}
This main function tries printing the Name field on blankPointer, which is a zero-value pointer to a User struct. That will fail because we’ll try dereferencing a zero-value, causing a segmentation fault where the kernel refuses to allow our application to read memory outside its virtual address range, which does not contain 0.
Thankfully, main has deferred a function that calls recover(), which is a special function that will catch and turn any unhandled panics into a runtime error.
This means that instead of our app crashing with a panic, it will print the error and continue:
$ go run main.go
caught error: runtime error: invalid memory address or nil pointer dereference
We add these panic handlers all over our app, so we shouldn’t have hit this issue. But clearly we did, given our app has just crashed repeatedly.
So what gives? Well, turns out there’s an edge case that is easy to miss, and it existed in the generic event consumer for our async workers:
func receive(ctx context.Context, client *pubsub.Client, subscriptionID string) error {
  defer func() {
    // recover
  }()

  sub := client.Subscription(subscriptionID)
  return sub.Receive(ctx, func(ctx context.Context, msg *pubsub.Message) {
    consumer.handle(ctx, msg) // call the event consumer
  })
}
The generic receiver did apply a recover, but we’d missed that the implementation of sub.Receive – which is in the Google Cloud Pub/Sub client – starts several new goroutines to handle the anonymous function we provide to the Receive method.
In Go, goroutines have no meaningful links back to their parent. If your child goroutine panics, it won’t benefit from the parent goroutine having applied a recover: it’s an unhandled panic, and your whole app would crash.
So our first mitigation was to apply a recover to this handler, which we deployed at 16:48.
Since this is a common piece of code used by all our event handlers, this mitigates the issue which caused this incident but it also removes this entire problem class for all other current and future subscriptions too.
Mitigation 2: Separate our app by work type
It’s considered best practice to run different work types – say web requests, async workers, and long-running cron jobs – separately from one another.
That’s because:
- Different work often demands different resources, like CPU or memory. Running things separately allows right-sizing the machine that hosts that class of work.
- Physically separating work improves reliability, as it prevents competition for shared resources like CPU, avoiding one thread consuming most of your processing ability and everything else slow/stopping.
- If one type of work behaves badly, such as panicking, it can’t adversely impact everything else.
In our case (3) is what we care about, as had we separated async work from web traffic then even if workers had died, we would continue to serve requests for Slack interactions and our web dashboard. It’s likely no one would even notice the workers were down, provided we manually restarted them quickly.
We had begun the process of splitting these work types before this incident, and the app already had a clear logical separation between web, async workers and crons. Not only was the code separate, but each component used separate database connection pools – preventing expensive workers from stealing all web database connections – and the entrypoint to the app allowed toggling components on-or-off via command line flags.
The reason we hadn't completed the split was that we'd already got most of the value from logically separating, and prefer running as simple an app as possible. Adding another dyno would also increase our CI times slightly, so we'd been waiting for a clear push before making this change: obviously an incident like this is exactly that trigger.
So after confirming we were happy with the approach, we implemented the physical split by adding a new ‘worker’ Dyno tier to Heroku and tweaking each entrypoint:
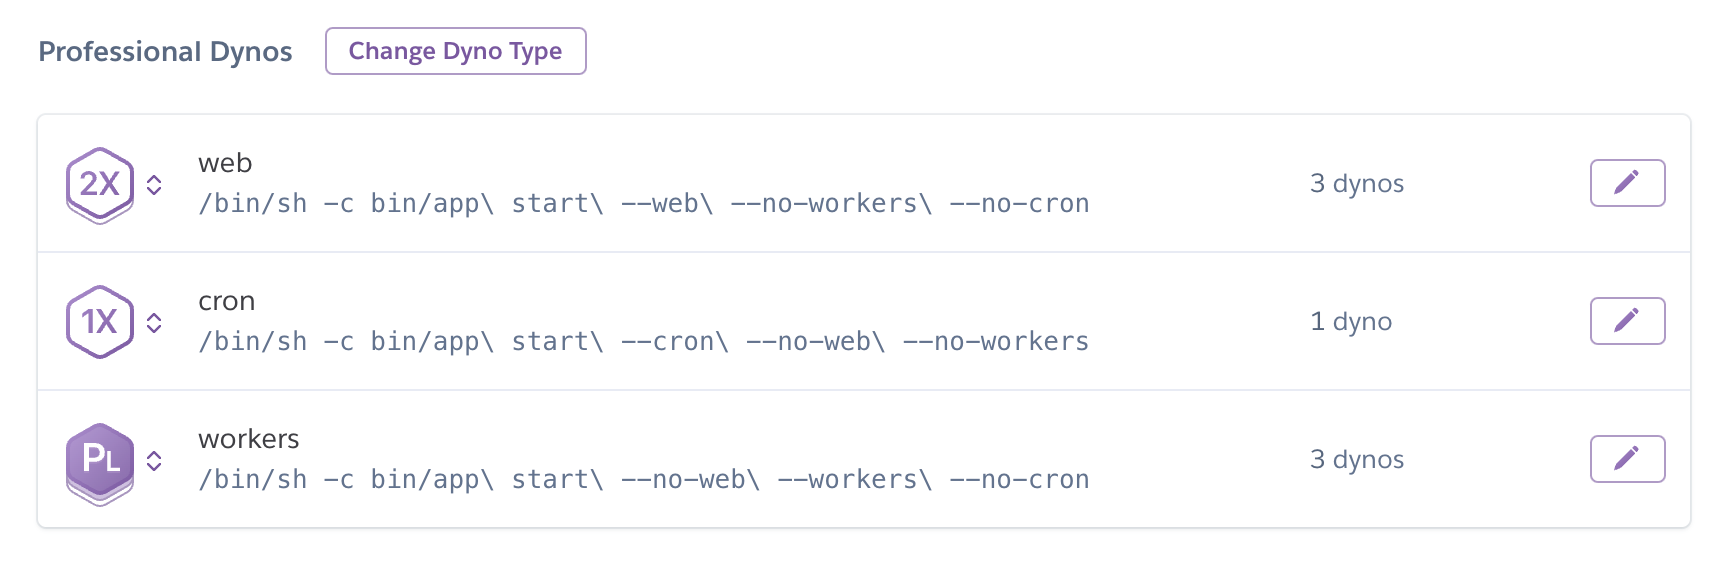
By 17:24, this change was running in production.
Conclusion
While you never want to hit a serious incident, we’re serious about making the most of the opportunity when you do.
In this instance, we took advantage of the opportunity to learn and socialise knowledge internally about:
- Heroku Dyno restart policies, and how to manually reboot if they go wrong, for those outside of the primary on-call team who hadn’t yet encountered this.
- An easy-to-miss edge-case for our static tooling where a third-party library could run our code in an uncaught goroutine.
- Best-practice incident comms for our current organisation, given we’ve grown significantly since our last major incident.
And after implementing incident follow-ups, we:
- Physically split our application by work-type, which will increase reliability and performance.
- Improved our event system by ensuring we catch panics.
In addition, aside from eveything else we learned, we're happy that:
- Outside of Heroku monitoring gaps, we found existing dashboards around Pub/Sub subscription and worker performance to be extremely valuable.
- Limited downtime to 13m, when it could have been much longer.
- Kept our customers in the loop as the incident progressed, which we care a lot about.

Lawrence Jones
Product Engineer
See related articles

Don't add a read replica until you've read this
Our learnings from implementing a product-wide read replica migrations, including some useful patterns for routing queries to replica and primary
 Johanna Larsson
July 21, 2026

We rebuilt our post-mortems from the ground up
Today we're launching our new post-mortems experience, and I want to walk you through what we've done and why.
 Pete Hamilton
March 17, 2026

Bloom filters: the niche trick behind a 16× faster API
This post is a deep dive into how we improved the P95 latency of an API endpoint from 5s to 0.3s using a niche little computer science trick called a bloom filter.
 Mike Fisher
November 14, 2025
So good, you’ll break things on purpose
Ready for modern incident management? Book a call with one of our experts today.
We’d love to talk to you about
- All-in-one incident management
- Our unmatched speed of deployment
- Why we’re loved by users and easily adopted
- How we work for the whole organization


