Logs and tracing: not just for production, local development too
November 11, 2021 — 5 min read

We're a small team of engineers right now, but each engineer has experience working at companies who invested heavily in observability.
While we can't afford months of time dedicated to our tooling, we want to come as close as possible to what we know is good, while running as little as we can- ideally buying, not building.
Even with these constraints, we've been surprised at just how good we've managed to get our setup.
We got here with an investment most engineering teams should be able to afford, with certain decisions meaning we got more value that we expected out of the changes.
This post describes how we got here, and why it works so well.
How we trace things
First and foremost, our app emits lots of tracing data, so we need to pick a distributed tracing solution.
While I have experience running Jaeger and a preference for the Grafana toolchain (with Tempo being their tracing solution), we want to keep a small surface area of developer tools, avoid running infrastructure where we can, and lean into our preference for Google Cloud Platform.
This made Google Cloud Trace an obvious choice, and one that was easy to configure from our Go app:
package main

import (
  "context"
  "os"
  "time"

  "contrib.go.opencensus.io/exporter/stackdriver"
  "go.opencensus.io/trace"
)

func main() {
  traceExporter, _ := stackdriver.
    NewExporter(stackdriver.Options{})
  defer traceExporter.Flush()

  trace.ApplyConfig(trace.Config{
    DefaultSampler: trace.AlwaysSample(),
  })
  trace.RegisterExporter(traceExporter)

  // ...
}
That is all that's required to ship traces to Google, after which they'll appear in the Cloud Trace console.
Enriching traces
Even with that minimal setup, traces are immediately useful:
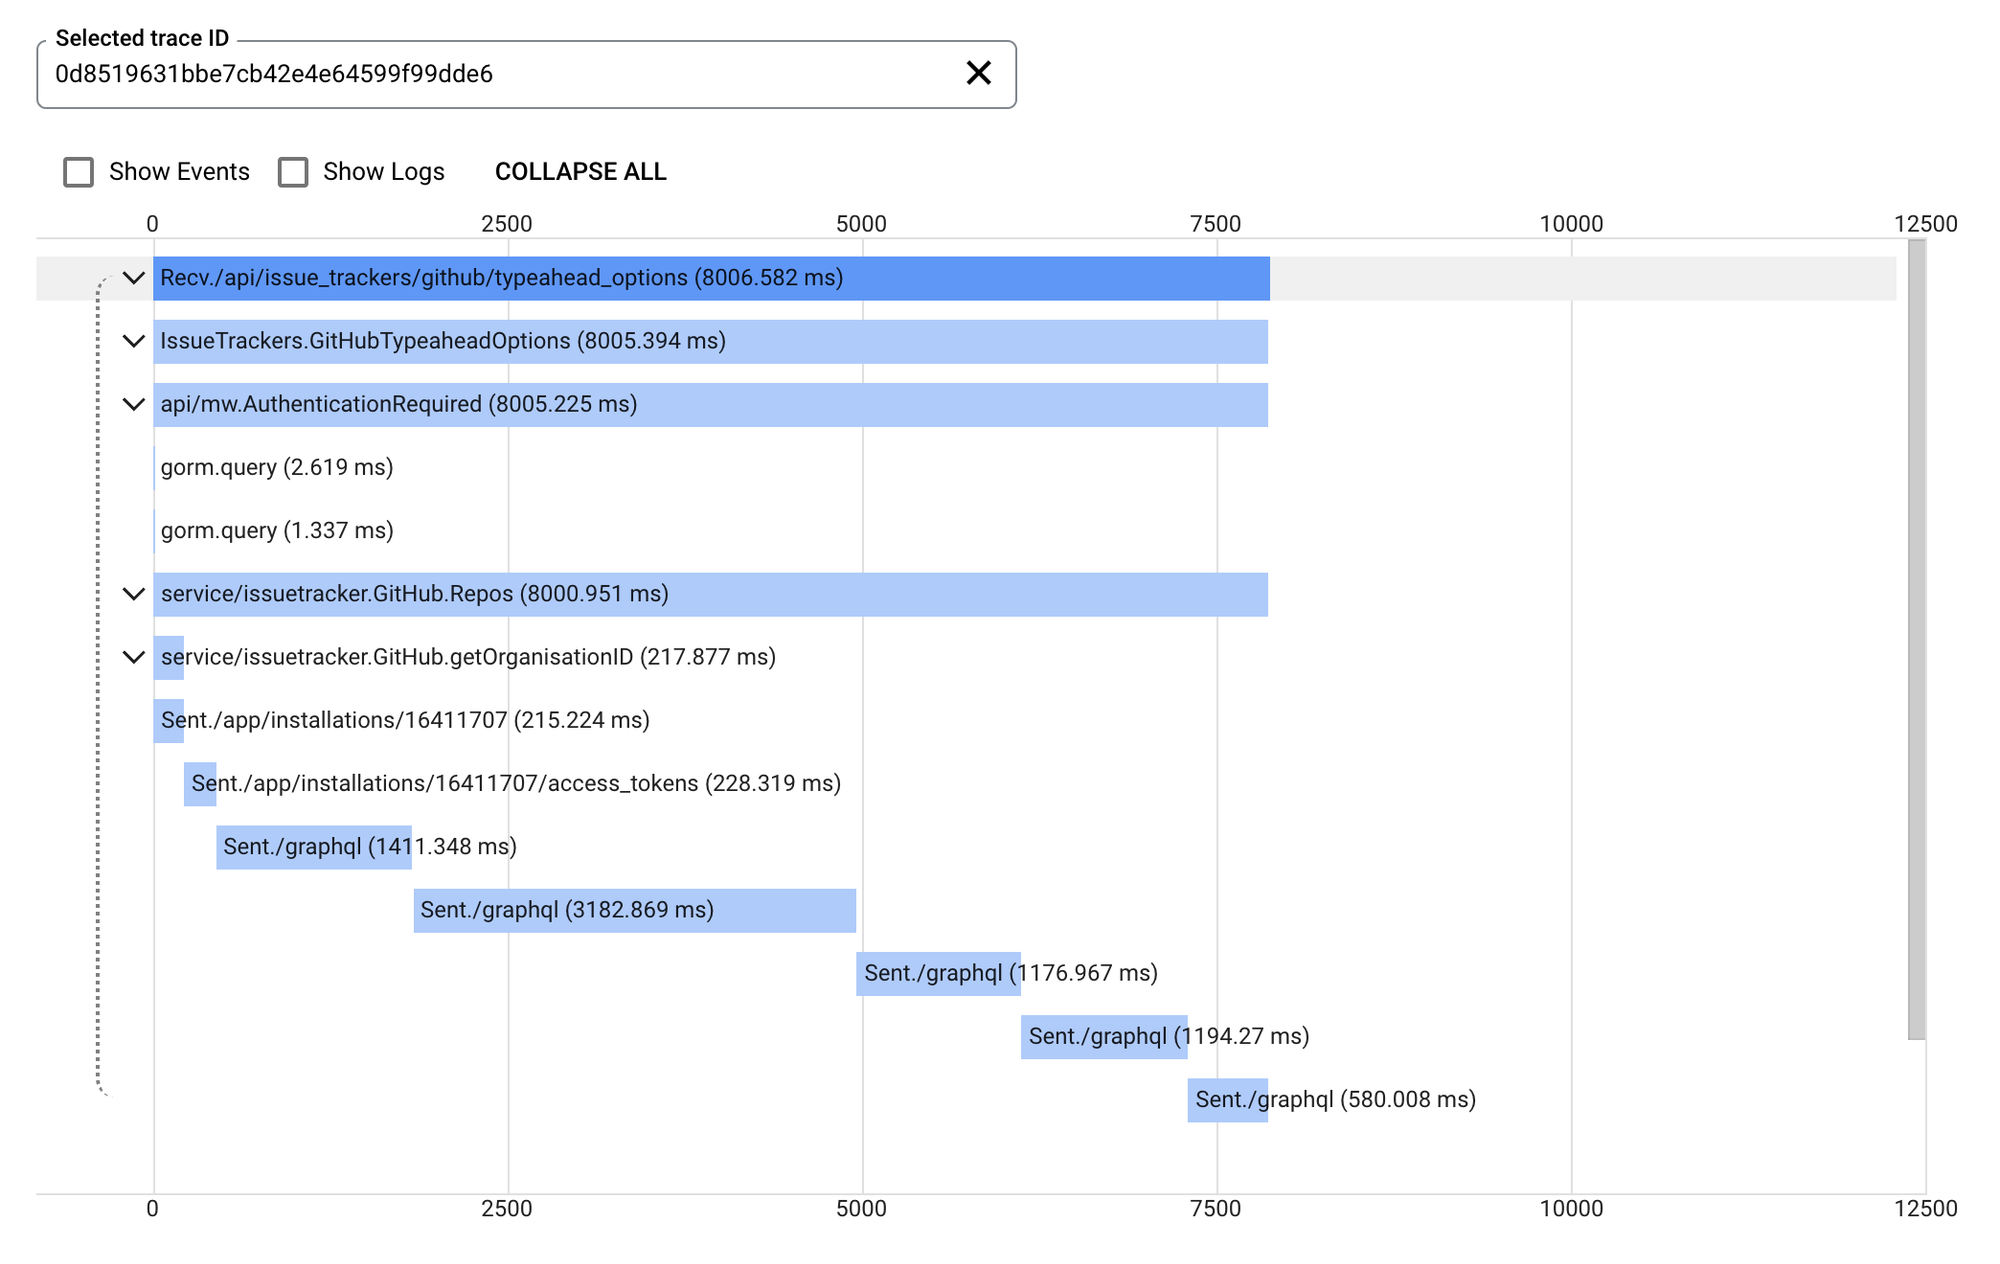
Trace of an API request which paginates through GitHub repositories
As a debugging aid, this is great- you can clearly see what happens during the request, in this case the outbound requests to the GitHub GraphQL API.
But it's not everything. Our app is pretty noisy, and we log a lot of contextual information that could be really useful to see next to our trace.
Cloud Trace supports this, if you ship logs into StackDriver. As we already have a logging platform we weren't buzzed about adding another, but were willing to consider it if meant better integration between logs and traces.
Setting this up meant adjusting our app logger to ship to both STDERR and StackDriver, with a bit of book-keeping to associate logs with the on-going trace.
We use zap, which supports zap.NewTee to combine various log sources together. We kept our existing STDERR log source and combined it with StackDriver zap.Core.
The code looks something like this:
import (
	"cloud.google.com/go/logging"
)

client, _ := logging.NewClient(ctx, os.Getenv("GCP_PROJECT_ID"))
stlg := client.Logger("incident-io/core")

// This is the bulk of the logger, though needs wrapping
// as a zap.Core to pass to NewTee.
func log(ctx context.Context, level zap.Level, payload map[string]interface{}) {
  spanContext := trace.FromContext(ctx).SpanContext()

  stlg.Log(logging.Entry{
    Severity: logging.ParseSeverity(level.CapitalString()),
    Payload:  payload,
    Trace:    fmt.Sprintf(
      "projects/%s/traces/%s",
      os.Getenv("GCP_PROJECT_ID"),
      spanContext.TraceID),
    SpanID:   spanContext.SpanID.String(),
  })
}
Now our app is shipping logs to StackDriver with the associated Trace and Span IDs, we can click "Show logs" and see those log messages inline with our trace:
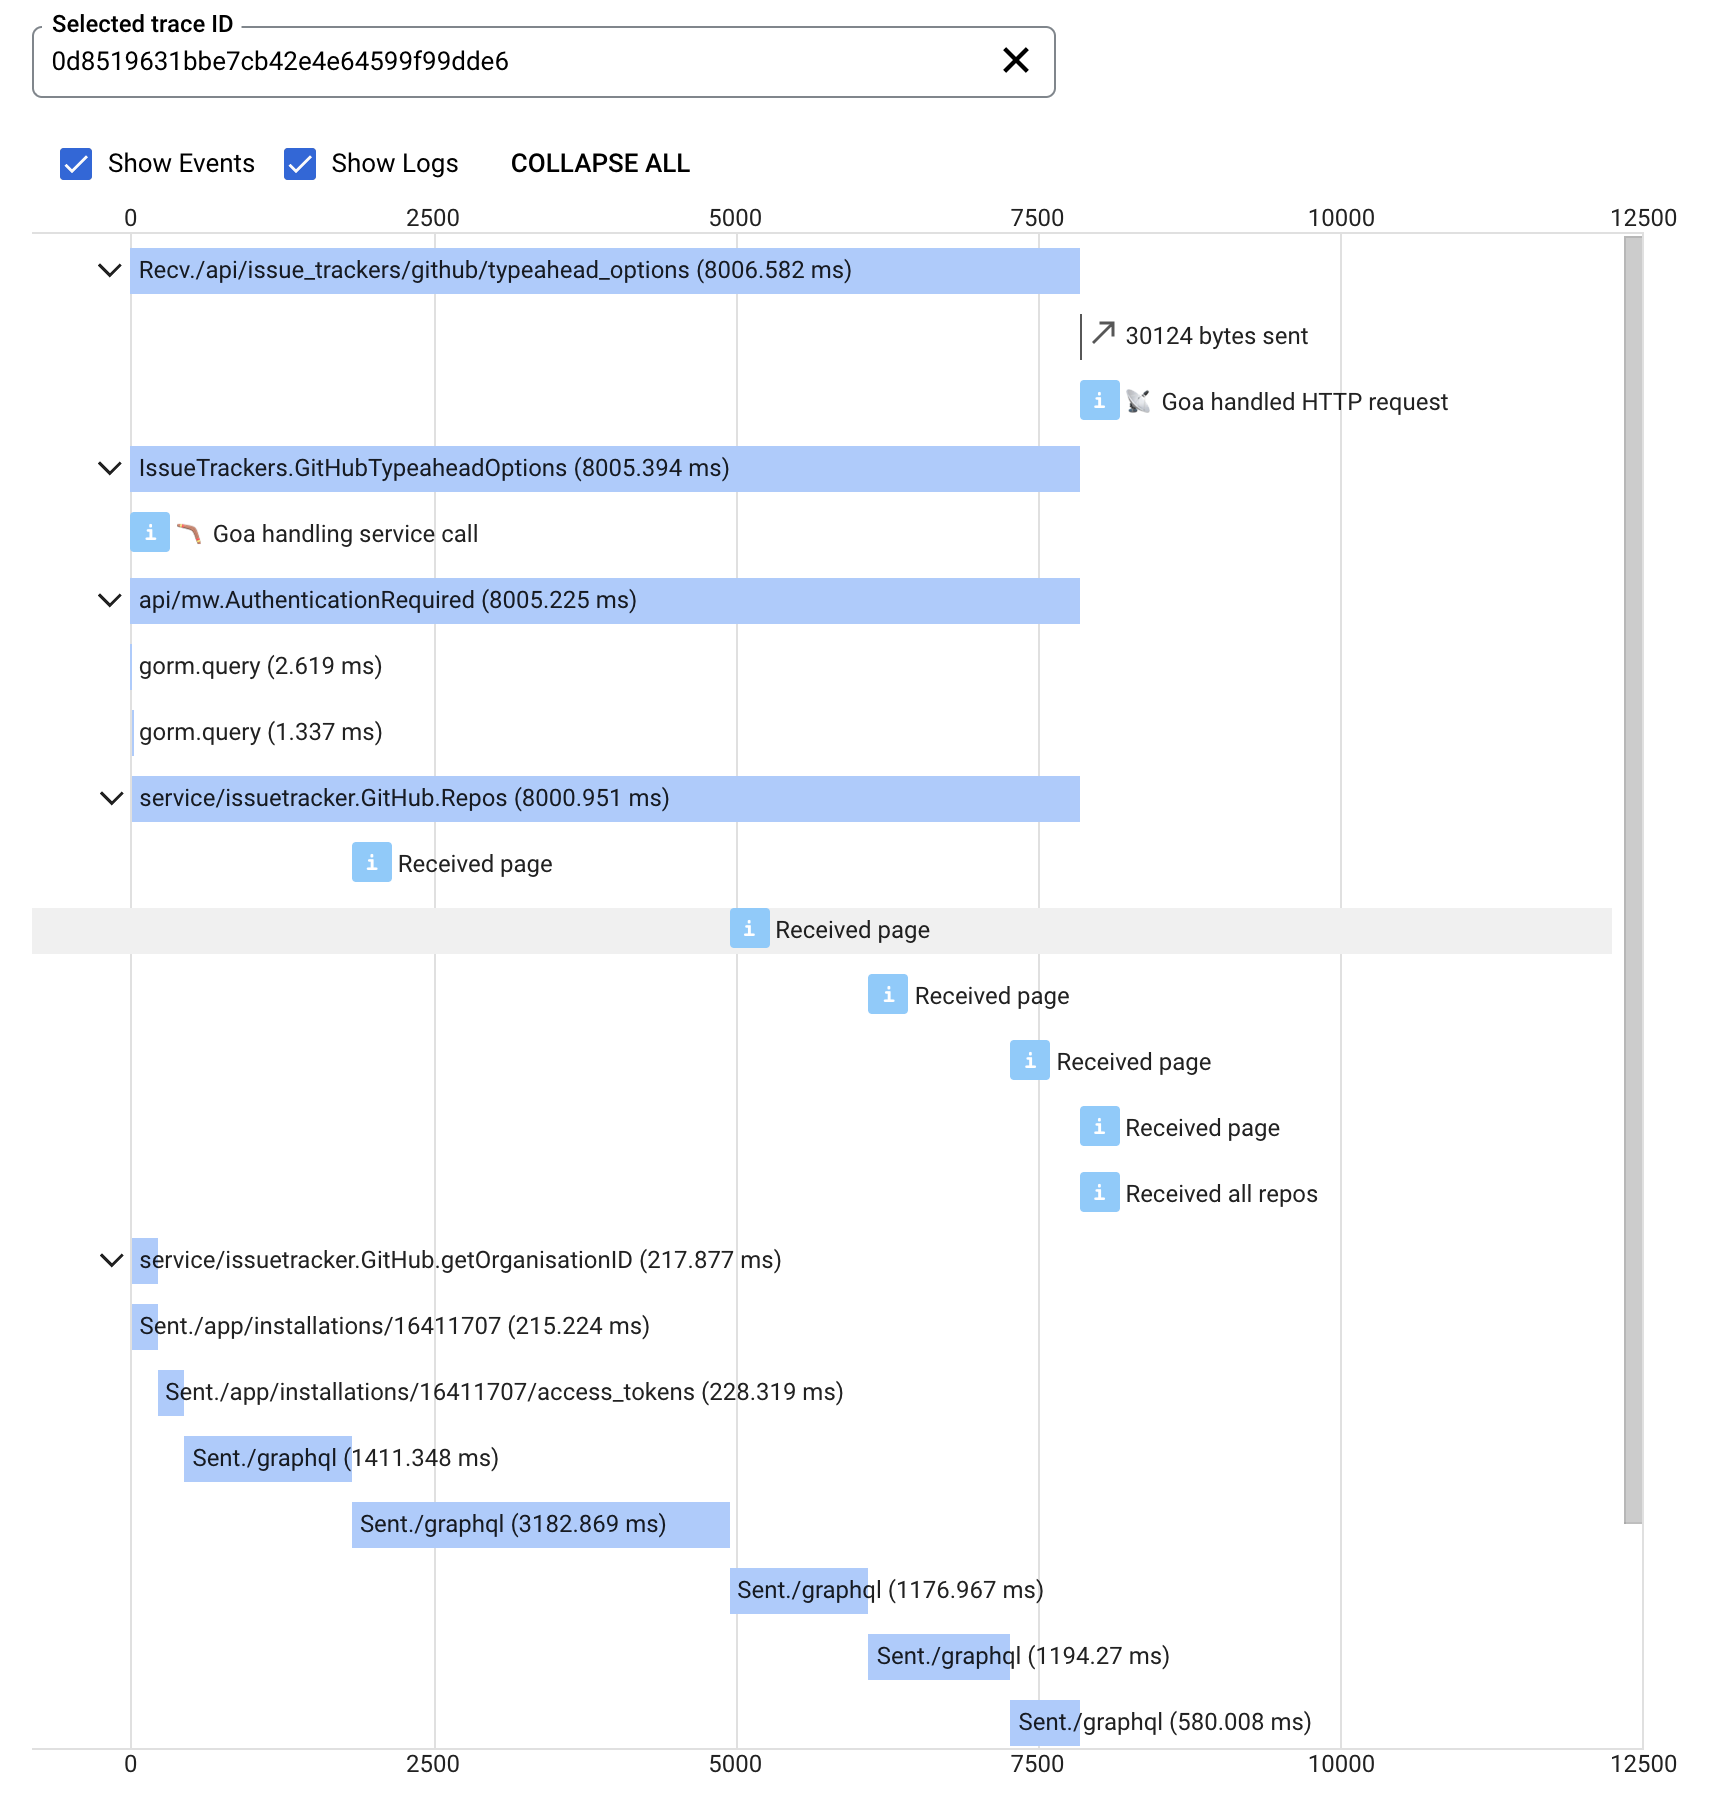
Same trace as before, but with logs displayed inline with the traces
Not just for production
One of the best outcomes of this work was improving the local development experience, where developers build and test on their local machines.
As our app is a Go webserver with Pub/Sub subscriptions, following the logs as they are output can be difficult- you're actually seeing many concurrent threads woven together.
What you tend to want is an easy way to jump from a single log to all the logs from the same trace. How to make that jump should be obvious, ideally a single click away while browsing through the log output.
There's a trivial solution that can make a world of difference: add the trace URL to every log line.
// stackdriverTraceURL can be templated with a project ID
// and trace ID, and produce a URL that will display the
// trace in the Google Cloud Console.
const stackdriverTraceURL = "https://console.cloud.google.com/traces/list?project=%s&tid=%s"

// If we're in a span, we can extract our trace/span IDs
spanContext := trace.FromContext(ctx).SpanContext()
if spanContext != nil {
  payload["span_id"] = spanContext.SpanID
  payload["trace_id"] = spanContext.TraceID

  // Provide this so you can jump from any log-line to the
  // trace in Cloud Trace.
  //
  // Eg. https://console.cloud.google.com/traces/list?project=incident-io-dev-lawrence&tid=0d8519631bbe7cb42e4e64599f99dde6
  payload["trace_url"] = StackdriverTraceURL(
    fmt.Sprintf(stackdriverTraceURL,
      os.Getenv("GCP_PROJECT_ID"), spanContext.TraceID))
}

// Include the trace URL in every log entry
log(payload)
Jumping into the trace view from your local machine is now super easy, and often the first thing we do when debugging something locally.
Closing the loop
In my experience at previous companies, we invested heavily in observability infrastructure but for production environments only- collecting logs from Kubernetes pods and shipping them to ELK, for example.
This works, but does nothing for developers building and testing on their local machines.
That's sad, as it means:
- You can't use the production tooling you're familiar with to help you build
- You don't build proficiency with production tools while developing
With our new setup, we don't need to make these compromises. Not only do we get increased productivity when working locally, but you take those skills with you when debugging real production issues.
For a small initial investment, traces have become an essential part of our debugging workflow. We've placed trace URLs everywhere, from our logs to our Sentries and Grafana dashboards, so you're one click away from a trace view whenever you need it.
This has worked great for us- let us know if you find this useful, too!

Lawrence Jones
Product Engineer
See related articles

We rebuilt our post-mortems from the ground up
Today we're launching our new post-mortems experience, and I want to walk you through what we've done and why.
 Pete Hamilton
March 17, 2026

Bloom filters: the niche trick behind a 16× faster API
This post is a deep dive into how we improved the P95 latency of an API endpoint from 5s to 0.3s using a niche little computer science trick called a bloom filter.
 Mike Fisher
November 14, 2025

My first three months at incident.io
Hear from Edd - one of our recent joiners in the On-Call team - how have they found their first three months and what's it been like working here.
 Edd Sowden
September 1, 2025
So good, you’ll break things on purpose
Ready for modern incident management? Book a call with one of our experts today.
We’d love to talk to you about
- All-in-one incident management
- Our unmatched speed of deployment
- Why we’re loved by users and easily adopted
- How we work for the whole organization


