Battling database performance
April 20, 2023 — 12 min read

Earlier this year, we experienced intermittent timeouts in our application while interacting with our database over a period of two weeks.
Despite our best efforts, we couldn’t immediately identify a clear cause; there were no code changes that significantly altered our database usage, no sudden changes in traffic, and nothing alarming in our logs, traces, or dashboards.
During that two-week period, we deployed 24 different performance and observability-focused changes to address the problem.
In this post, I'm going to share a bit about what those were and the value we've gained from them.
The initial investigation
We first looked into these slowdowns after noticing them, receiving a report from a customer, and seeing a flurry of context canceled errors in our error reporting tool, Sentry.
Our on-call engineer, Aaron, initiated an incident and began investigating. He opened our API dashboard in Grafana, which provides a high-level overview of the health of our API.
He confirmed that we did indeed time out on some API requests, but within a minute, we had returned to normal service.
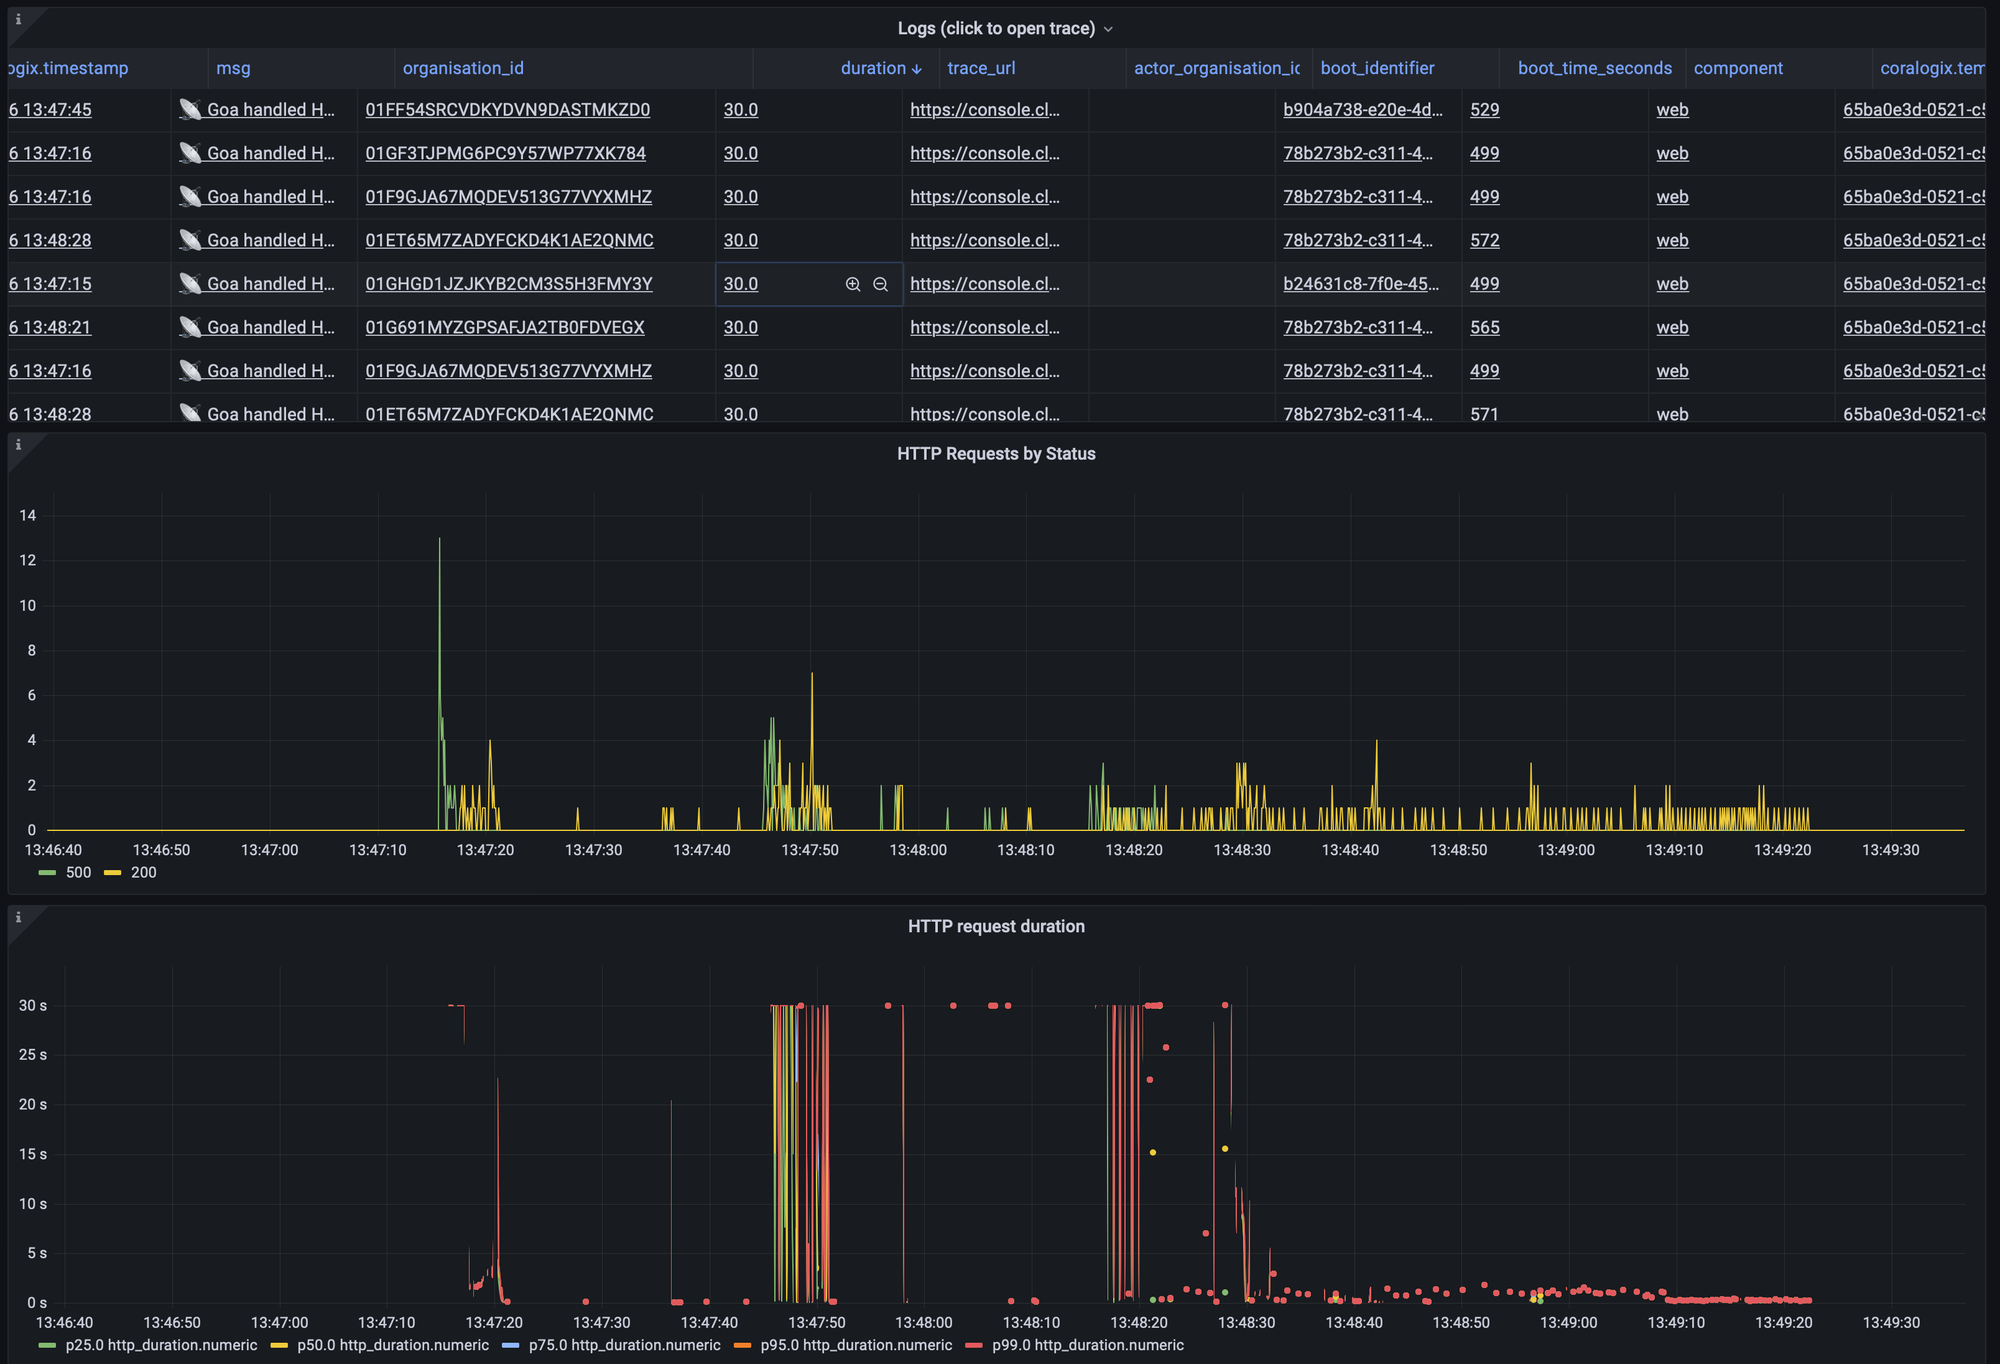
After updating the incident to let everyone know that things seemed okay, he began investigating what had caused the problem.
Opening up the trace of a single failure, Aaron noticed that this HTTP request had waited almost 20 seconds to get an available connection from the connection pool.
What are connection pools?
When our app communicates with our database, it uses a client-side connection pool that is implemented in thedatabase/sqlGo package. The package uses these pools to limit the number of processes in our app that can communicate with the database anytime. When an operation needs to use the database, it sends that query to thedatabase/sqlpackage, which tries to get a connection from its connection pool. If all the available connections are in use, the operation is effectively blocked until it can get a connection.
This blocking is the 20-second delay Aaron can see in the trace.
Fortunately, we already had observability in place to identify this issue. We’ve implemented it using ago.patchfile to monkey patch) thedatabase/sqlpackage and add a trace to theConnectionPoolWaitmethod. It’s not the most robust approach, but for the sake of adding a single span to a trace, it does the job.
Aaron had spotted from our traces that we had a variety of requests stuck waiting on a connection pool. At this point, we took things to Kibana to get a better idea of the distribution of the types of those requests.
--- /tmp/sql.go	2022-08-01 23:45:55.000000000 +0100
+++ /opt/homebrew/Cellar/go/1.19/libexec/src/database/sql/sql.go	2022-09-16 13:06:58.000000000 +0100
@@ -28,6 +28,8 @@
 	"sync"
 	"sync/atomic"
 	"time"
+
+	"go.opencensus.io/trace"
 )

 var (
@@ -1324,6 +1326,9 @@
 		return conn, nil
 	}

+	ctx, span := trace.StartSpan(ctx, "database.sql.ConnectionPoolWait")
+	defer span.End()
+
 	// Out of free connections or we were asked not to use one. If we're not
 	// allowed to open any more connections, make a request and wait.
 	if db.maxOpen > 0 && db.numOpen >= db.maxOpen {
This would allow us to confirm whether this was a small number of endpoints fighting for contention over a single database connection pool, or perhaps many endpoints that might all be using different pools.

What we found was that this issue was fairly widespread—there was no single connection pool affected.
We’d been hoping for it to be a single pool as that would have made it a little simpler to hone in on the work in that pool and optimise it.
In lieu of that, we started looking at general database health. Historical HTTP traffic and PubSub metrics didn’t suggest that anything we received at that time was out of the ordinary. Heroku’s Postgres stats also suggested fairly normal database load, though it did highlight some neglected queries that had been getting slower as our database grew.
Having no obvious place to start, we decided to fix anything that looked slow and was a quick-win. We’d shipped a number of optimisations, including:
- Moving policy violations over to using a materialised view, rather than having to pull policies and all their related incidents just to do that calculation for each request.
- Adding some new database indices to speed up slow queries.
- Re-writing some queries that joined and then filtered on columns that weren’t indexed, when they could filter on that same column in indexed table that was already present in the join.
At this point, we felt we’d sunk a decent amount of time into investigating this outage, and we’d shipped a good amount of low-hanging fruit, we called it a day and closed the incident.
Repeated slowdown
Within a couple of days of shipping the initial incident, lightning struck twice—we were timing out again.
I was on call this time and was pulled into the generated incident. I pulled up our dashboards and saw that again we’d been timing out due to waiting on connection pools. Looking at Kibana and Google Cloud Trace, there was no discernible pattern in our slow requests.
One of our engineers, Lawrence, joined the incident and suggested, rather than playing whack-a-mole and patching query after query, to add a one second lock timeout to all of our transactions.
As we weren’t in a great state, this would at least let us quickly identify which requests were holding onto transactions longer than we’d like.
We deployed this change and fortunately nothing broke, but unfortunately, this meant we were still no closer to identifying the cause of our slow downs.
💭 One notable change we made at this point was to start processing Slack events asynchronously.
Whenever an event occurs in a Slack channel our bot has access to, we get notified via a webhook. Additionally, whenever Slack syncs a workspace’s users, we receive webhooks for each change. These can add up to a lot of events, and Slack can often send us a big batch of these at once.
Originally, we would receive this event from Slack, and within the lifetime of that HTTP request, we’d perform any responses we needed to, e.g. offering to attach a GitHub link that a user has just posted in the channel. Regardless of the operation, we’d always do some database queries, like looking up the organization with that Slack team ID.
To help alleviate periods of high traffic, we began processing these events asynchronously instead. So when a Slack webhook comes in, we now just forward that straight to PubSub and avoid making any database queries.
By using PubSub, we can throttle access to the database a bit more, and if we want, we get some retry logic for free. The downside is that we’ve introduced some additional latency in the time it takes us to process events, but we feel that’s a reasonable tradeoff.
This felt like quite a significant change, so we again called it a day and hoped that was the last of our timeouts.
Improving our observability
Despite our best efforts, the next day we saw another period of timeouts. At this point, we’d made a number of changes that felt like they’d help, but weren’t making significant progress. We realised we had to double down on improving our observability so we could narrow in on the root of the problem.
The golden egg we wanted was to be able to group operations over a time period and sum up the total time that operation spent holding a connection pool. This would give us the ability to query things like “Which API endpoints are hanging onto database connections for the longest?”.
We already log a metric whenever we process a PubSub message, or handle an HTTP request. With this, we know “how long did this operation take”, “what operation is it”, “what group of services does it belong to?”. So, we looked at updating that log with additional info about connection pool usage.
In theory, calculating the time we spend in connection pools sounds easy enough, but it unfortunately wasn’t as simple as ‘start timer, run query, end timer’. For starters, we couldn’t put a timer around every database query we run, so we needed a middleware to apply this globally. Additionally, whenever we open a database transaction, a connection pool is held for the lifetime of the transaction, so we needed to devise a way to detect if we’re in a transaction, and alter our counting logic as required.
For the middleware, we initially looked at plugging something into gorm - our ORM. But we soon realised that the hooks provided by gorm included the time we spent waiting on a connection pool, so we’d be counting the stuff we already knew.
Instead, we implemented a middleware in the ngrok/sqlmw package which allowed us to hook into code right before and right after a query or transaction occurred. In here, we called out to a new method we added - trackUsage —that utilised go’s Context to maintain our new counter.
func trackUsage(ctx context.Context) (end func()) {
	inTransaction, _ := ctx.Value(InTransactionContextKey).(bool)
	startTime := time.Now()
	return func() {
		duration := time.Since(startTime)
		log.AddCounter(ctx, log.DatabaseDurationCounterKey, duration)
		// If we're inside a transaction, the connection is held for the entire
		// transaction duration, so we avoid double-counting each individual
		// statement within the transaction
		if !inTransaction {
			log.AddCounter(ctx, log.DatabaseConnectionDurationCounterKey, duration)
		}
	}
}
Now, we can filter both our logs and traces by the time each operation spends holding a database connection pool.
Using tools like Grafana, we can group this by the type of operation and sum up the value over a time period. But, we’ve yet to really make use of this. While we were waiting for some useful data, we shipped another change that solved the root cause of our slowdowns.
The eventual fix 🤞
Whilst sifting through our logs to check: “how are we looking after yesterday’s fixes,” and “is our connection pool counter working?”, we noticed an unnecessary transaction we were opening whenever we were handling the submission of a Slack modal. This is an HTTP endpoint that Slack calls whenever a user presses the confirmation button in the view you see when you use a slash command like /inc.
We removed the transaction for most modal submissions, and in cases where we needed transactional guarantees, we added it for those code paths explicitly.
It wasn’t until a few days later that we realised this was the root of our problems. As the timeouts were intermittent and didn’t occur every day, it took a little while to confirm the issue. But, it’s now been 4 months and we’ve been database timeout free.
This did confirm our suspicions from earlier on—there wasn’t one noticeably slow thing that caused this issue. Instead, it was many short transactions that, when added together, caused us some real problems.
Wrap up 🌯
It was a little disappointing to fight with this issue for days, and for there to not be an aha! moment where we solved everything in one fell swoop.
But, on the upside, we’re now much better equipped to diagnose problems like this in the future. And we’ve made some legitimate performance improvements that should make our application faster for our users.
Had we been using different databases for different parts of our application, we’d likely have been able to track down this issue sooner. However, that’s certainly not free to do that either. With that, we’d have to start thinking about distributed transactions, and our development environments would be less slick - we’re happy with the trade offs we’ve made for now.
If you’ve found this interesting—perhaps you’ve battled similar issues yourself—please do reach out. We’d love to chat!

Rory Bain
Product Engineer
See related articles

Don't add a read replica until you've read this
Our learnings from implementing a product-wide read replica migrations, including some useful patterns for routing queries to replica and primary
 Johanna Larsson
July 21, 2026

We rebuilt our post-mortems from the ground up
Today we're launching our new post-mortems experience, and I want to walk you through what we've done and why.
 Pete Hamilton
March 17, 2026

Bloom filters: the niche trick behind a 16× faster API
This post is a deep dive into how we improved the P95 latency of an API endpoint from 5s to 0.3s using a niche little computer science trick called a bloom filter.
 Mike Fisher
November 14, 2025
So good, you’ll break things on purpose
Ready for modern incident management? Book a call with one of our experts today.
We’d love to talk to you about
- All-in-one incident management
- Our unmatched speed of deployment
- Why we’re loved by users and easily adopted
- How we work for the whole organization


