Tracking developer build times to decide if the M3 MacBook is worth upgrading
December 19, 2023 — 22 min read

All incident.io developers are given a MacBook for their development work.
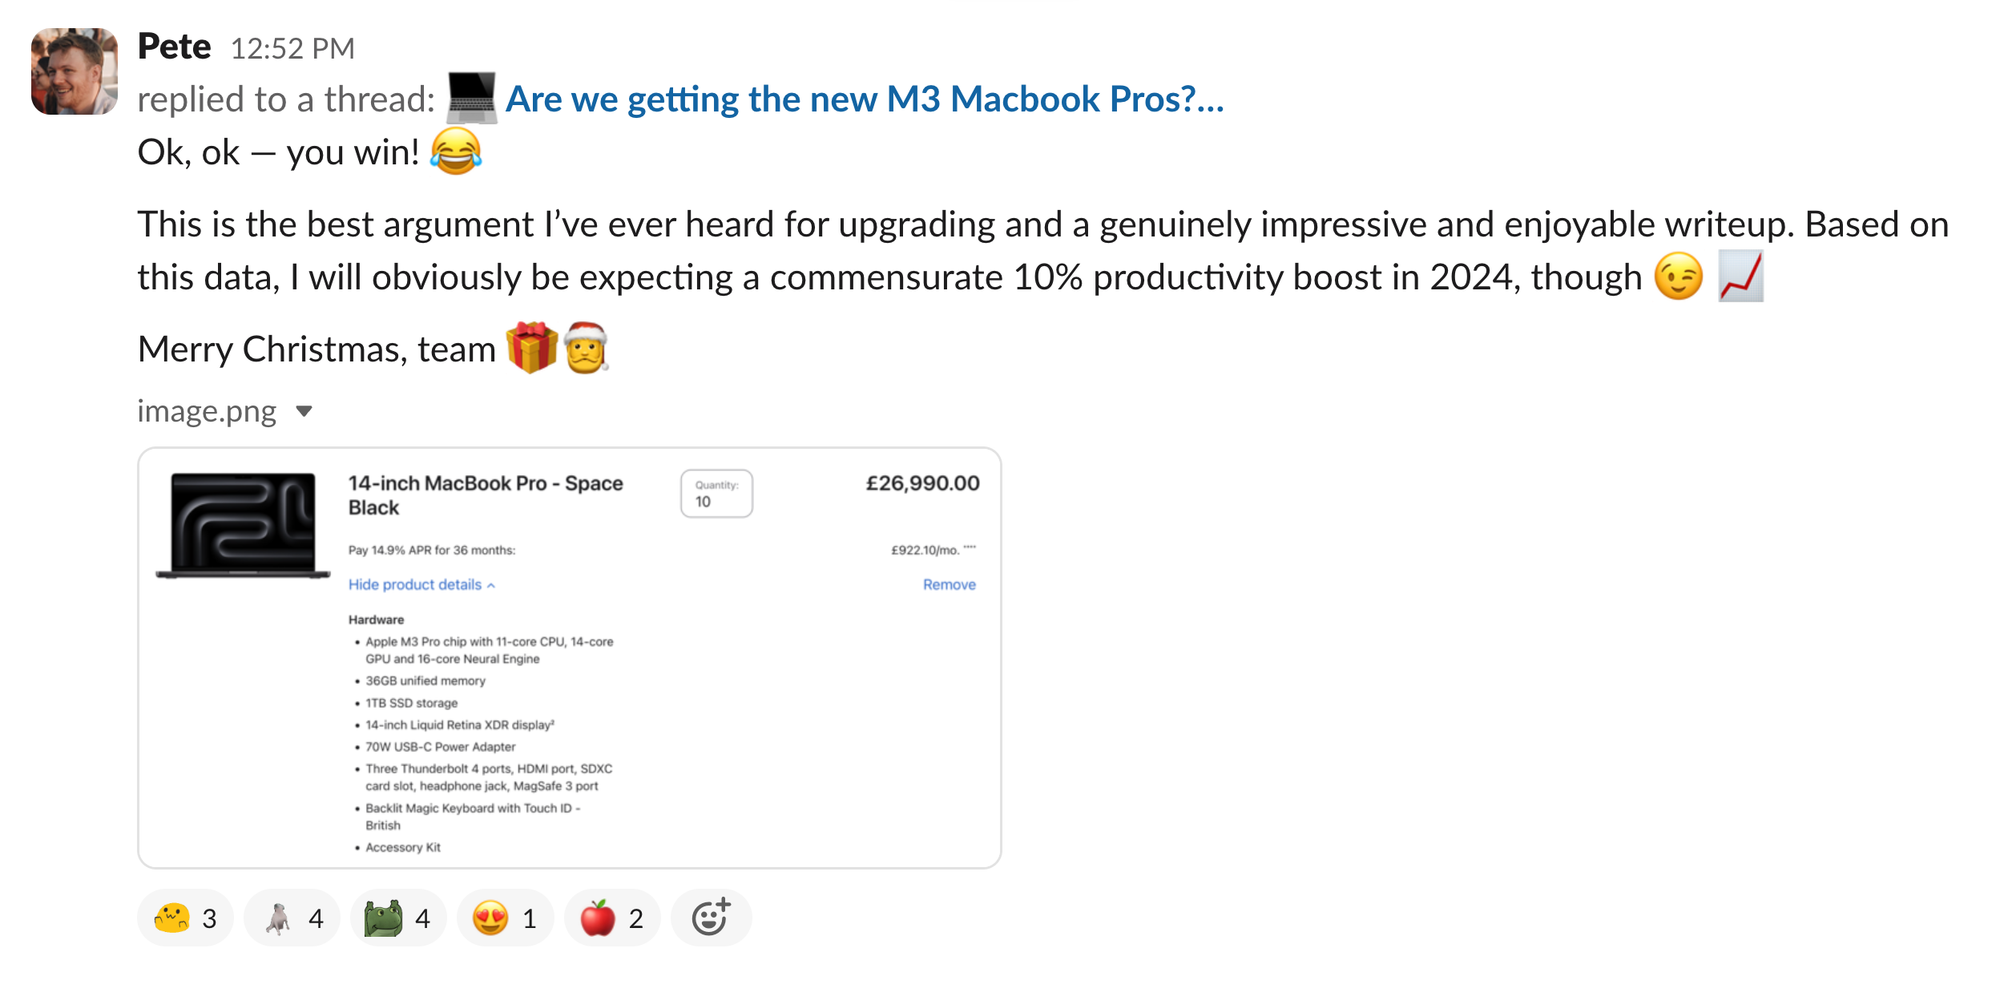
That meant when Apple released the M3 MacBook Pros this past October, our team naturally started asking questions like, “Wow, how much more productive might I be if my laptop looked that good?”, and “Perhaps we’d be more secure if our machines were Space Black 🤔”.
Our CTO, Pete, responded: “If you can prove it’s worthwhile, we’ll do it."
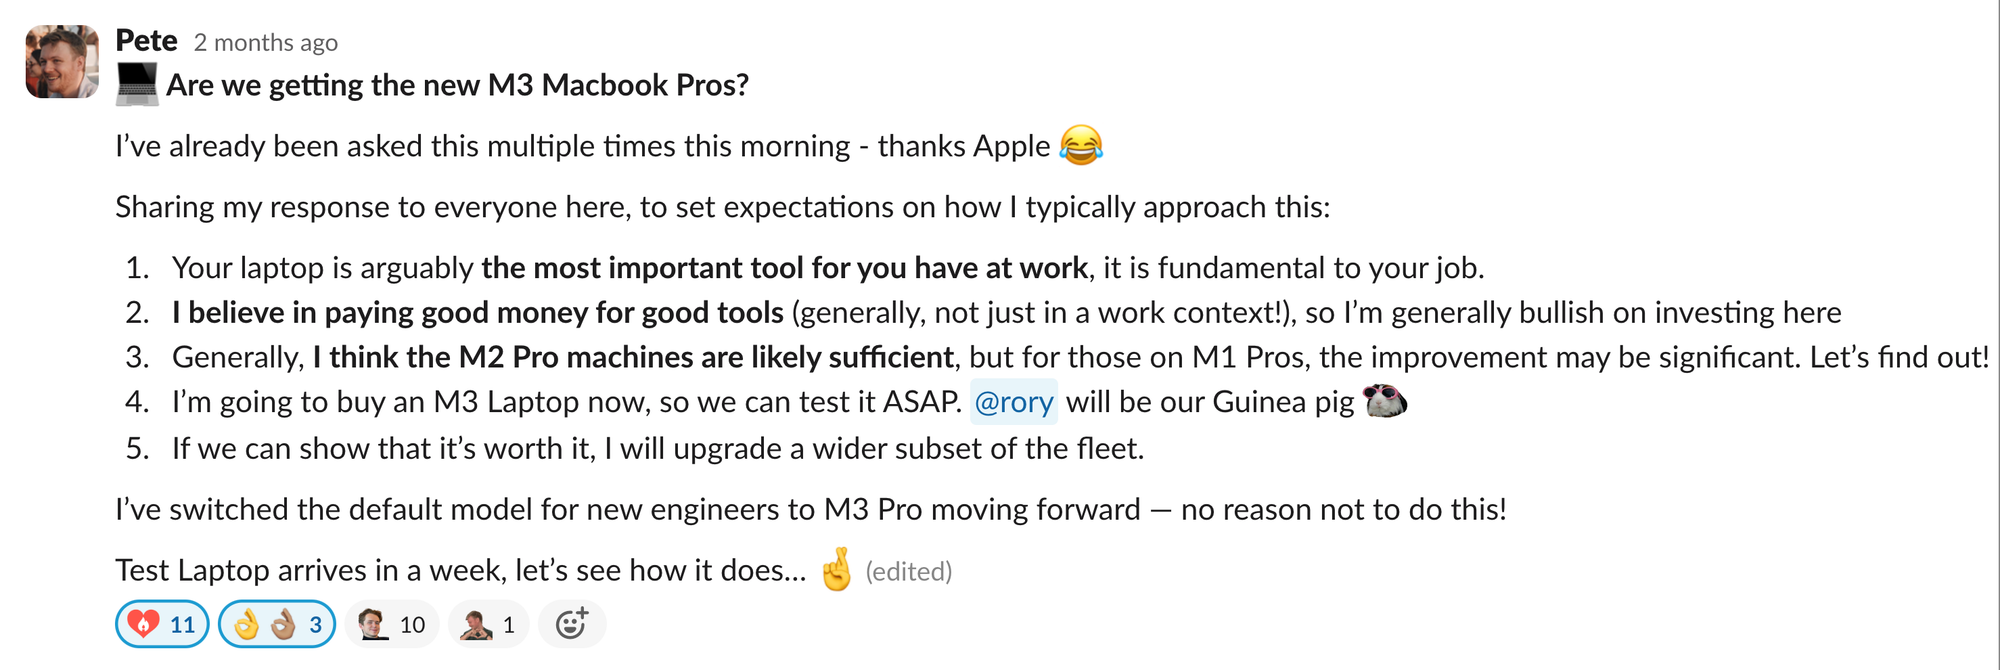
So with an upgrade to a machine that Apple itself describes as "unmistakably pro" hanging in the balance and a personal challenge from Pete to find data to prove it was worthwhile, we set off on a journey that included:
- Hacking together a custom Go hot-reloader
- Using this hot-reloader to track build telemetry from developer laptops
- Loading this data into OpenAI’s latest models and jumping head-first into an extremely nerdy (and overkill) analysis
With this, we had everything (and more!) needed to conclusively decide if the M3 was worth the upgrade, or if our team would be getting coal in their stockings this Christmas.
What does “worth the upgrade” mean for the M3?
We wanted to know if upgrading existing developer machines from M1/M2 chips to M3 is worth it.
Quantifying developer productivity is difficult (see Measuring developer productivity), but we know (intuitively, and through research such as Maximizing Developer Effectiveness) that faster feedback loops make developers more effective.
For our team, the most common feedback loops in local development are:
- Compiling our Go monolith
- Running code-generation: API clients, interfaces, and more
- Hot-reloading the frontend/mobile app
All developers work with a fully-fledged incident.io environment locally on their laptops: it allows for a <30s feedback loop between changing code and running it, which is a key factor in how productively you can work with our codebase.
For that reason, compiling the Go app is one of the most frequent of these loops and one of the most expensive, with the codebase nearing 1M lines of code. As the most resource-hungry of those tasks (in terms of system resources) it would likely benefit most from more powerful hardware, too.
For that reason we picked the speed of Go compilation as the key metric of MacBook performance—now, we just needed to measure it.
Collecting build telemetry
We’ve used codegangsta/gin as a hot-reloader for Go since first creating the incident.io GitHub repo. It worked well–its job being to compile and then restart the new version of the app whenever code files change–but we’d recently hit issues that had made us consider moving.
When we looked at alternative hot reloaders, though, we didn’t find any that would provide the telemetry we’d want to track our build times.
For each build, what we wanted to track was:
- System dimensions: your platform (M1/M2/M3), total memory, etc.
- Runtime metrics: OS, memory usage, power source, battery level, etc.
- Build telemetry: total duration, Go build stages, which files triggered the build, etc.
In the absence of a ready-made alternative, we decided to build our own that we could tailor to our needs. As our primary motivator is to produce build telemetry, this process began as a modest main.go that we tweaked until it could extract what we needed from the host.
Mac machines have several binaries that can help you with this – memory_pressure, docker, sysctl and pmset – and the code is mostly exec-ing and parsing the output of them:
memoryFreeRegex := regexp.
MustCompile(`^System-wide memory free percentage:\s+(\d+)%`)
// Run memory_pressure...
memoryPressure, _ := exec.Command("memory_pressure").Output()
for _, line := range strings.Split(string(memoryPressure), "\n") {
if memoryFreeRegex.MatchString(line) {
// ...parse result!
ev.MemoryFree = memoryFreeRegex.FindStringSubmatch(line)[1]
}
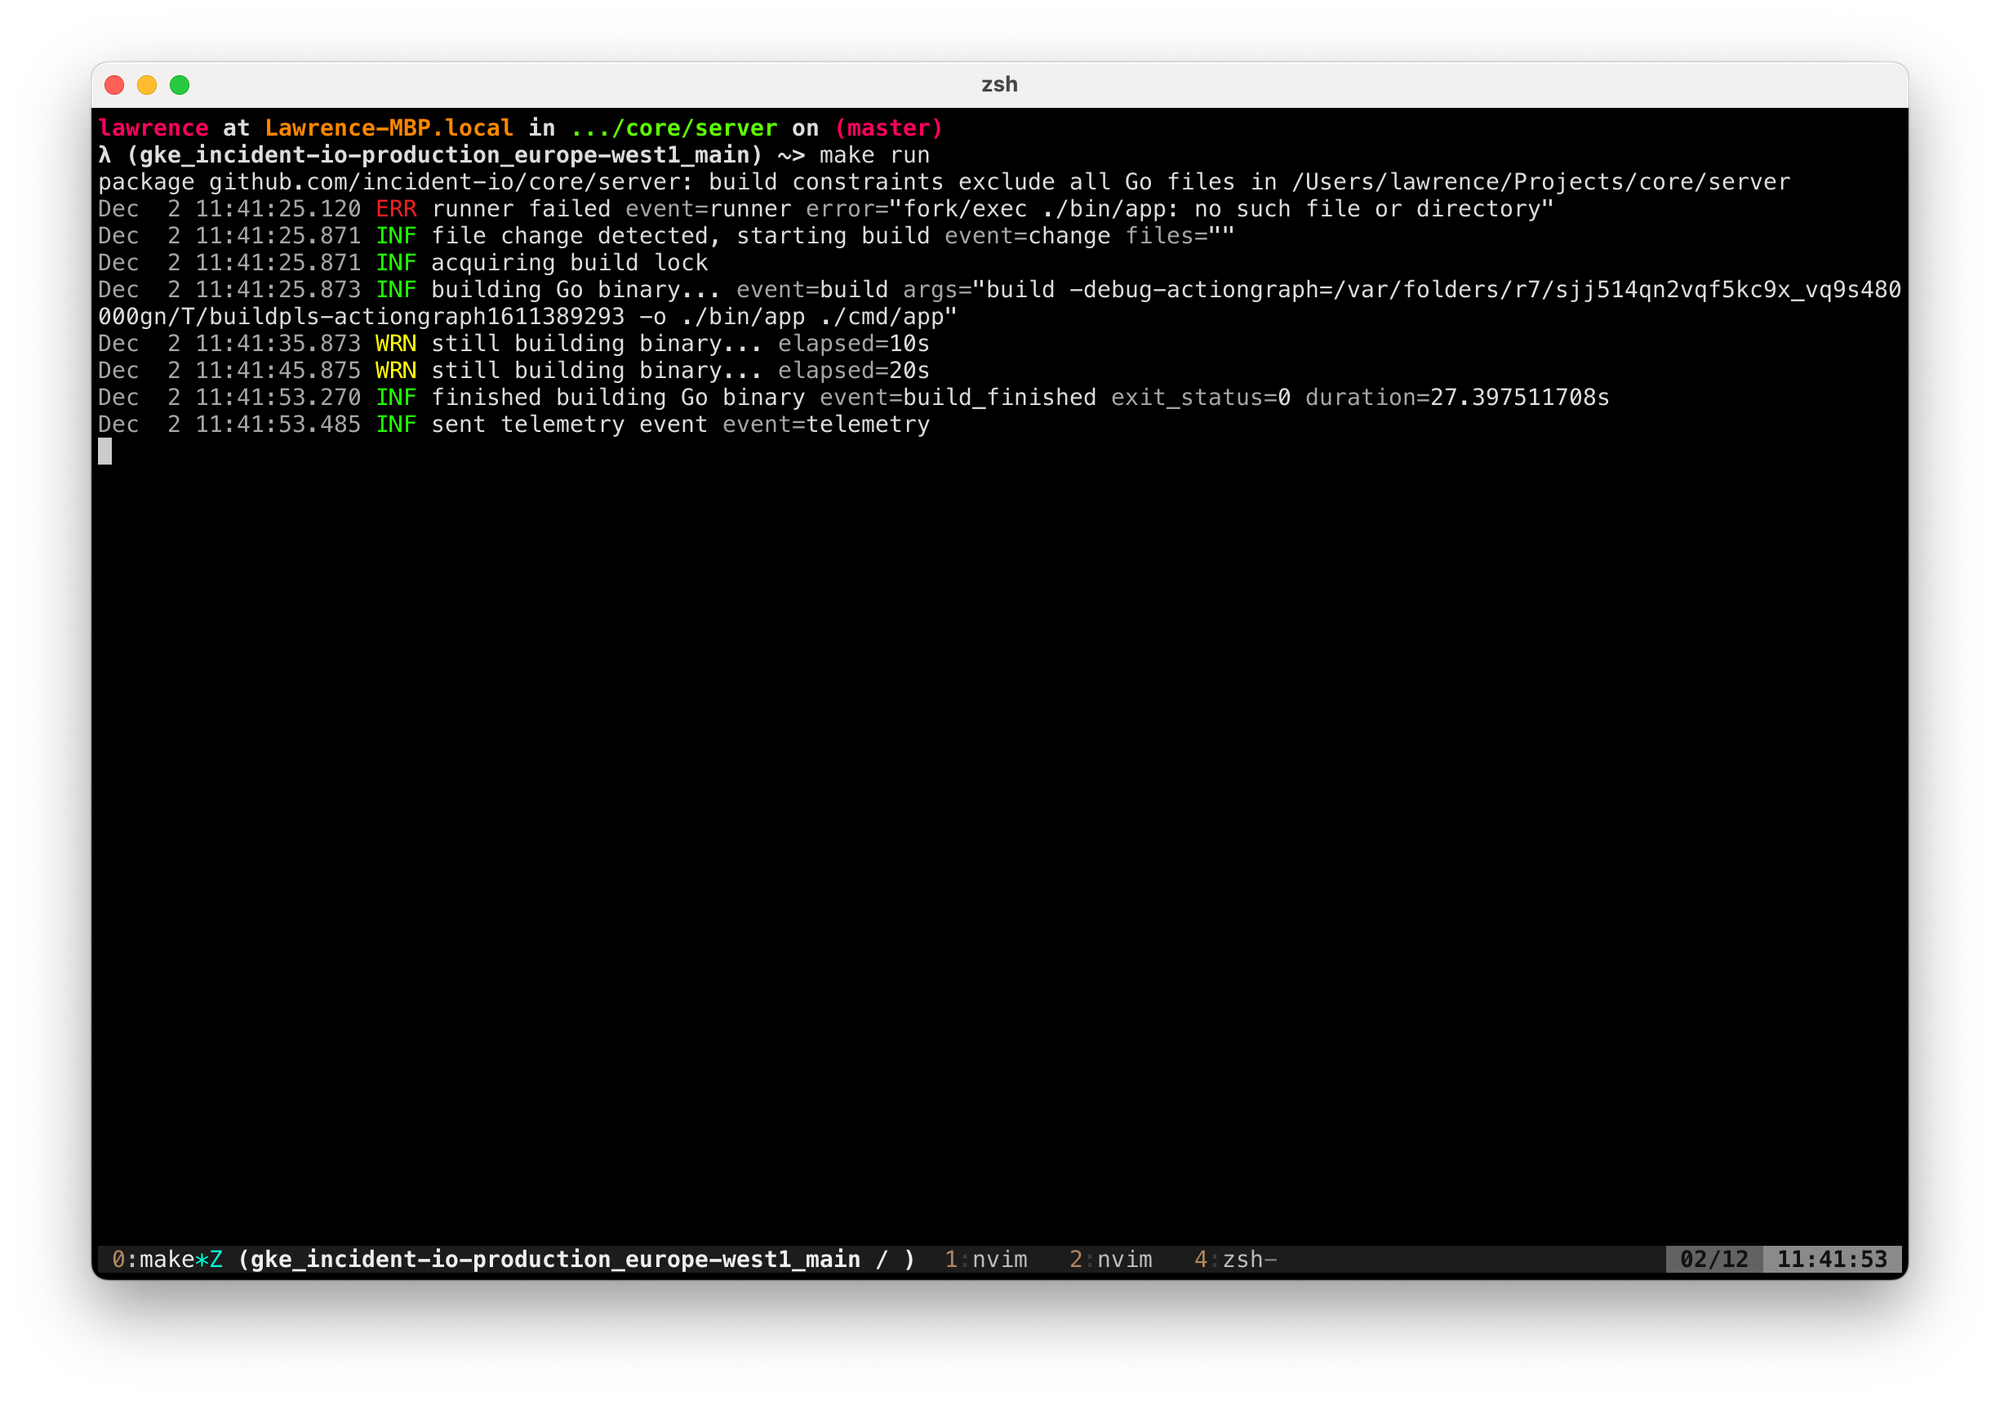
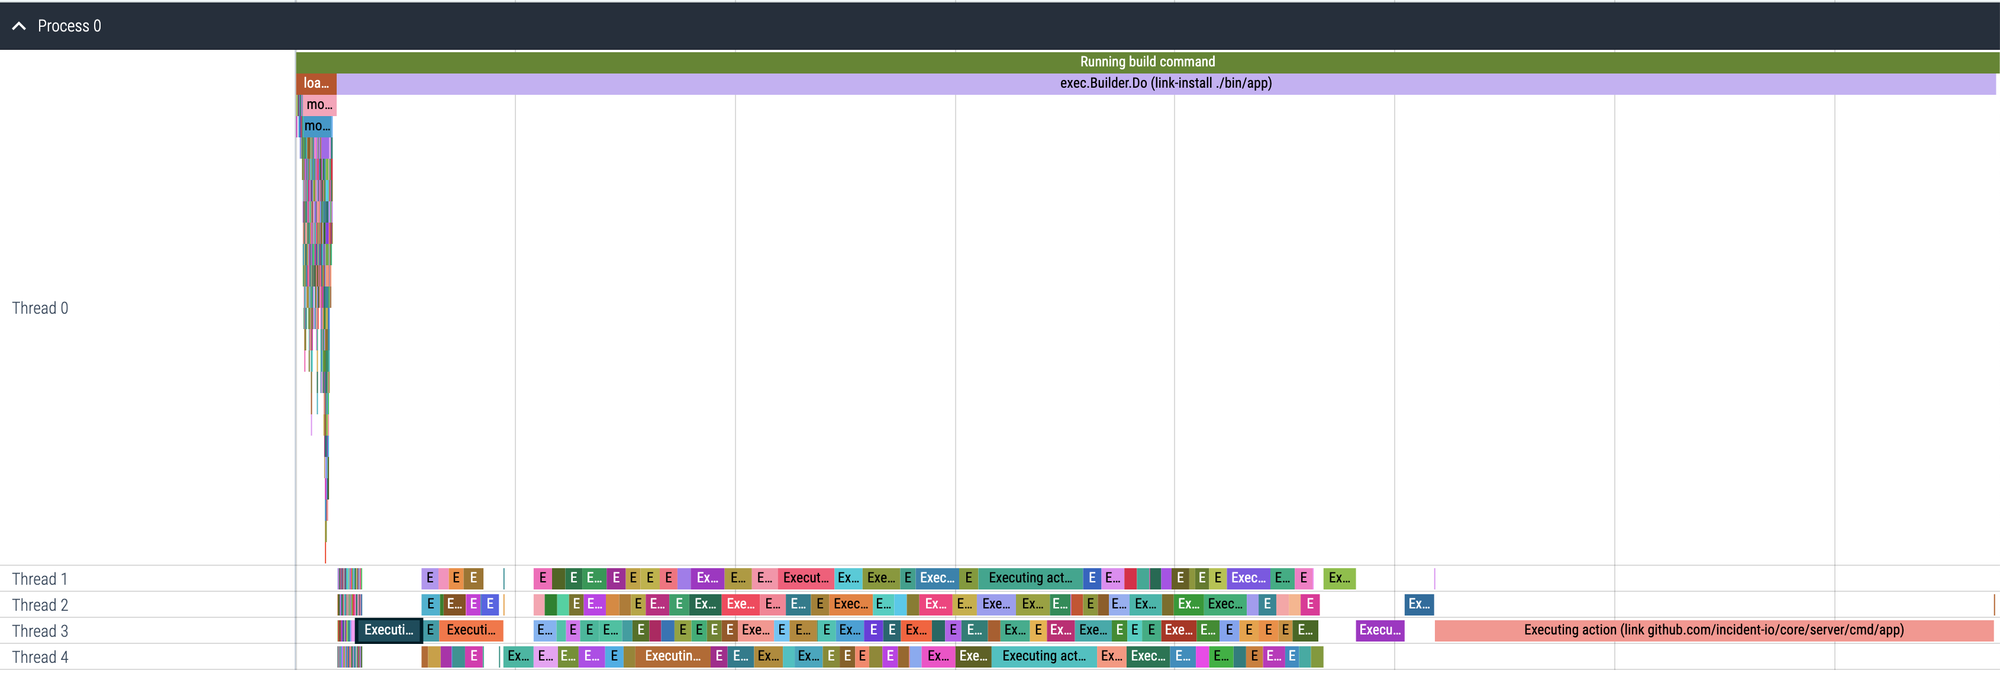
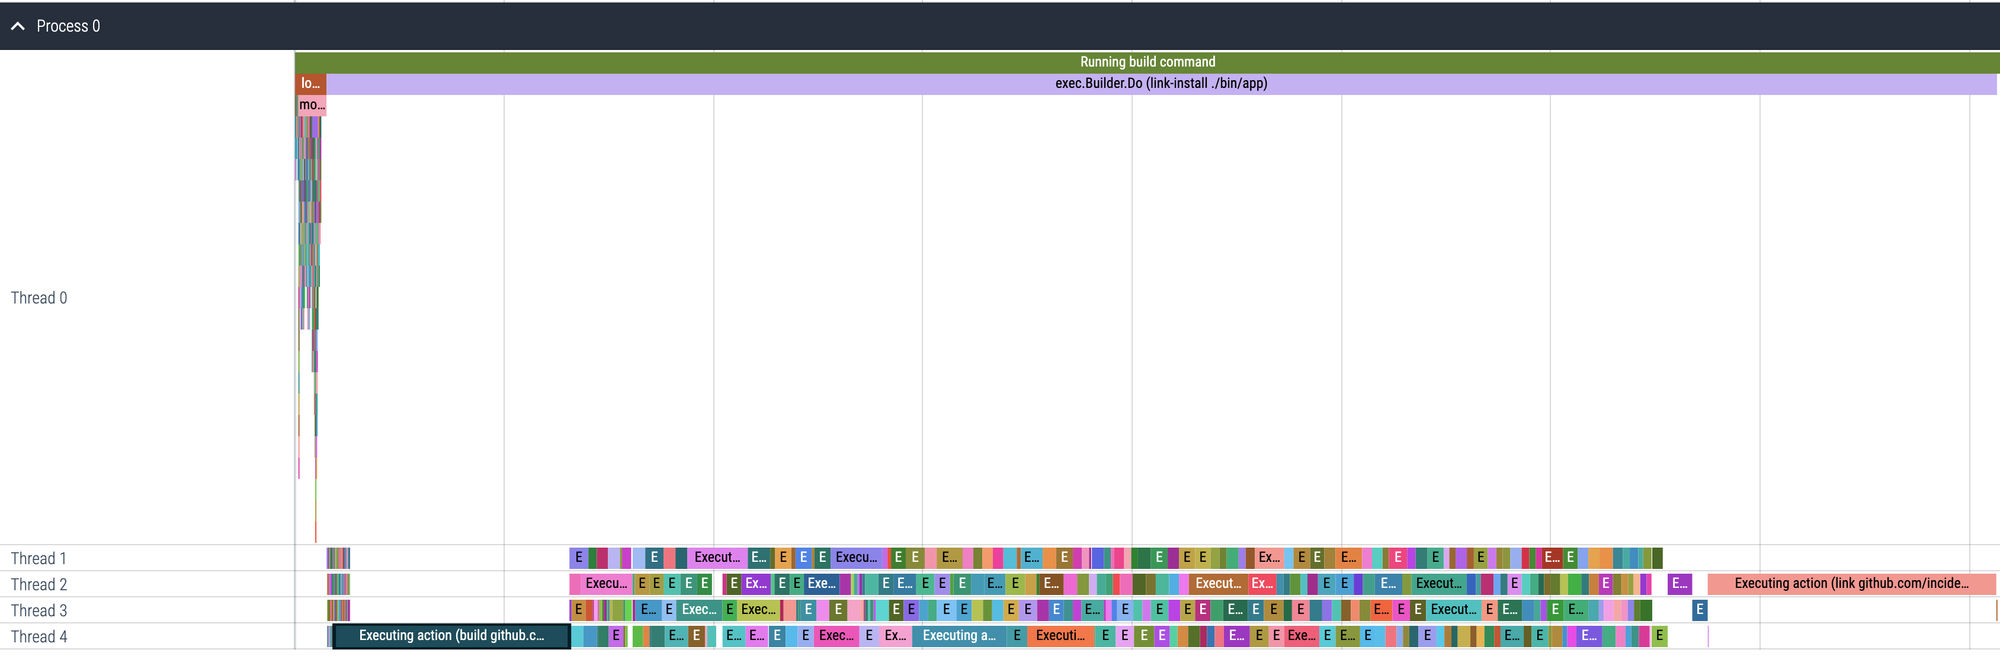
}Once we’d built the system + runtime collectors, it was simple to wrap a Go build command so we could extract build-specific measures like time in stage (linker, compile, etc) and track which files had caused us to trigger a build (more on why this is useful later).
The end result was hot-reloader we ran from our existing make run target.
This is an invisible change to our engineering team, but meant that now – on completion of every build – we’ll send telemetry events to an HTTP endpoint of our choosing. We set up a Fivetran webhook endpoint receiver (our ETL tool, see Modern data stack for startups) that could push the events into our data warehouse, and that was it!
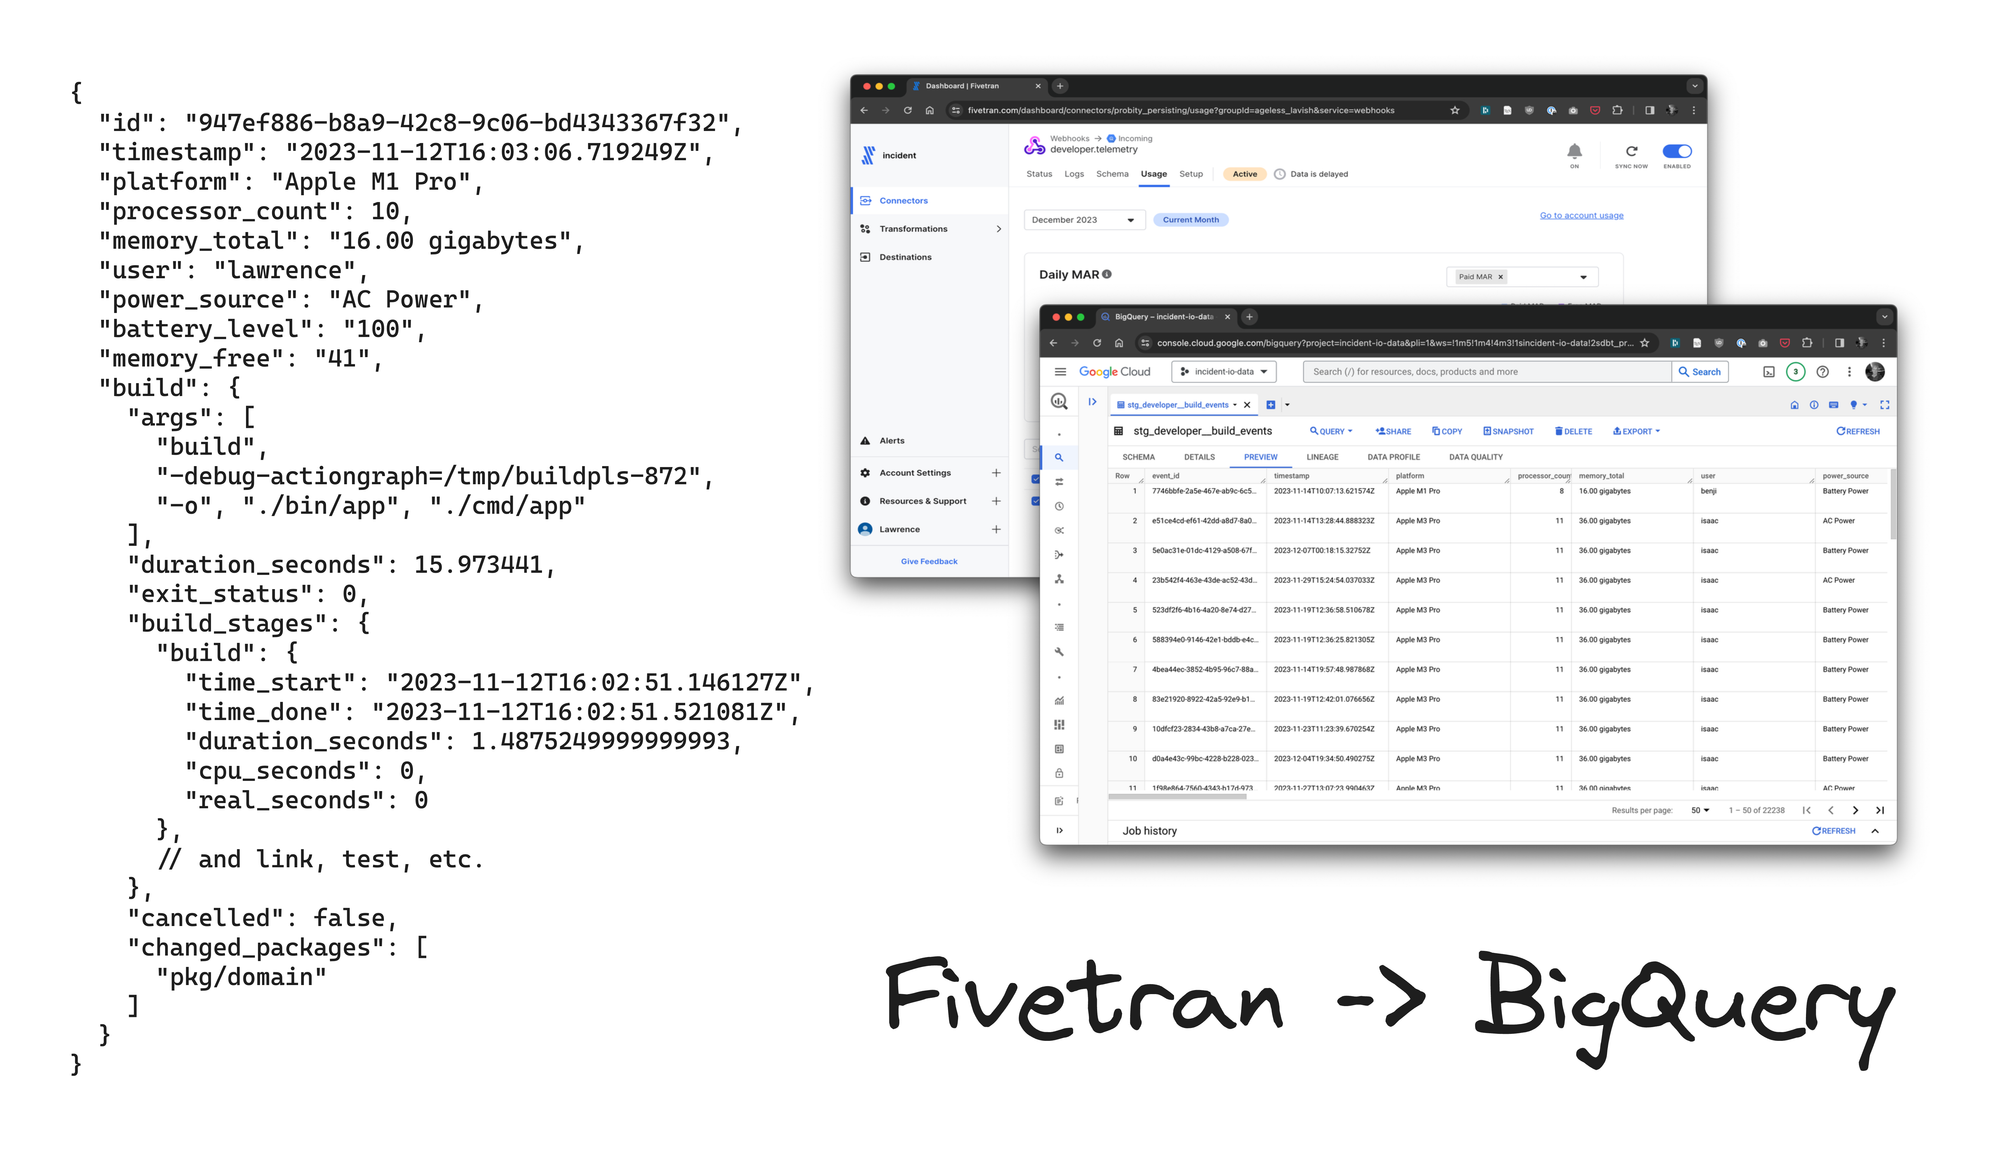
Finally, we have the data we need to judge our Mac Battle.
Analyzing the data
This is the part we were most excited about: having done the work to produce high-quality data and (impatiently) waited several weeks to build a large enough dataset, now was time to nerd-out and see what it can tell us.
It was particularly exciting because of the type of analysis it would require: most developers will know that build time is highly variable even on the same system. The Go compiler especially does a lot to cache builds, so even the most powerful M3 Max be much slower to build with no cache than an old Intel MacBook will with cache.
All this means we can’t just average the build times across platforms and straight up compare.
Instead, we’ll need to really dig into the underlying data, presenting a great opportunity (excuse?) to play with OpenAI’s fancy new code interpreter.
It’s almost a perfect use case for it, after all!
Creating an OpenAI assistant
We use OpenAI to power features like auto-generating incident summaries and (soon!) a chat interface to your incident data, so we have experience analyzing data with AI tools.
Generally, the process includes:
- Exporting your data to a CSV: we used BigQuery to export the results of
select * except(payload) from developer__build_events - Create an "Assistant" with a prompt explaining your purpose, and provide it the CSV file with your data.
We’re using the experimental gpt-4-1106-preview model to power our assistant, and enabled code interpreter to power the data analysis. It only took a few minutes before we had the assistant ready and responding to our questions in the playground.
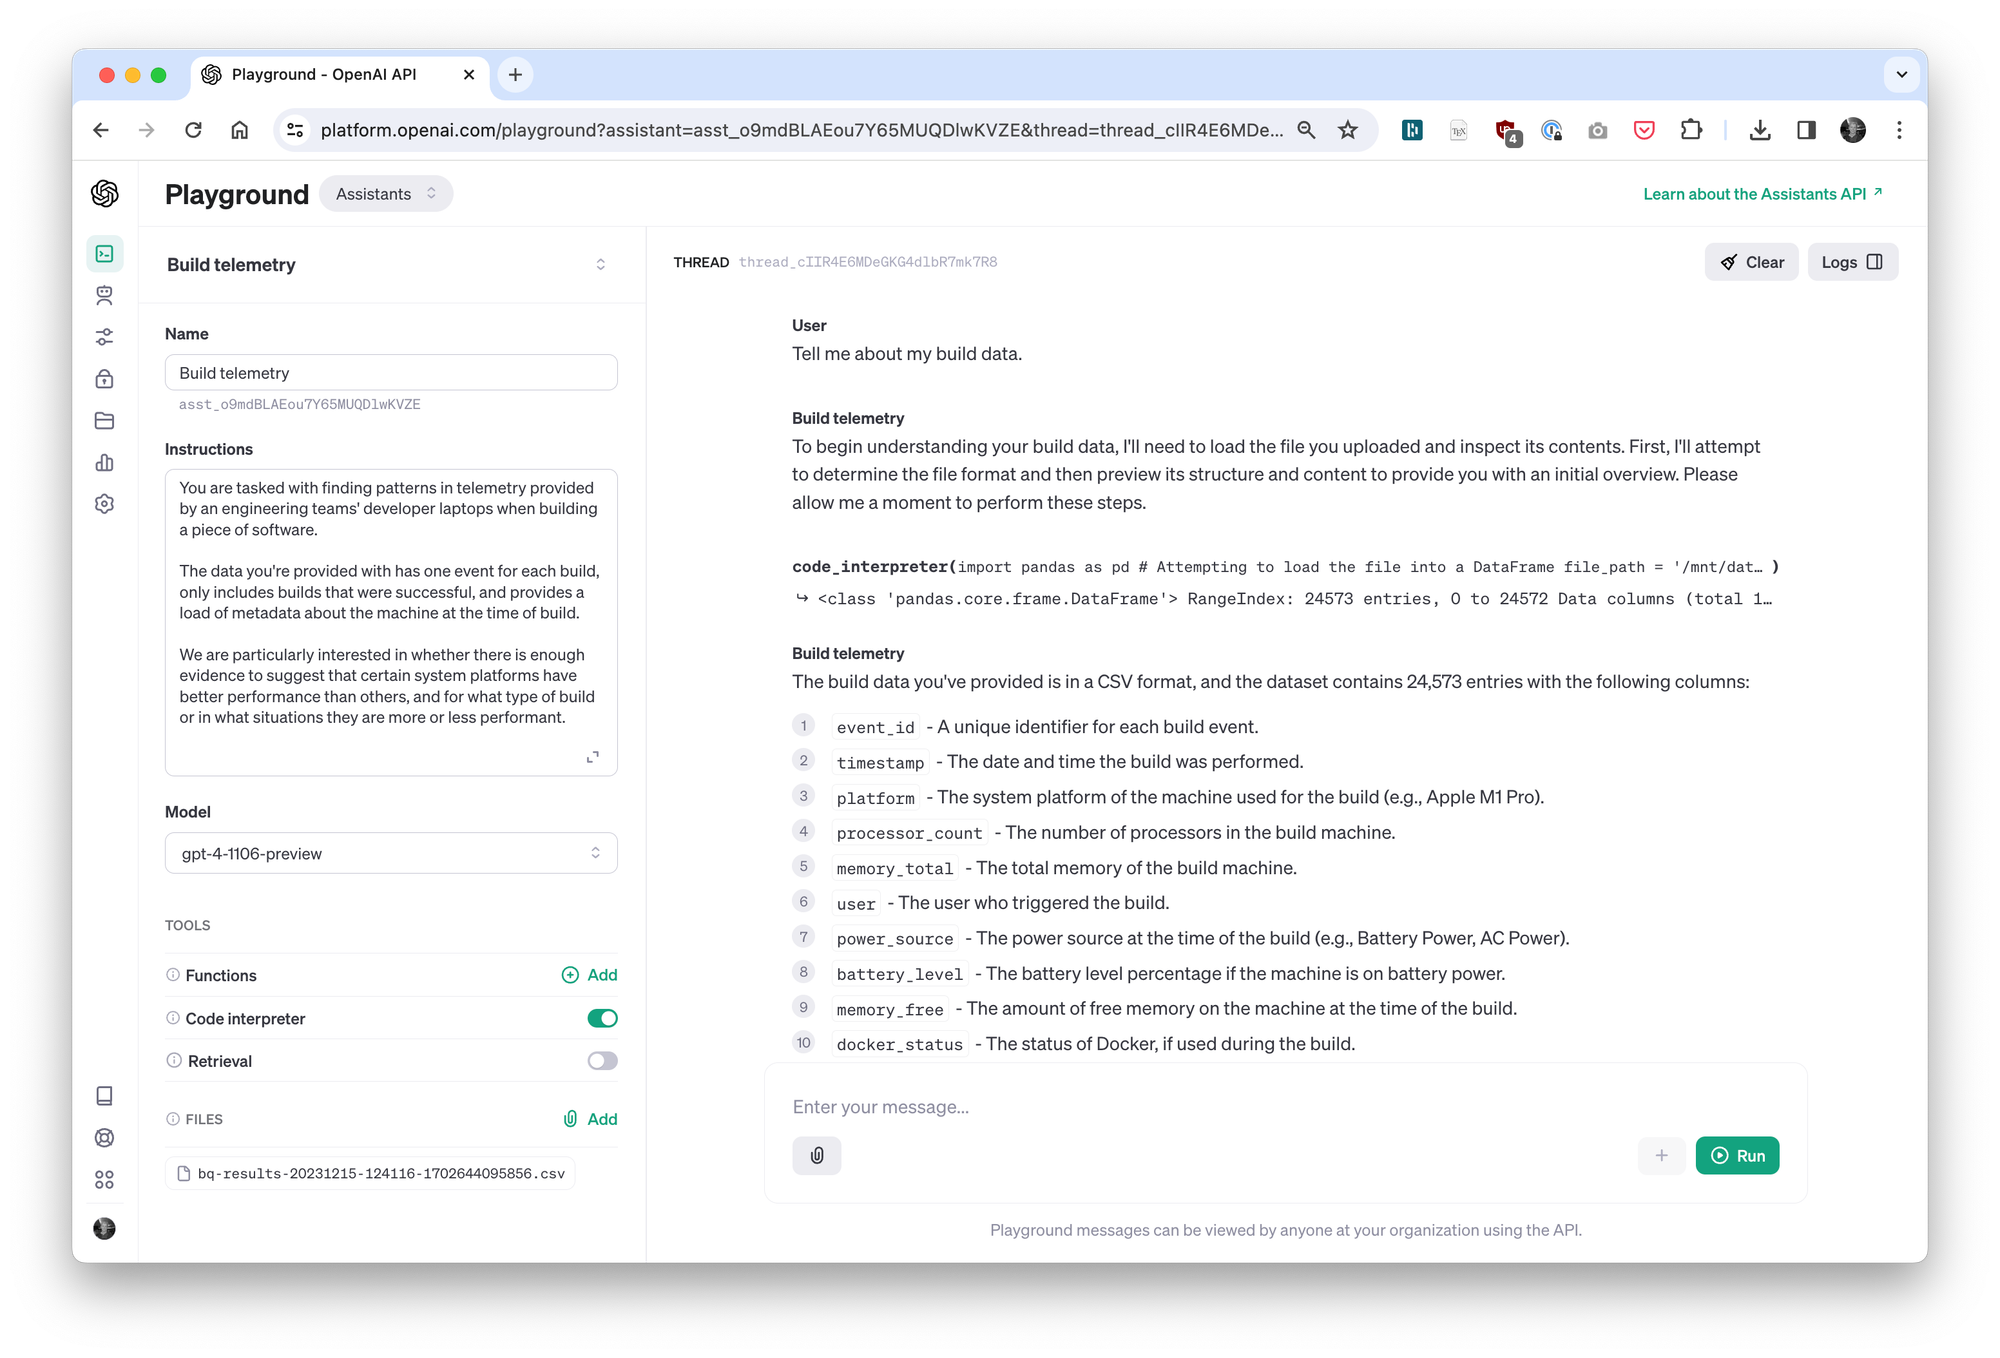
This is the interface we’ll use to query our data, simply by asking the assistant questions.
Cleaning data (power source, cancellations, etc.)
We have about 25k builds in our dataset taken from all times of the day, a variety of laptops, and many different conditions.
For us to make good comparisons between platforms, we’d want to establish as fair a comparison as possible for those builds, which means removing builds that have confounding factors.
- Failed or cancelled builds: if someone quits a build before it completes, we shouldn’t use that when examining build speed (it’s a job half-done).
- Running on battery power: OS X will throttle performance to preserve battery life.
Let’s get a picture of how many of our build events are unsuccessful, along with a sense of how many builds were for each platform.
Asking:
Show me the distribution of builds by machine platform, where the platforms are ordered by M1 to M3, and within the platform class Pro comes before Max.
Split each platform build count by whether the build was successful (exit status 0 and non-cancelled) vs failures.
I’m a visual learner, and would like to see these results where we order platforms by M1 to M3, and within each platform class Pro comes before Max.
Feels weird to be talking to a machine like this but…
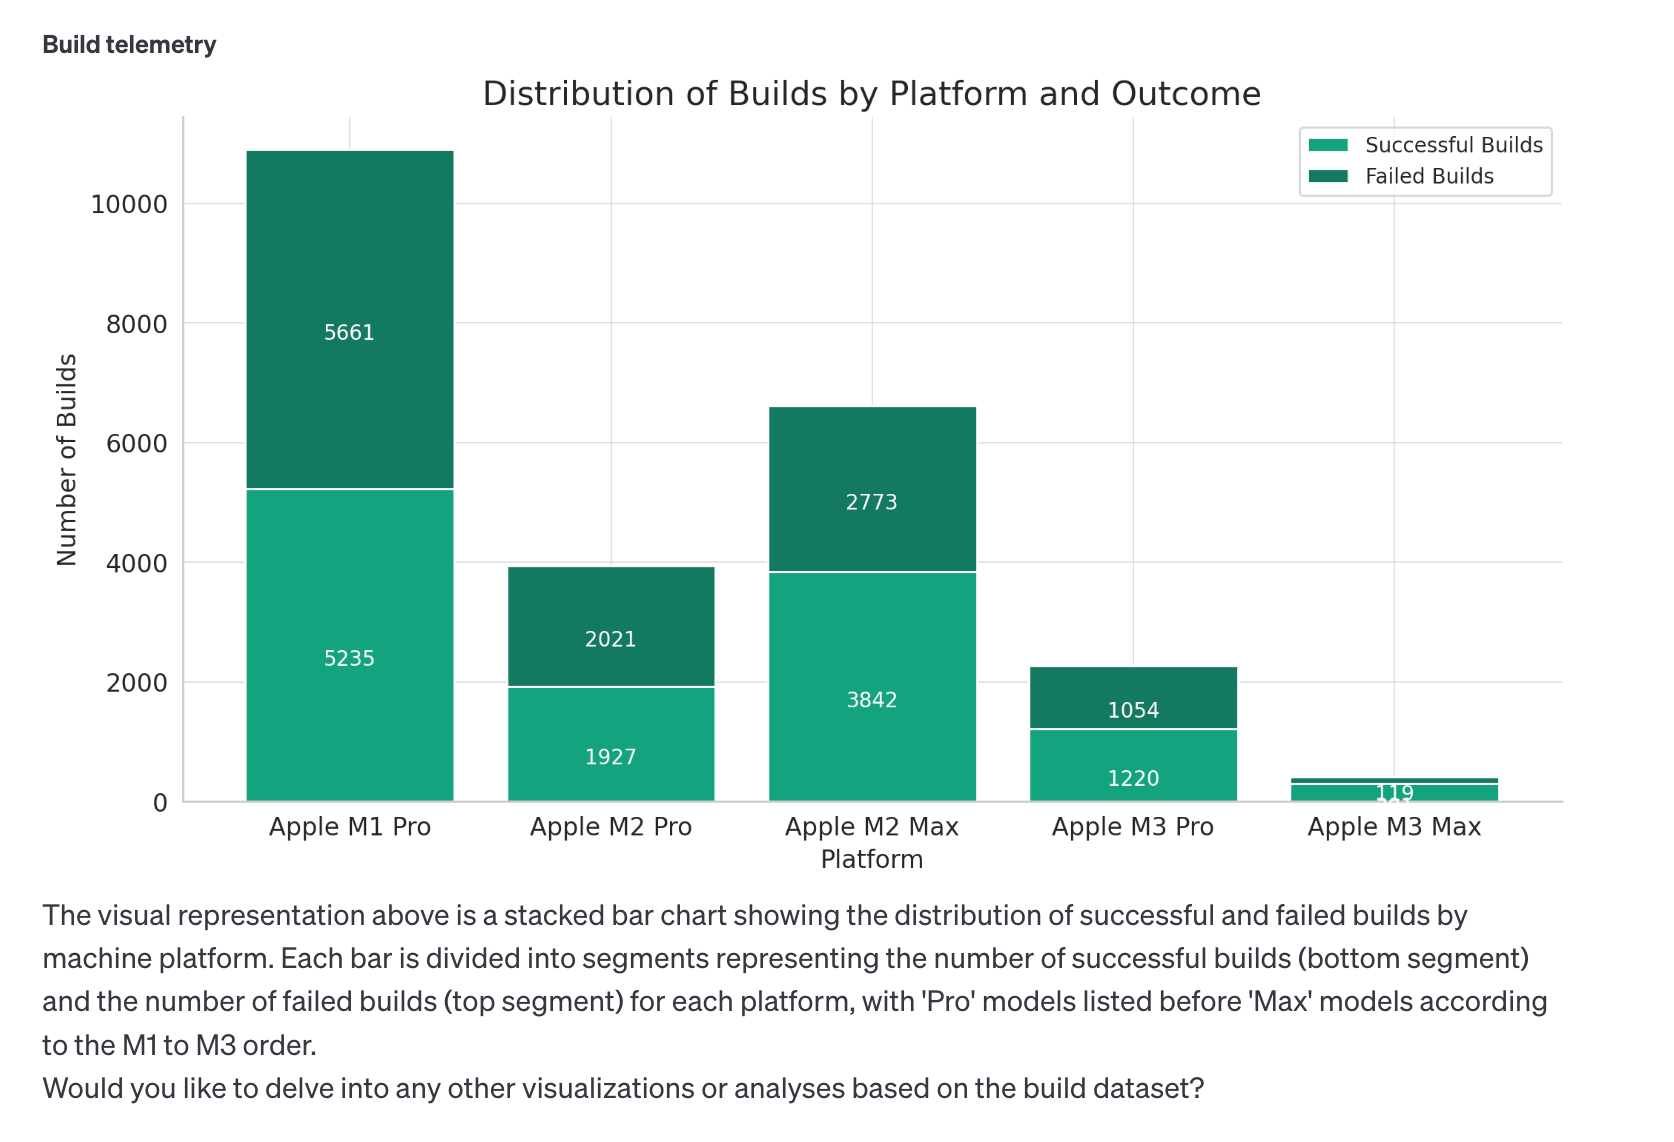
This is exactly what we asked for. Pretty wild, right?
Failed builds are almost never what we want, so we can instruct the assistant to drop these builds:
From this moment on, please exclude failed builds from the dataset.
🤖 I have excluded the failed builds from the dataset. We are now working with a subset that contains 12,525 successful builds.
We have this assumption that machines on battery power would be throttled, causing the build times to be poorly representative of general performance. I’d love to confirm this by comparing performance of of the same platform across power sources.
Asking:
Focusing only on successful builds with the Apple M1 Pro and Apple M2 Max platforms, can you visually compare the build duration across different power sources please?
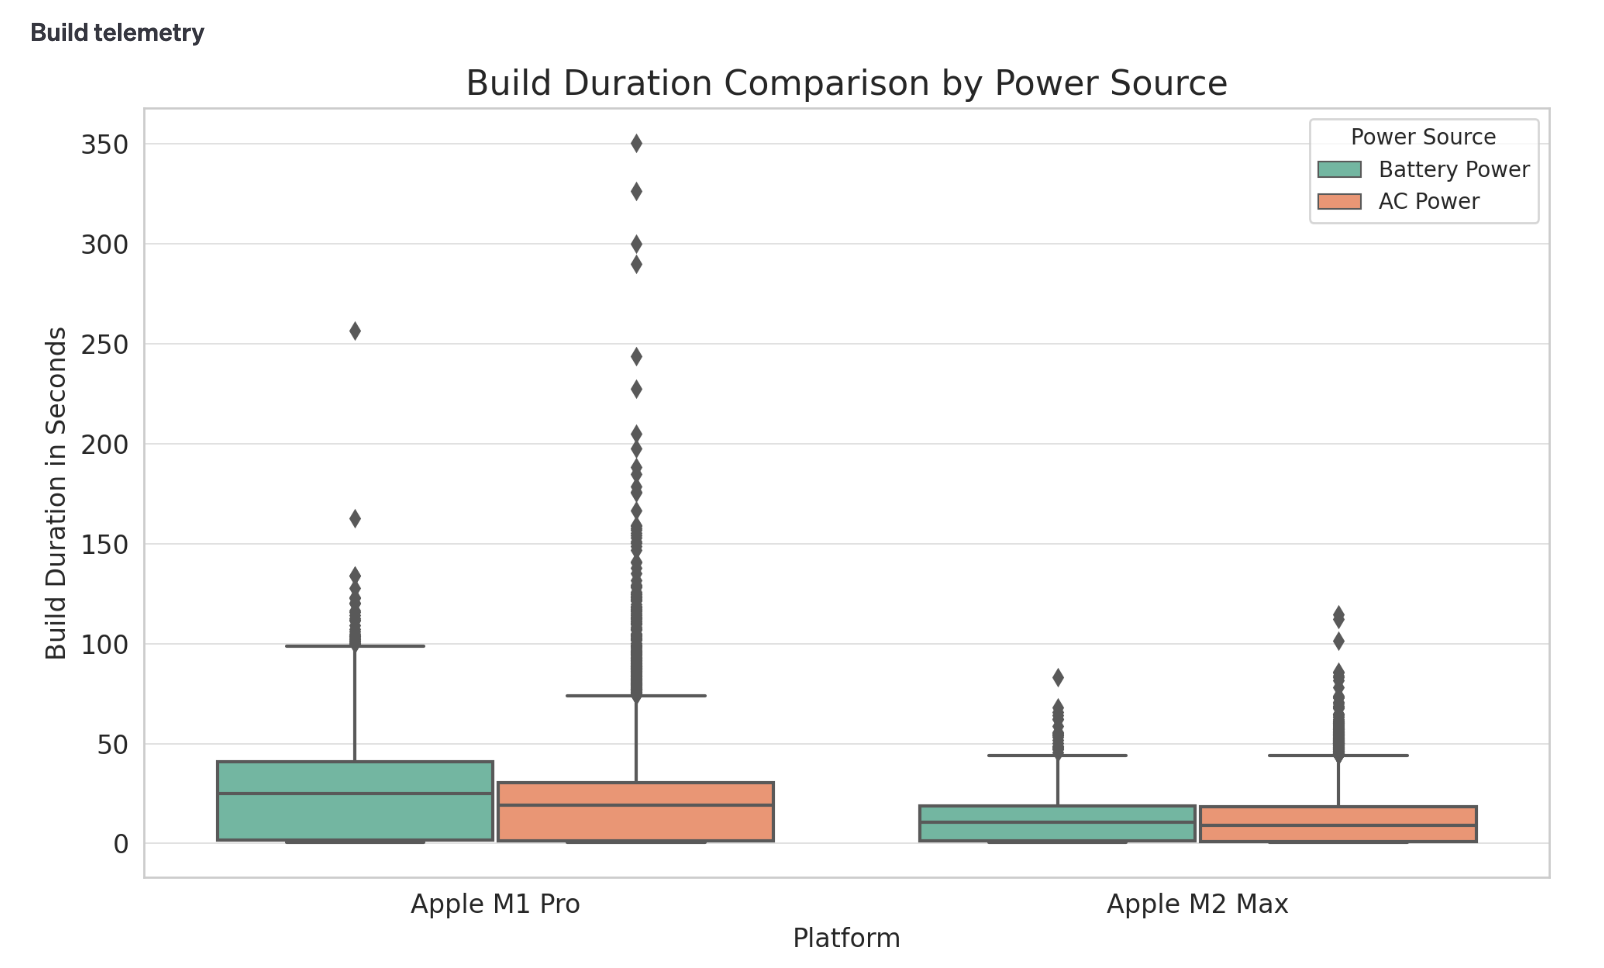
We can see that AC power is generally faster, even if we have longer builds in each AC power category (due to us doing many more builds on AC than on battery, thus finding more build outliers).
The cool thing about having an assistant, though, is you can ask it directly what it thinks:
In your opinion, does being on AC or battery power impact build performance?
🤖 I will compute the t-test for the successful builds dataset and report the p-value. A low p-value (typically less than 0.05) would suggest that there is a significant difference in build performance between AC and battery power.
…
The negative t-statistic indicates that the mean build duration on AC power is lower than on battery power. Moreover, with a p-value of approximately 0.0014, which is well below the common threshold of 0.05, we have sufficient evidence to reject the null hypothesis.
Given the results of this statistical test, we can conclude that being on AC or battery power does impact build performance across all platforms, with builds on AC power tending to be faster than those on battery power.
That clears it up: we’ll consider only successful and AC powered builds from now on!
Not all builds are equal
We keep a close eye on build performance for our Go monolith: while buying hardware is one way to speed things up, nothing beats removing or fine-tuning the build process itself.
For this reason, we’re well aware that depending on what you try to build, you might get very different build times.
That’s because Go projects comprise of many "packages" (code modules) that the Go compiler will cache and only recompile if it thinks something has changed. Our app is deliberately architected for a wide dependency graph with few modules at the base to avoid most changes having to recompile the entire graph, but some level of dependency nesting is unavoidable.
This means builds tend to be either:
Instant (<3s)
Your change is not relevant to the Go compiler, in that you haven’t done anything to modify package symbols and can get away with providing a binary directly from cache, no compilation or expensive linking necessary.
Fast (<30s)
You’re changing a single package with few dependents, so much of the app is cached and only your package needs compiling. The majority of the time is spent on linking the newly compiled package against the existing cache.
Medium (30s-1m)
You’ve modified a feature package with a few sub-package dependencies, but the majority of the app remains unchanged and Go can reuse the cache.
Slow (1m+)
You’ve added a type to our base domain package and now every package in the app needs recompiling.
Whatever measurements we use to draw comparisons, we need to be aware of these variations so we can avoid an apples-oranges situation.
Comparing M1 Pro and M2 Max build speeds
Now we’ve cleaned our data to be just AC powered + successful builds and understand a bit more about how build times might vary, we can begin comparing platforms to one another.
Let’s start by asking:
Focusing on just the M1 Pro and M2 Max (as these are the platforms we have the most data on) can you chart two histograms showing successful build durations, removing extreme outliers.
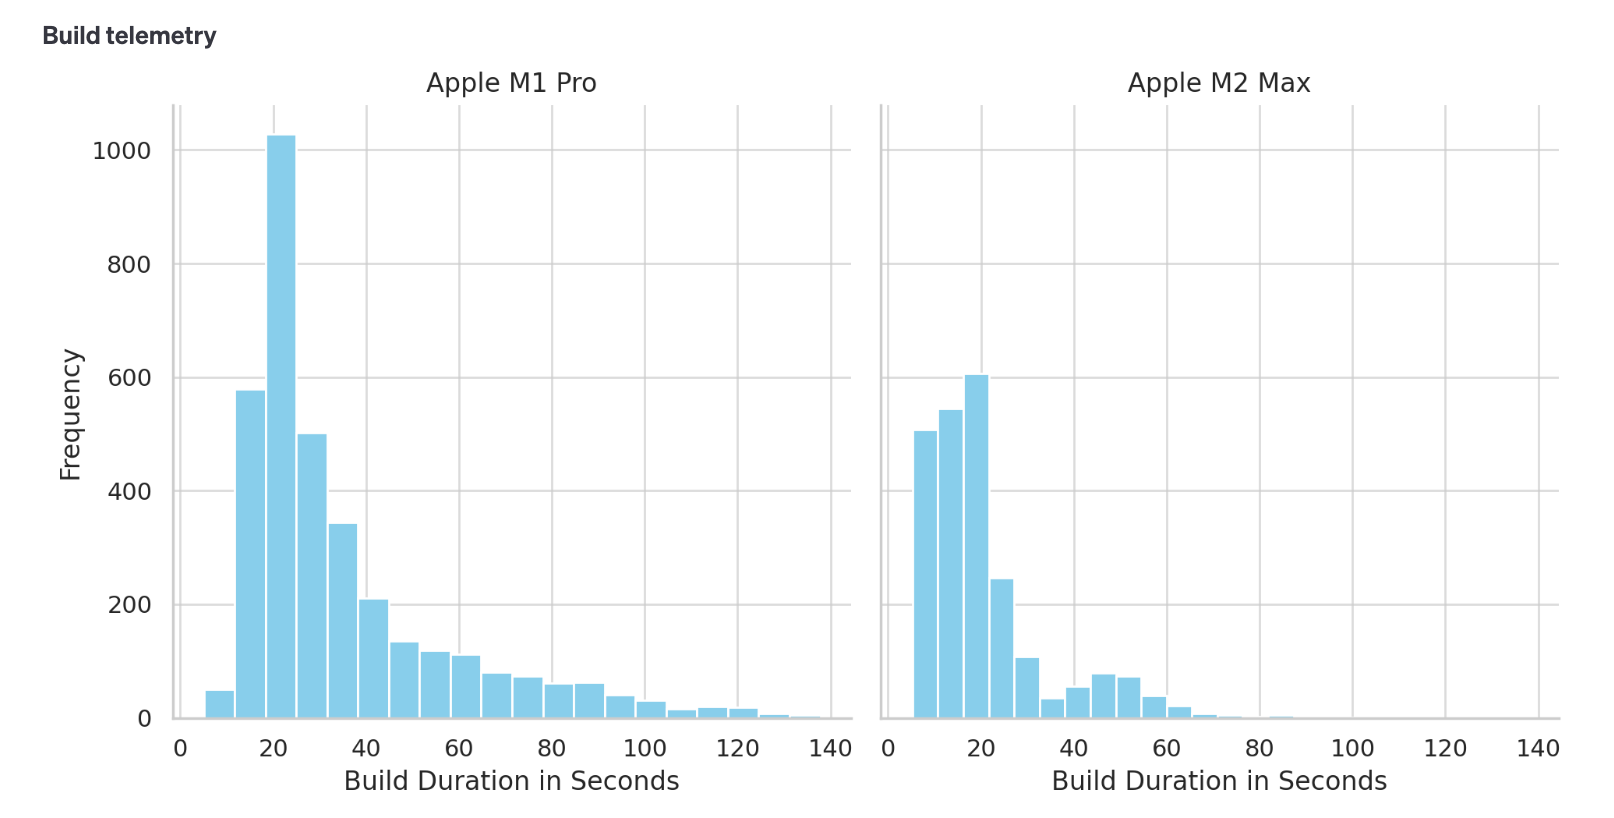
Overall, it’s clear the M2 Max totally destroys the M1 Pro in terms of build speed. But what we haven’t shared so far is that these machines differ in more than just chipset…
Can you show me how the build events split by machine platform and memory configuration please?
🤖 Here is the number of successful build events for each memory configuration within each platform:
- Apple M1 Pro with 16GB: 5,235 build events
- Apple M2 Pro with 16GB: 1,927 build events
- Apple M2 Max with 32GB: 3,842 build events
- Apple M3 Pro with 18GB: 321 build events
- Apple M3 Pro with 36GB: 899 build events
- Apple M3 Max with 36GB: 301 build events
Hmm, interesting. So the comparison between our M1 Pros and M2 Max is somewhat unfair as the M2s all have 32GB of memory which is twice that of the M1s (16GB).
That could be the reason the performance is so different (despite claims that Apple machines need little RAM…) and would be useful to know when deciding what specification of M3 we should upgrade to.
Thankfully we have 2k build events from an M2 Pro with 16GB of memory, so…
Can you redraw the histogram comparison of build durations, this time for the Apple M2 Pro 16GB and the Apple M2 Max 32GB normalized, please?
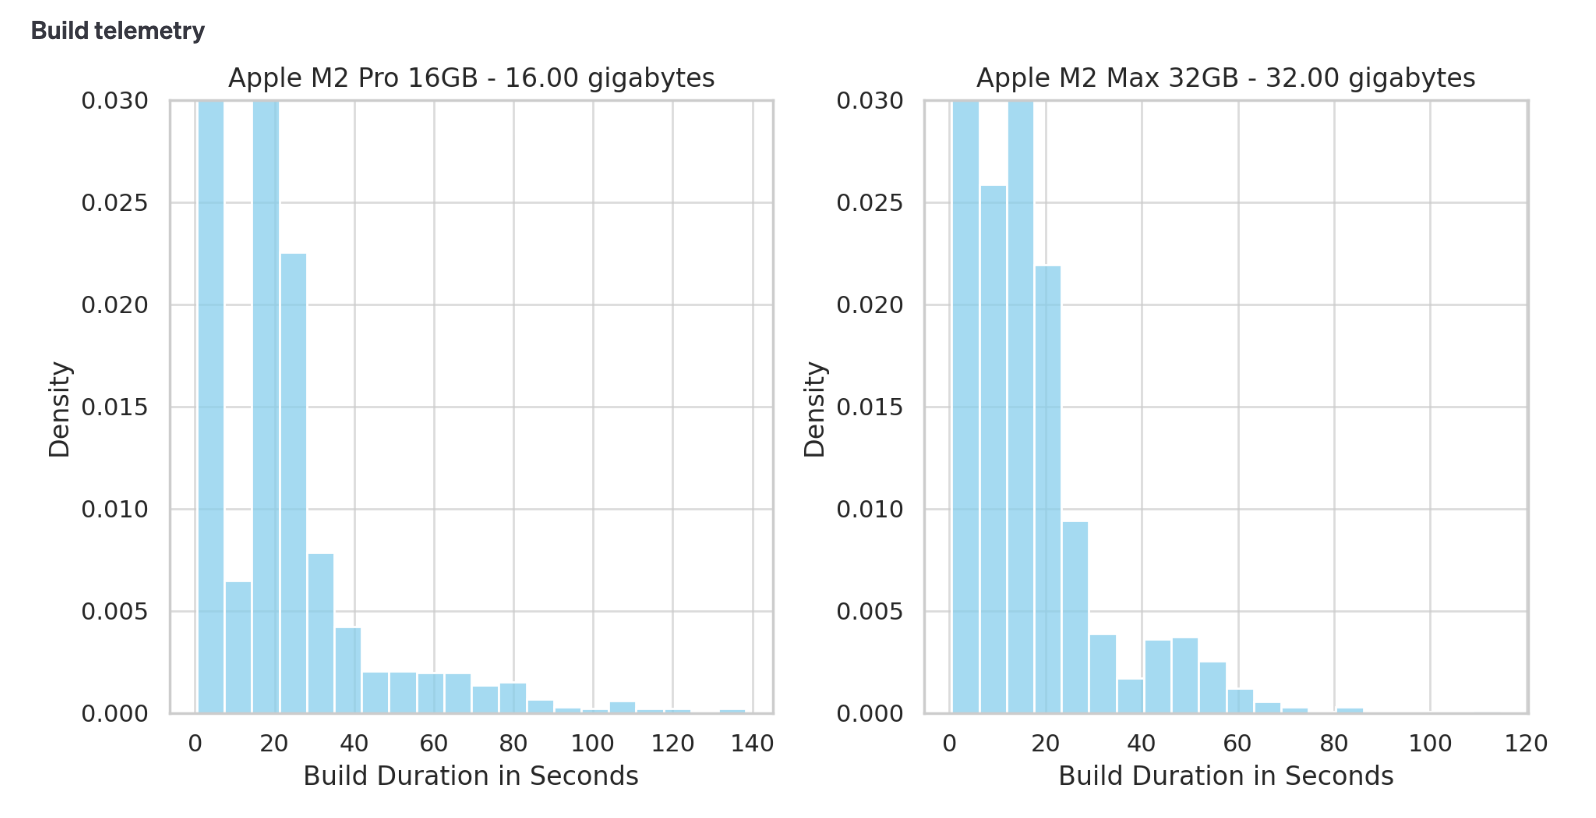
As a primer: M2 Pro and M2 Max are mostly the same chip, with the main difference being that the Max has two additional "energy efficient" cores. Those cores are ~1/5th as powerful as the performance cores and will contribute minimally to compiling a Go program, and therefore our build durations.
This comparison, then, is quite useful: it implies the 32GB is making little impact, perhaps only contributing to the higher density of fast build times, but overall not very noticeable.
Evaluating the M3
From what we’ve seen so far, the M2 Pro at 16GB memory seems the best value for money, almost twice as fast as the M1 and minimally slower than the M2 Max (even when the Max has twice the memory).
Now we need to figure out if the M3 is a meaningful improvement over the M2, and for that we needed to buy some laptops.
We purchased:
- M3 Pros, 12 cores (6 performance, 6 energy-efficiency)
- 1x 18GB memory
- 1x 36GB memory
- M3 Max, 14 cores (10 performance, 4 energy-efficiency)
- 1x 36GB
Three laptops in total, with the Pros differing in memory, while the Max is an attempt to measure if we’ll see much difference for those extra 4 P-cores.
If we begin with the Pros:
Show me histograms of build duration for the M3 Pro 18GB and M3 Pro 36GB.
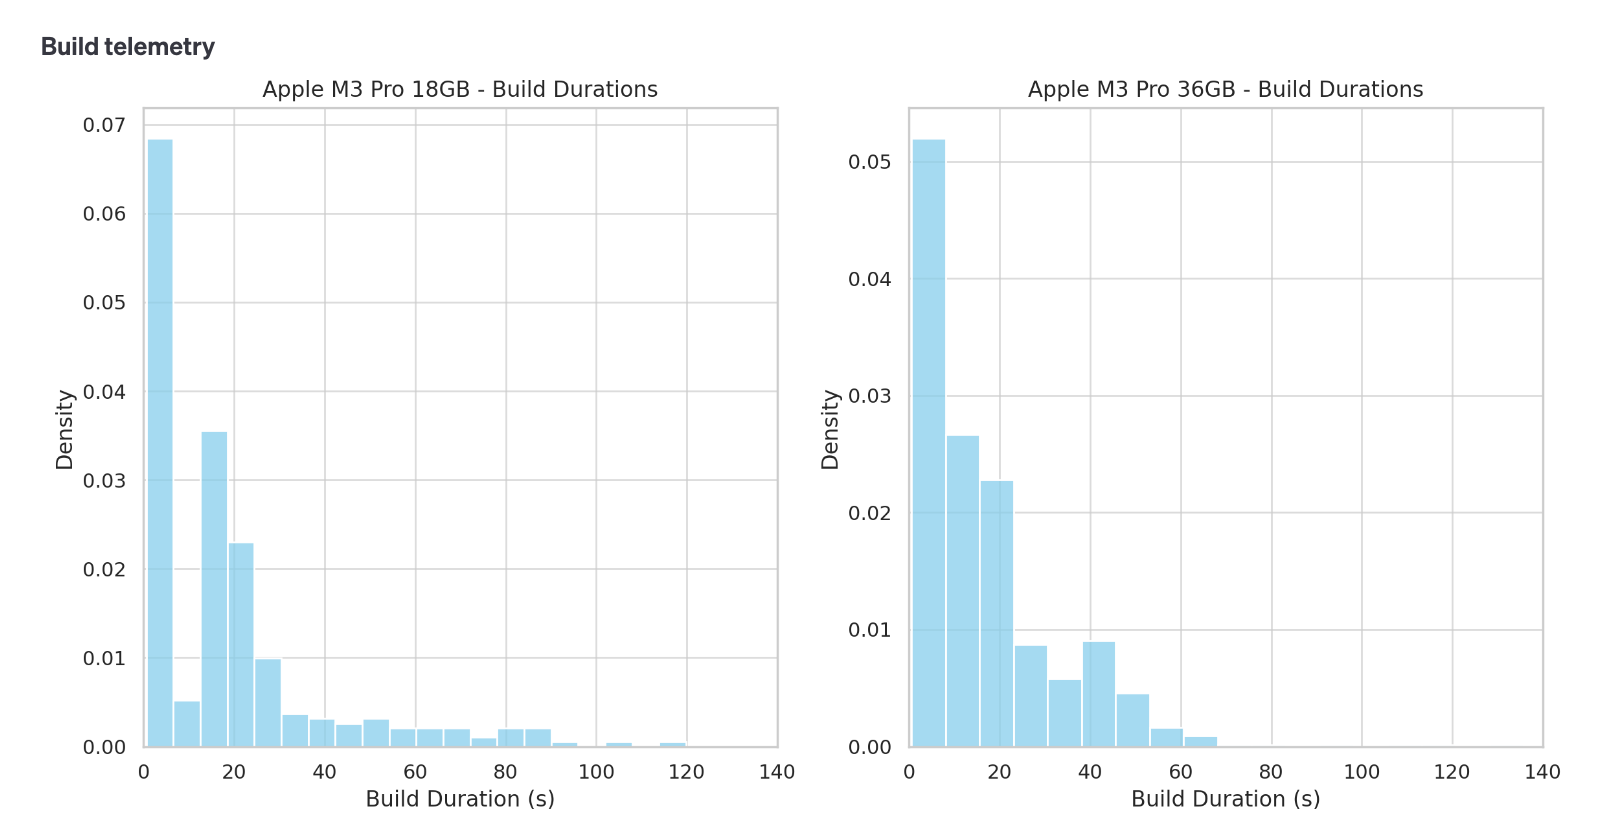
We’ve previously concluded that memory makes little difference to build performance, so it’s unsurprising these graphs look similar.
In fact, I’d expect them to look even closer than they do, but we’re suffering from a lack of data with far fewer builds for the M3s than we have for other platforms.
As we’re low on data, let’s combine the results for both M3 Pros, especially as we think they’re quite similar.
Show me histograms of build duration for the M3 Pro 18GB and 36GB combined vs the M3 Max, removing very quick builds (<3s).
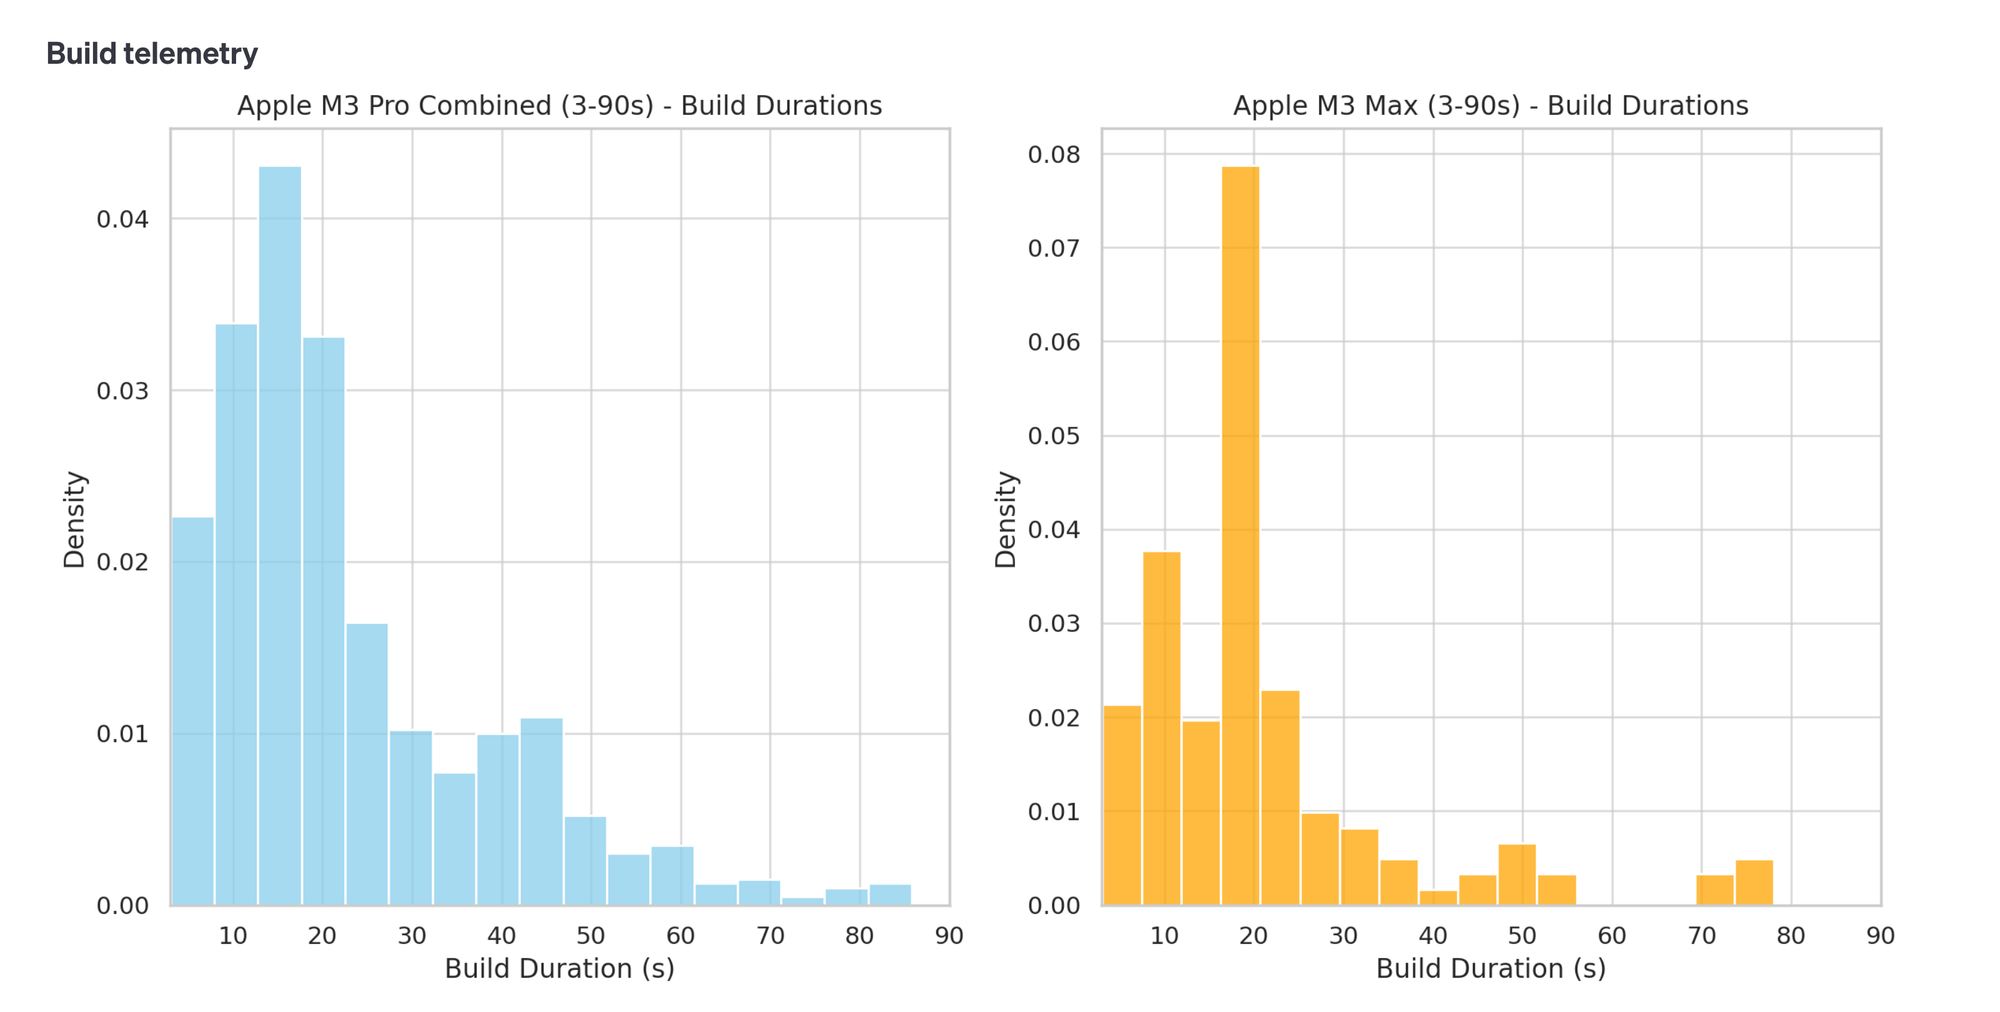
Again, we’re suffering from much less data here, but even so it’s not looking like the M3 Max is doing anything truly remarkable beyond the already-fast M3 Pro.
At least, not enough to justify the 60% price increase over the base M3 Pro.
Putting it all together: M1, M2, M3
By now, we’ve:
- Established a baseline for M1 machines.
- Determined that M2 machines are fairly equal, irrespective of memory or additional cores.
- M3 is also similar across Pro and Max.
It’s time to get a full picture of how these platforms compare…
Show me histograms comparing build duration across all platform and memory combinations, excluding builds that complete in <3s.
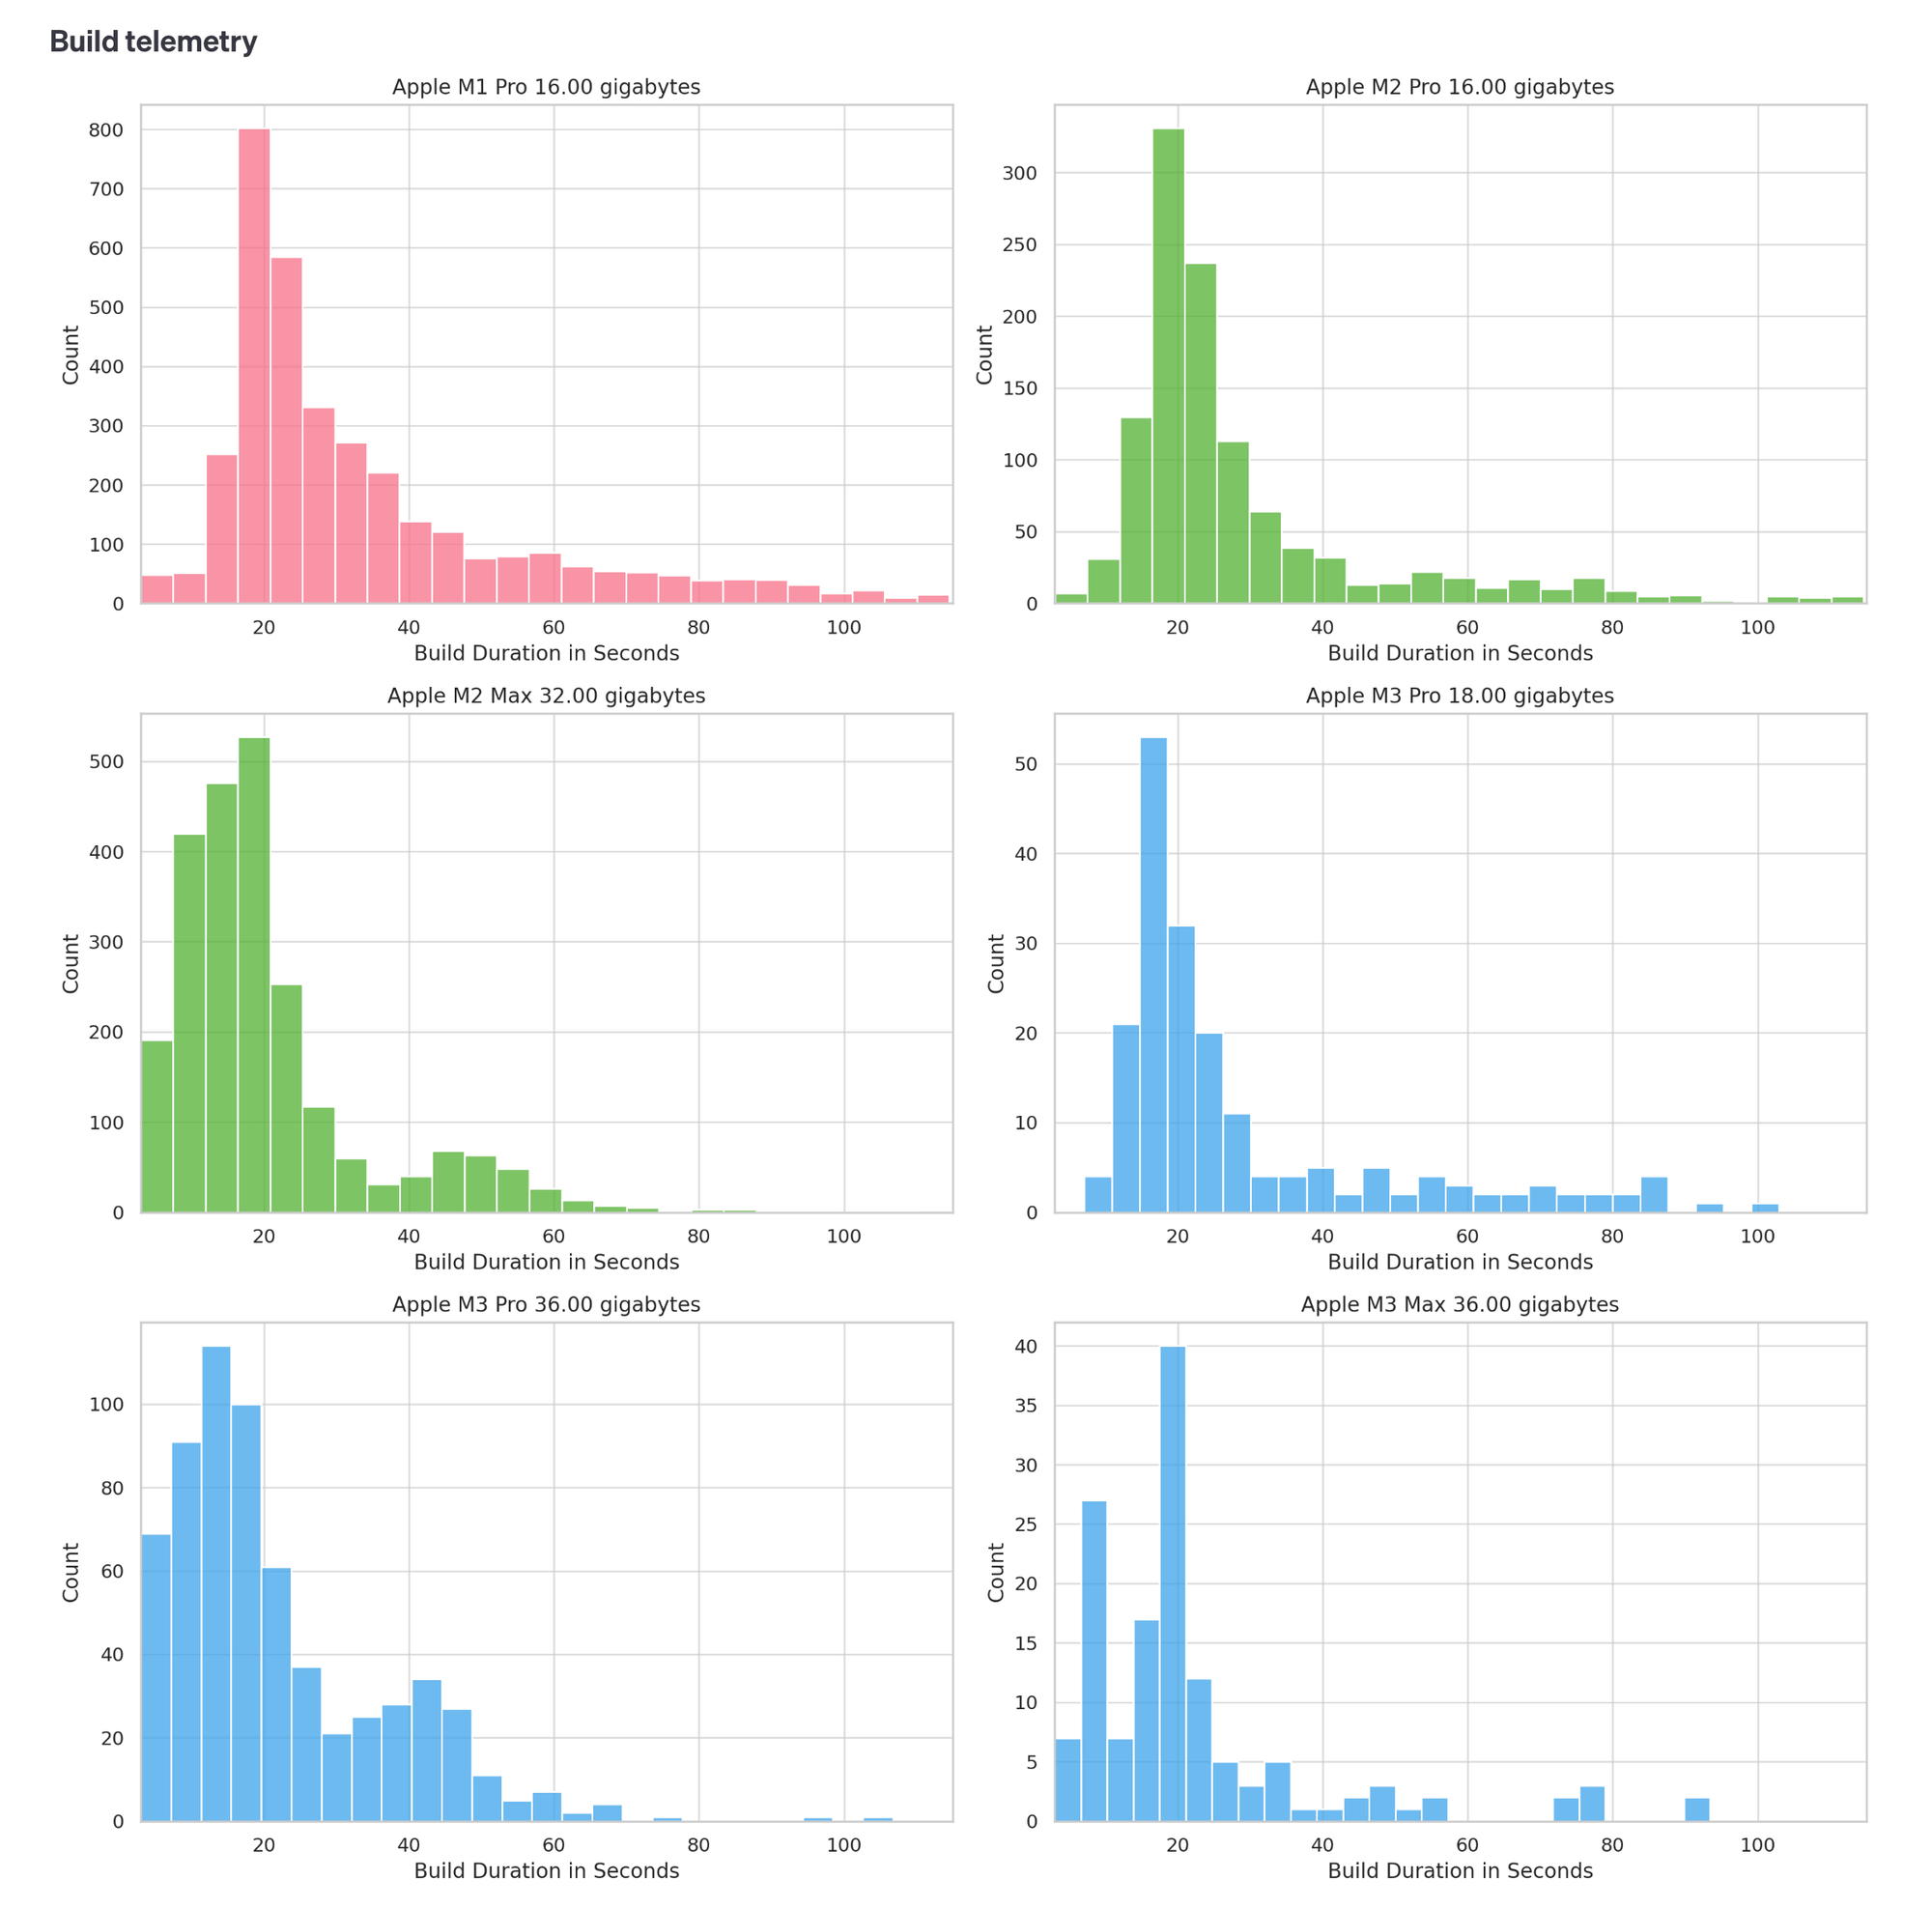
It’s clear that variation within platforms (colored) is minimal, so for the purposes of our comparison…
Please repeat the above but with one histogram per-row and combining the M1, M2 and M3 platforms.
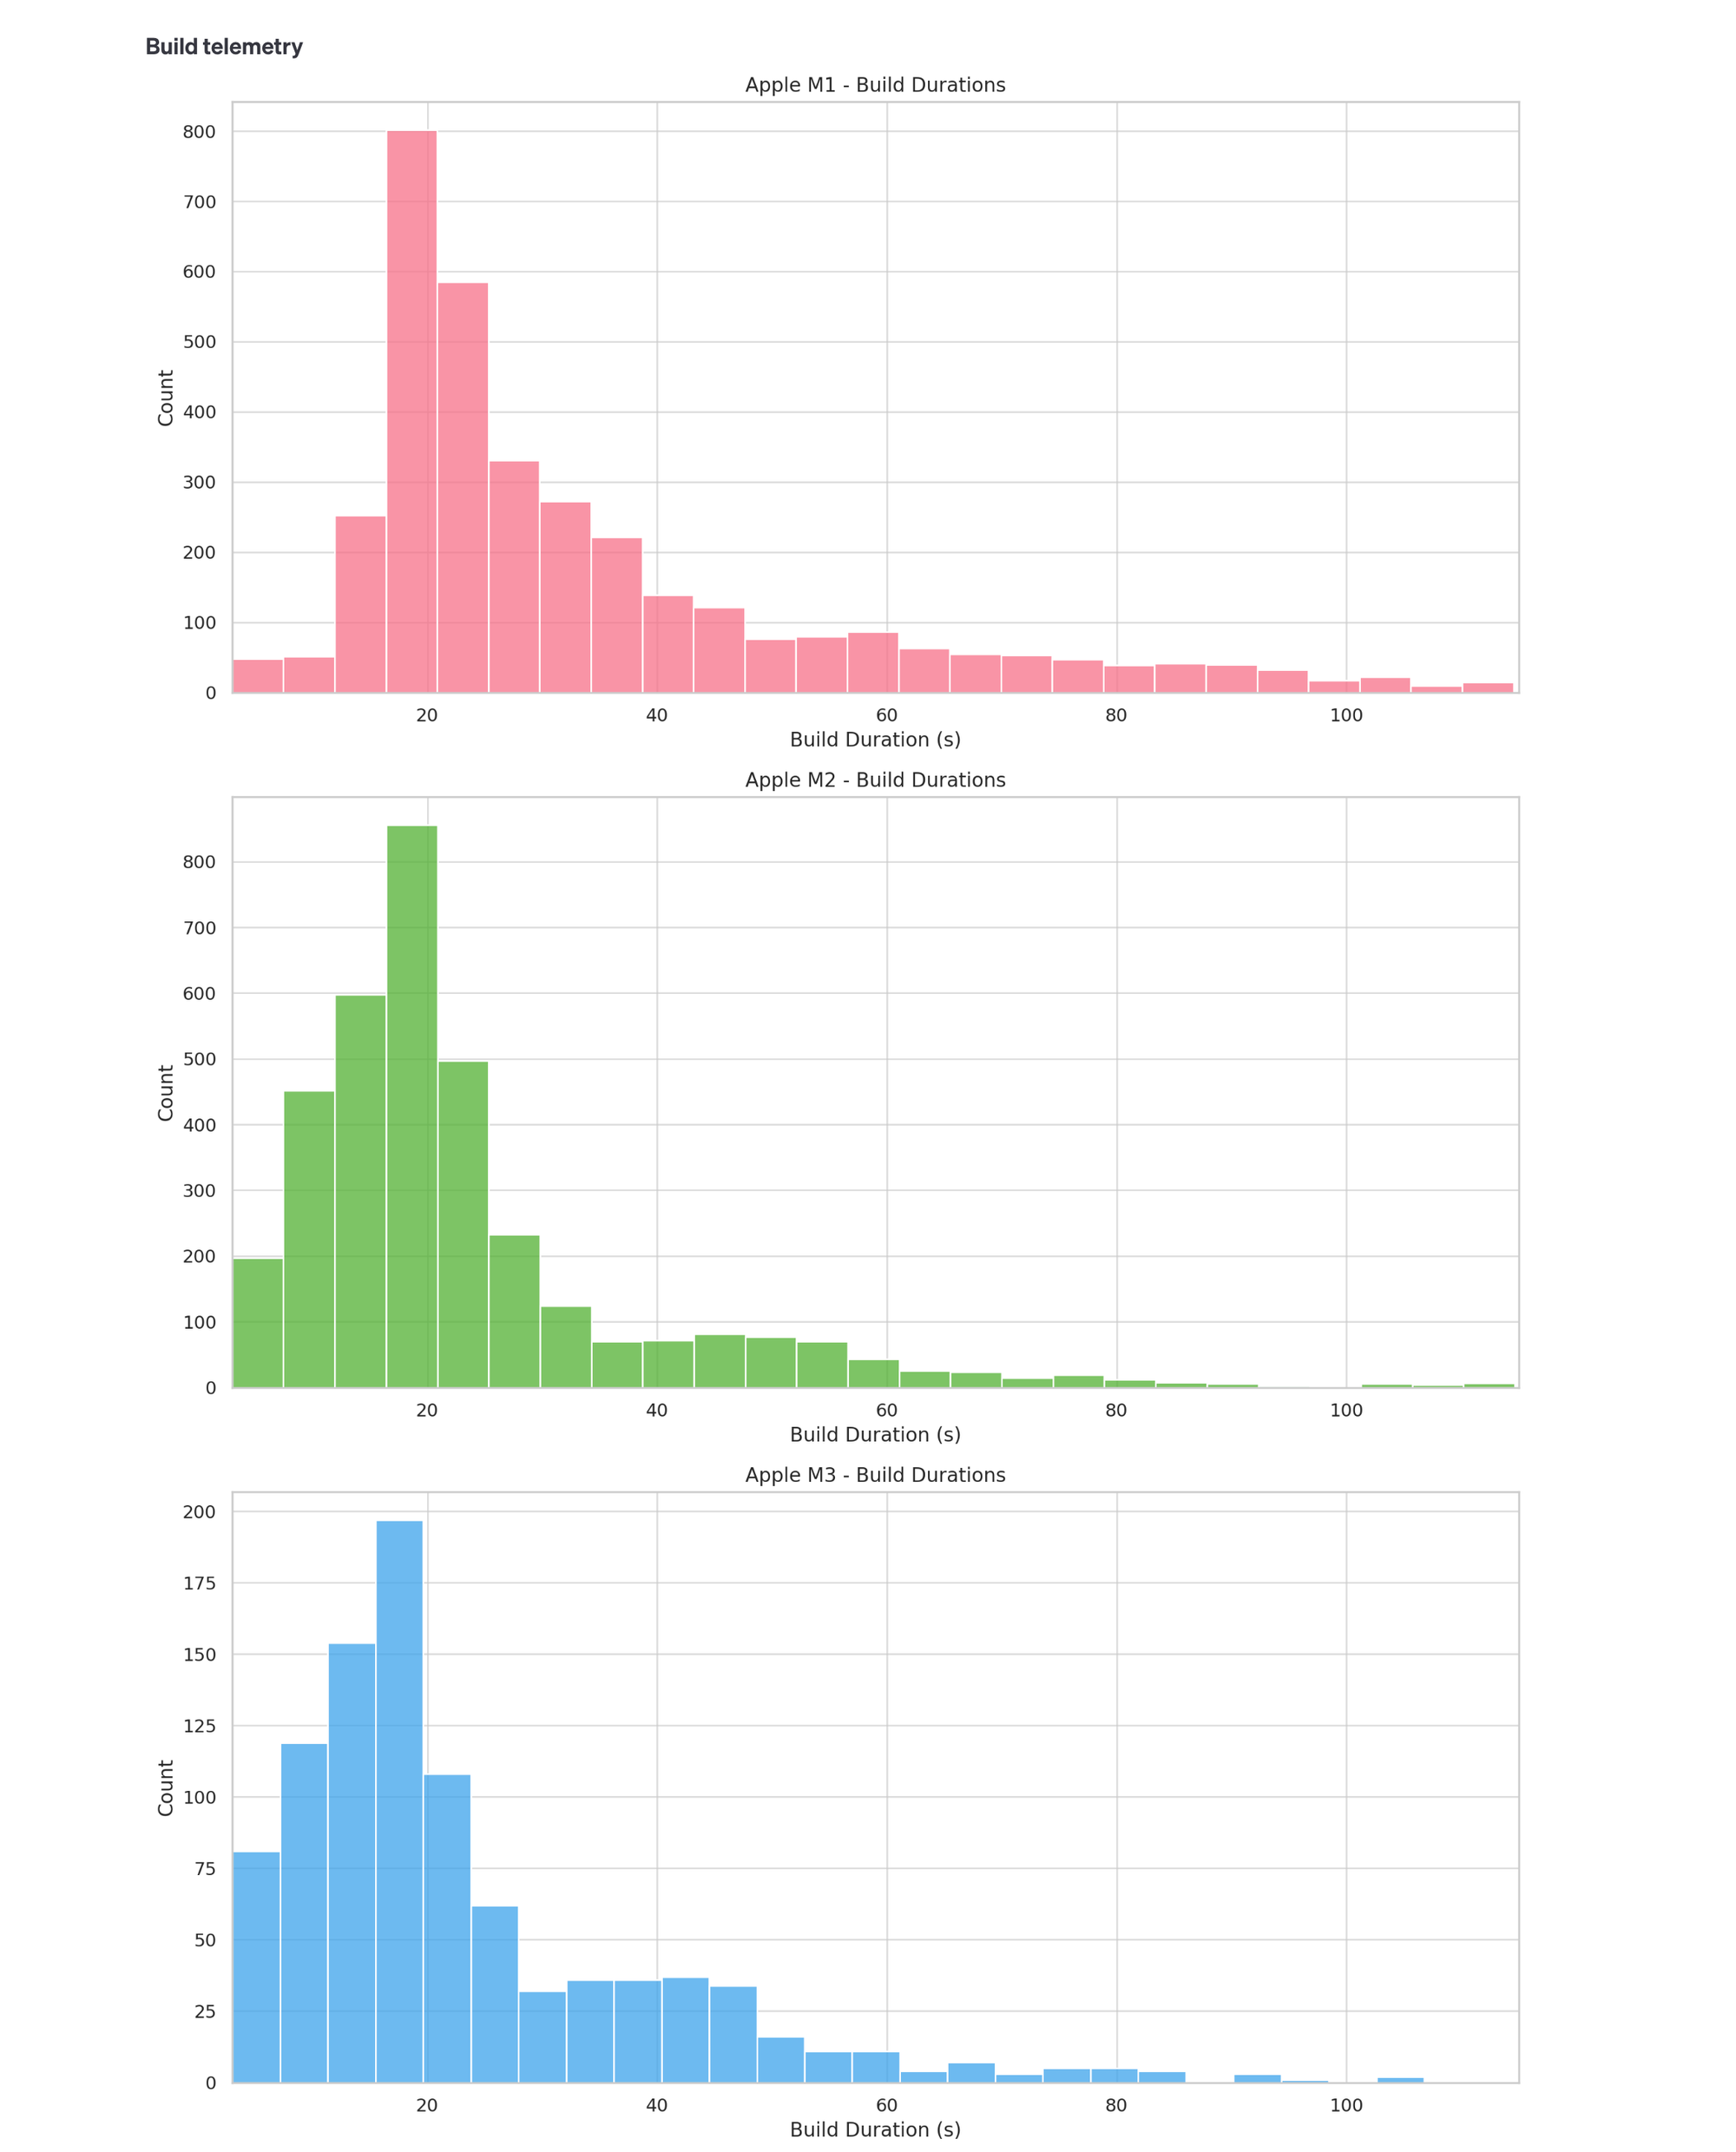
Which makes it clear that:
- People with the M1 laptops are frequently waiting almost 2m for their builds to complete.
- M2 is a significant upgrade on the M1 machines.
- M3 is an incremental improvement on M2.
Suggesting that:
- We should upgrade anyone on an M1 to a base M3 Pro model.
- M2 users don’t need upgrading.
Done!
One more thing… does memory really make no difference?
We’ve done the comparisons of machines with different memory and couldn’t see meaningful improvements from ~16GB → 32GB, at least not in the build durations we’re measuring.
But this was surprising. When guessing how this experiment might pan out, we really thought the extra memory would make a big difference. It feels weird we can’t see that in our graphs, or at least not very much.
After thinking a bit, we wondered if you could see the impact of more memory anywhere in what we measured, and that perhaps it was less consequential to builds overall than it might be to other things.
So what might we measure that could help determine this?
Well, if you remember our categorization of fast/medium/slow builds, a consistently large part of each build was time spent in the linker, where the compiled Go packages are joined together into one executable binary.
This process is (from memory of this doc) minimally concurrent, and spends a lot of time building structures in memory to perform symbol resolution and check each of the compiled modules are compatible with one another.
It’s very possible that additional memory could help here.
In our dataset is a build_stages column. Can we add a new column to the dataset which is called "linker_time" which is derived frombuild_stages.link.duration_seconds.
🤖 Thelinker_timecolumn has been successfully added to the dataset. The new column reflects the duration in seconds of the linker stage,link.duration_seconds, extracted from the JSON structure within thebuild_stagescolumn.
That’s nice: our telemetry events contain durations of linking/compiling, so we can tell our assistant to build a new column for linker_time into our build events.
Please graph histograms of linker_time for each platform and memory combination running in order specified previously, colouring each histogram differently depending on whether the machine has 16-18GB or 32-36GB of memory.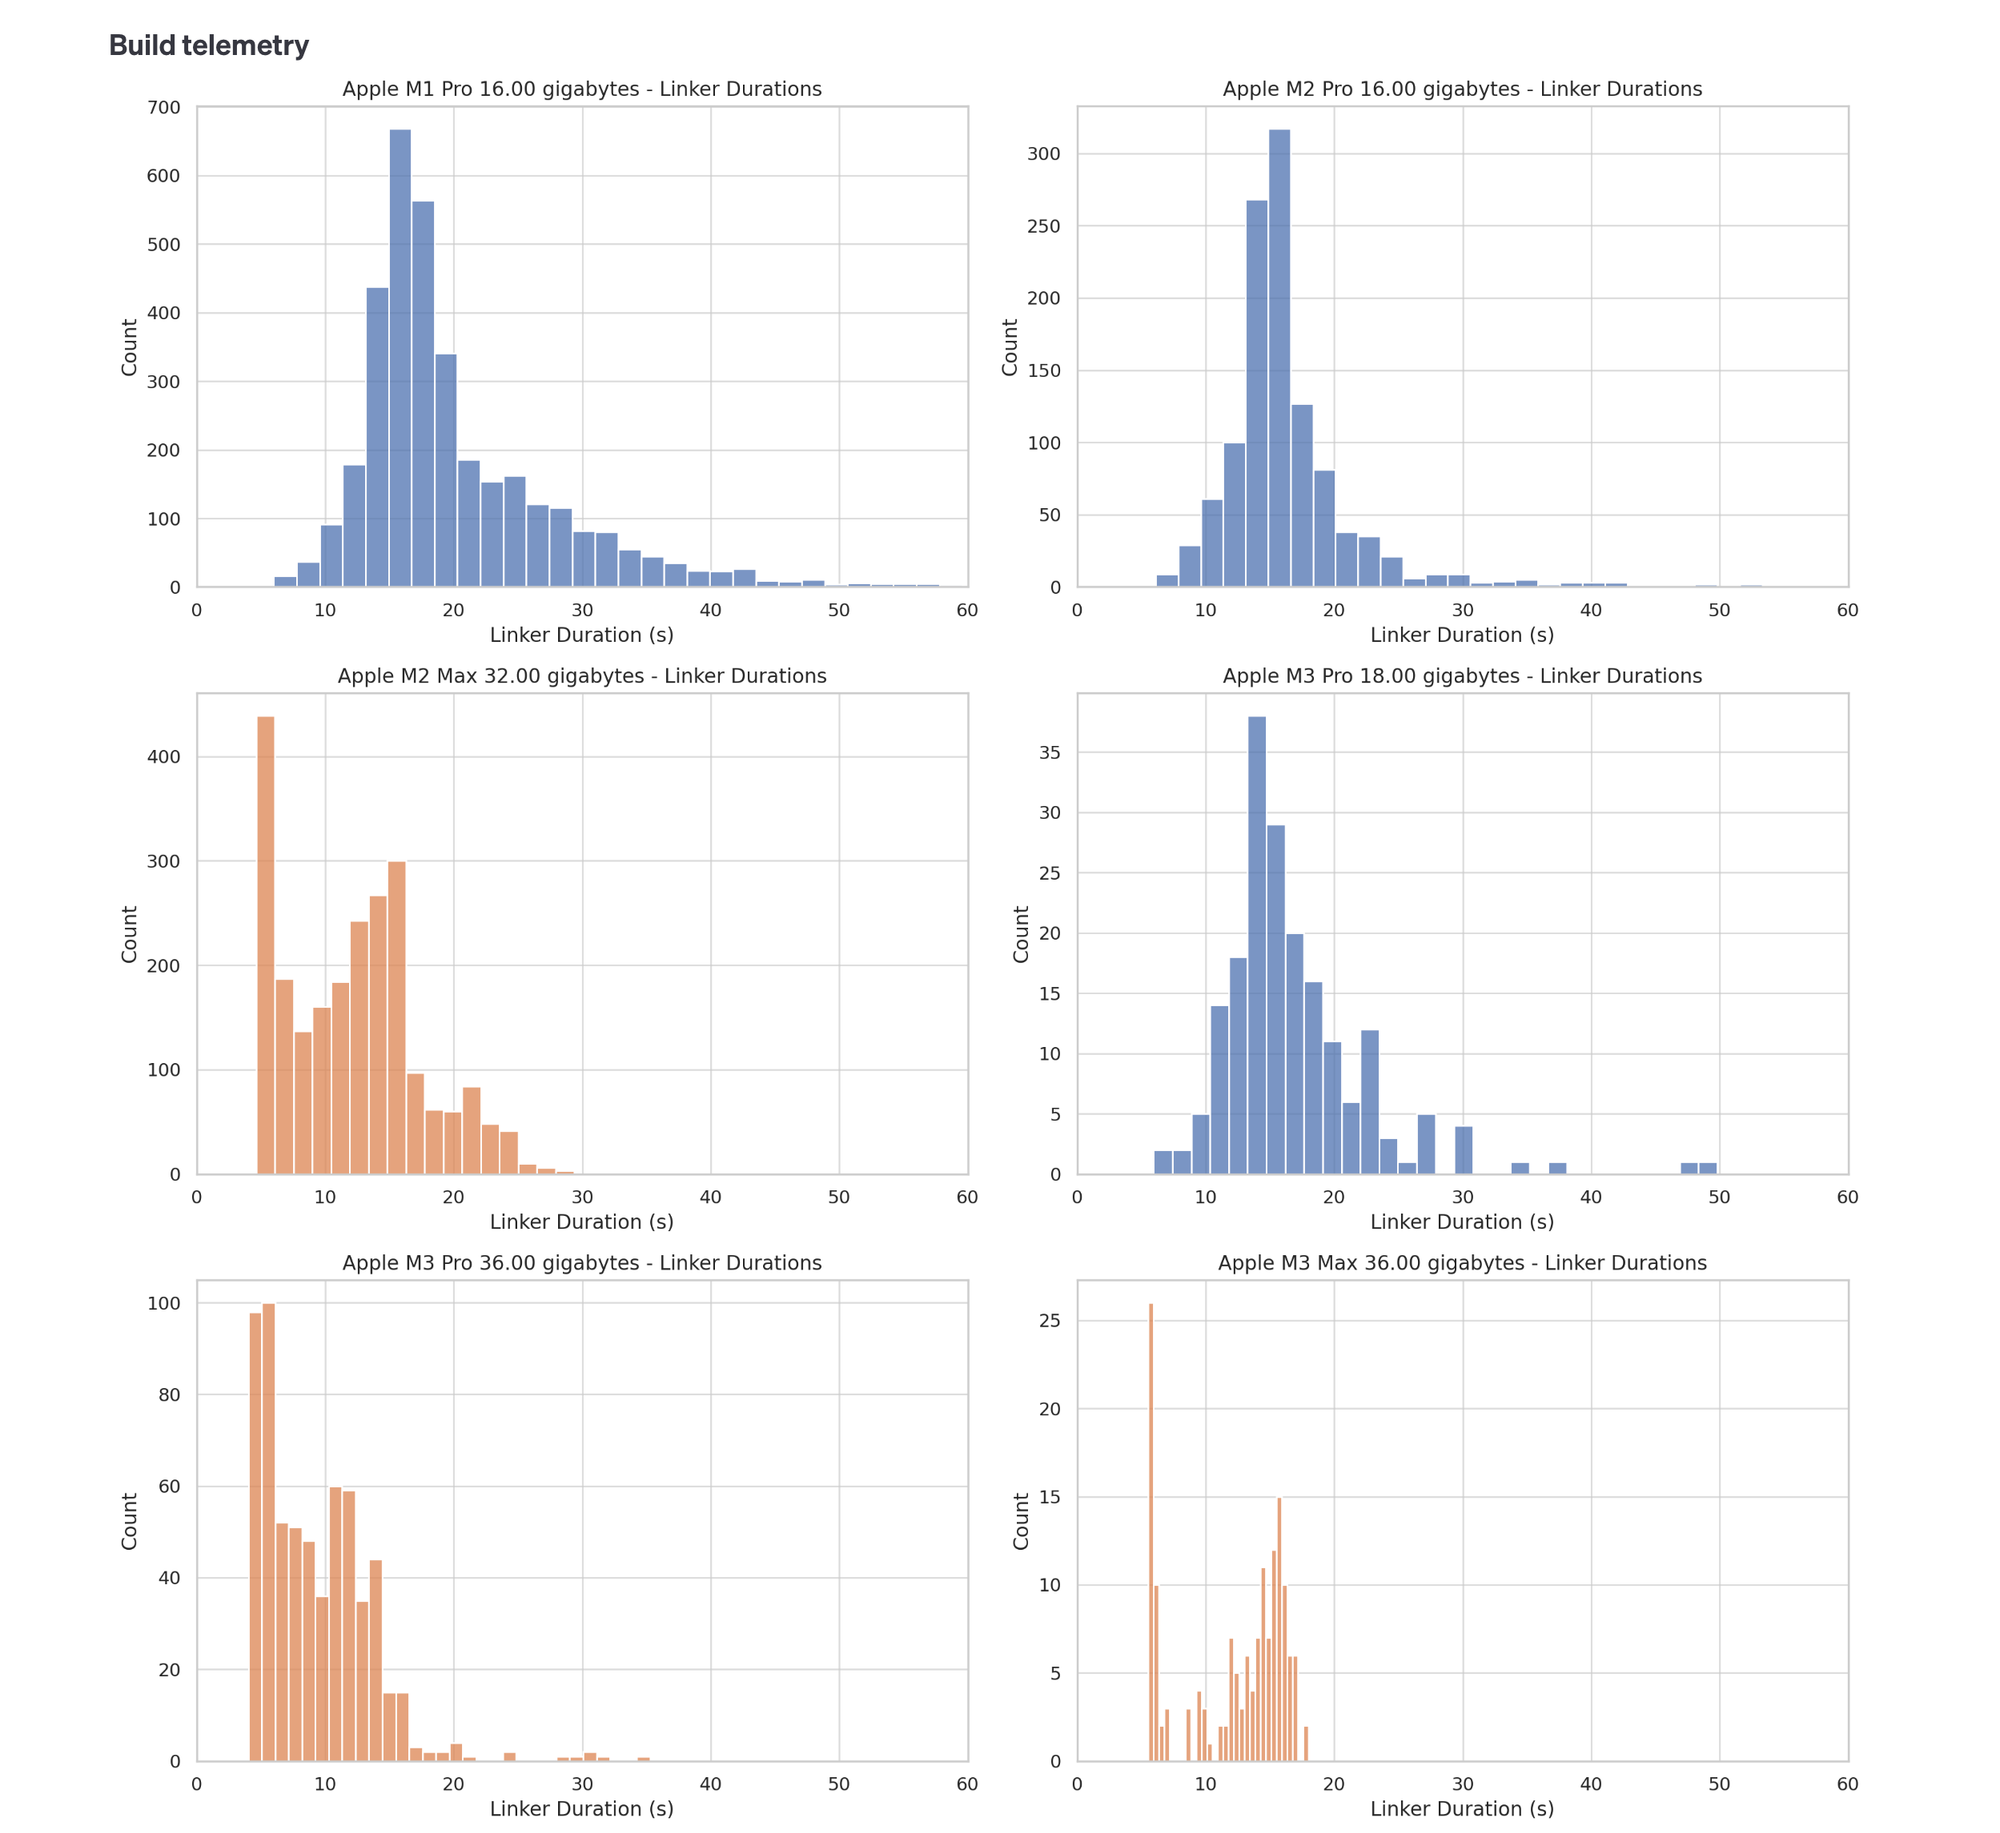
Well, that looks quite different! Which is to say every machine – M1, M2 or M3 – that has >30GB of memory almost always completes linking <20s, and only machines with 18GB or less memory routinely take >20s to link.
This is cool because:
- Extra memory does have its uses, and I’d have been sad if we couldn’t see at least some impact of that in our build data.
- We’re considering dropping docker from our development machines. These results suggest people with low memory machines can improve their link times by increasing available system memory, which they can do by going docker-less.
- We’ve began working on a mobile app where the simulators take a lot of system memory.
All this means for the nominal cost of the memory bump, it makes sense to buy the 36GB even if you consider it just ‘future proofing’.
Conclusion: the M3 Pros are on their way!
In the face of irrefutable evidence that new Space Black M3 Pro laptops would dramatically improve not only how cool we look on our commute, but also how fast we can ship changes and delight customers, the decision was an easy one and the new laptops are now on their way!
Specifically, we’ll upgrade our M1s to the base M3 Pro with 36GB of memory but wait a while for the M2s, as they seem to be performing really well already.
Besides the laptops, this was a really fun journey that helped us improve our tooling and get a much better understanding of our developer environment.
Along the way we:
- Found a great benchmark measurement for performance of developer machines.
- Built our own Go hot-reloader that can track the metrics (which came with other QoL improvements too).
- Learned a load about Go builds and what makes them fast or slow.
- Used OpenAI’s latest tech (Assistants) to examine the data, something you can easily use for similar analysis problems of your own.
- Dug into Apple’s chip line-up and quantified the improvements for your average Go developer upgrading between machines.
- Saw that memory matters, but perhaps not as obviously as you may expect.
I hope you enjoyed following along, and perhaps the conclusions we’ve drawn can be useful to you, too.

Lawrence Jones
Product Engineer
See related articles

Don't add a read replica until you've read this
Our learnings from implementing a product-wide read replica migrations, including some useful patterns for routing queries to replica and primary
 Johanna Larsson
July 21, 2026

We rebuilt our post-mortems from the ground up
Today we're launching our new post-mortems experience, and I want to walk you through what we've done and why.
 Pete Hamilton
March 17, 2026

Bloom filters: the niche trick behind a 16× faster API
This post is a deep dive into how we improved the P95 latency of an API endpoint from 5s to 0.3s using a niche little computer science trick called a bloom filter.
 Mike Fisher
November 14, 2025
So good, you’ll break things on purpose
Ready for modern incident management? Book a call with one of our experts today.
We’d love to talk to you about
- All-in-one incident management
- Our unmatched speed of deployment
- Why we’re loved by users and easily adopted
- How we work for the whole organization


