Observability as a superpower
November 4, 2024 — 10 min read

With every job I have, I come across a new observability tool that I can’t live without. It’s also something that’s a superpower for us at incident.io: we often detect bugs faster than our customers can report them to us.
A couple of jobs ago, that was Prometheus. In my previous job, it was the fact that we retained all of our logs for 30 days, and had them available to search using the Elastic stack (back then, the ELK stack: Elasticsearch, Logstash, and Kibana).
At incident.io, I discovered the power of traces, and using those to debug what was happening with our systems — observability is one of the most powerful tools in the detection stage of the incident response lifecycle. In this post, I want to share the joy of browsing and querying traces and spans, and talk through how we go about constructing them in our codebase.
Martha also wrote a fantastic post about our observability strategy, which goes into detail about how we tackle observability at incident.io.
What’s a trace?
A trace represents the route that a request took through your application. Don’t think about this as just being an HTTP call to an API: it can be any unit of work, such as a scheduled job, or consuming an event.
The trace is made up of spans — with each span representing a unit of work. There’s a single “root” span, and then each other span has a parent. Although this varies between implementations, spans generally have an ID, a name, some attributes, and a start and end time. Most importantly, child spans link back to their parent span’s ID.
We use OpenTelemetry, and so this post focuses on that — but the techniques should be generally applicable to whatever tracing format or library you use.
Why is a trace useful?
Let’s use an HTTP request to our /incidents/:id API as an example. The request comes in, and then we do something with it. We perform some authentication and authorization, and then go and look up that ID in our database.
Each of these units of work ends up with a span. Because the spans have parents and durations, you can render them as a tree — which ends up looking something like this:

Don’t worry, this is just an example — fetching a single incident by ID from Postgres is much faster than that.
Let’s look at what I like about this:
- I can see what happened, in what order, and how long it took.
- I can immediately see which parts were slow.
- You can easily spot inefficiency, in the form of things like N+1 queries, or duplicate calls for the same data in different parts of the codebase.
Digging into spans
Names are one of the most important parts here, as most tools will display those in the overview of the entire trace. Try to stick to a convention so that the naming feels familiar to people: for example, database queries always have the table name in them, and spans for other calls get a package.FunctionName format.
Span metadata is incredibly useful, too. Let’s see a few examples:
- Our “HTTP” span always gets a request path and a response code: I can also see if it was successful or not. We include the referrer too, so I’ve got an idea of which part of our app the request came from.
- All of our database queries have attributes for the table that was queried the number of rows affected. This makes it easy to see
SELECTs that returned a large amount of data, orUPDATEs that didn’t affect anything. We also include a fingerprint of the query. In local development, we include the SQL query. - All of our HTTP clients have spans for each outbound request. Each span has an attribute with the request path and the response we got back. We can set the status of a span to failed, too — and these spans show up differently in the UI when we get an error back.
What does it look like in code?
As you can see, our codebase gives us a lot of spans “out of the box” for free — and that’s really nice. However, what if we want to add some spans from within our application code?
As an example, we know we only have three seconds to respond to a Slack interaction, so it’s important that this code is speedy. It’s also important that we’re able to debug anything that’s slow here.
Let’s imagine a function that handles Slack interactions:
func (svc *Service) HandleInteraction(ctx context.Context, cb slack.InteractionCallback) error {
	ctx, span := md.StartSpan(ctx, md.SpanName(), md.Metadata{
		"callback_type": cb.Type,
	})
	defer span.End()

	if _, err := svc.handleInteraction(ctx, cb); err != nil {
		md.SpanRecordError(span, err)
		return err
	}

	return nil
}
Here, you can see our internal md (metadata) library, which we use for both tracing and logging. It’s doing a few things here:
- Starting a span, using
StartSpan, and passing an attribute with the callback type. - Using
md.SpanName()which names the span based on the calling package and function. - Calling
defer span.End()to make sure the span is ended regardless. - Recording an error if one occurs, using
SpanRecordError.
A step further
If you want to go one level deeper, you can use defer in conjunction with named return parameters (which yes, also have pitfalls) to do something like this:
func HandleAlert(ctx context.Context, alert *domain.Alert) (err error) {
	ctx, span := md.StartSpan(ctx, md.SpanName(), md.Metadata{
		"alert": alert.ID,
	})

	defer func() {
		if err != nil {
			md.SpanRecordError(span, err)
		}
		span.End()
	}()

	// ...the rest of the function
}
The advantage here is that you then don’t need to worry about calling SpanRecordError in the rest of your function whenever an error happens. You can use the same pattern for setting other attributes — and we also use this pattern for recording values in Prometheus histograms.
How can tooling help?
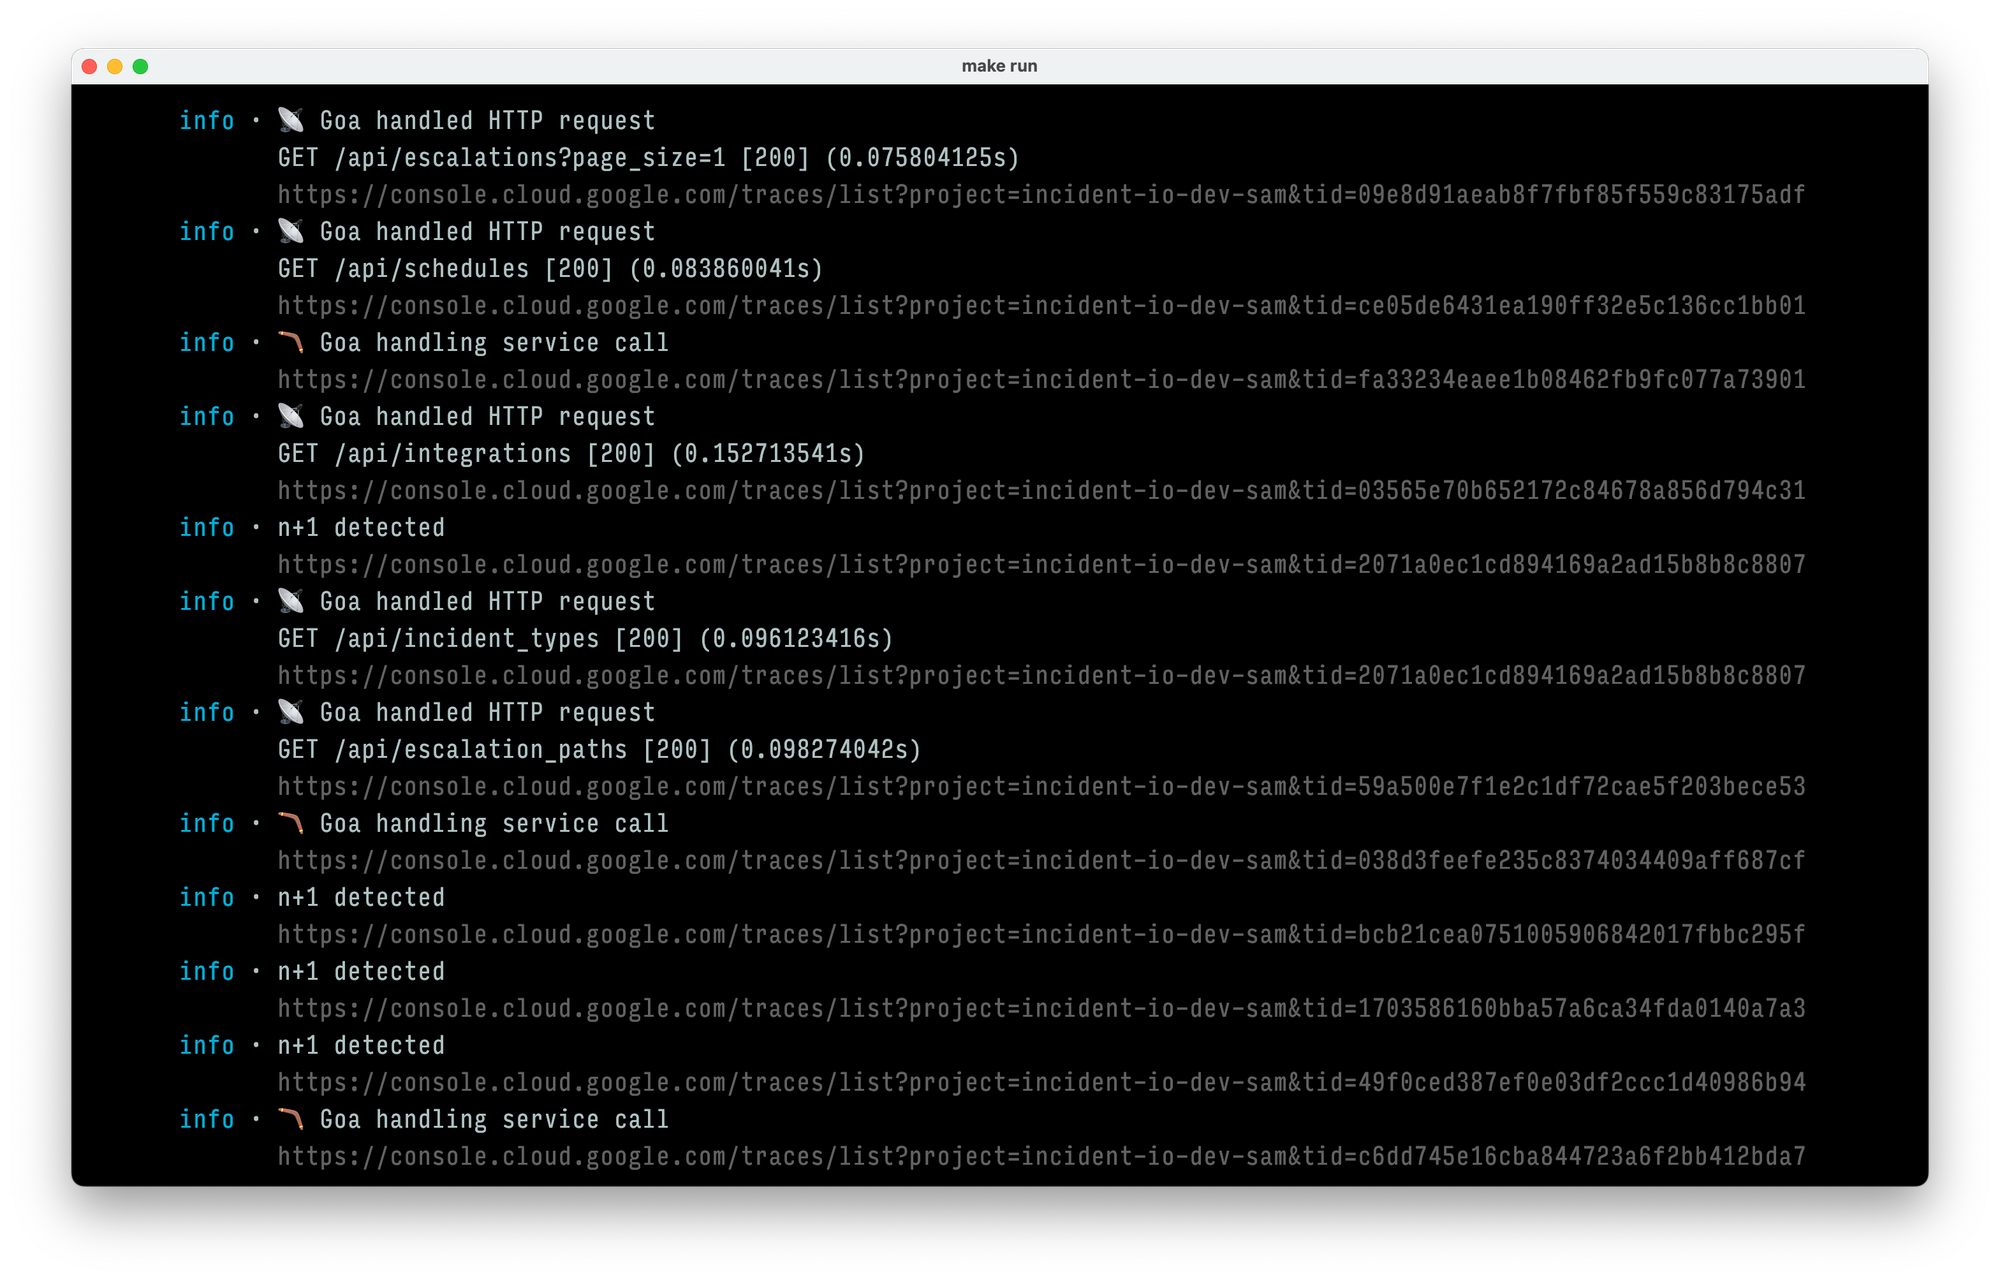
Now that we’ve got an idea of how spans can help, let’s talk about where they end up. We each have a Google Cloud Platform project for local development, and traces end up in Cloud Trace. This is really useful for local development — particularly when our local logging shows the trace URLs next to log lines:
In production our traces end up in Grafana too, using Tempo. Both Grafana and Google Trace give us the ability to query spans and traces — but we find that Grafana’s TraceQL is much more flexible and expressive.
We tag a lot of our spans with the ID of the user or organization making the request, allowing me to:
- Find all the traces where we queried the incidents table for a given organization.
- Show the trace where we handled an alert for a given alert ID.
- List all the traces for the “list incidents” API endpoint where it took us more than two seconds to generate a response.
Having them in a web interface means that I can also share them with other engineers in incident channels, as part of our response process: almost every incident contains a "Hey, this trace looks sus" in some form — a small but critical moment of incident communication that points the whole team in the right direction.
Once an engineer at incident.io has found the trace for something, they're usually never far away from knowing exactly what happened, which puts them in a far better place for a rapid fix — one reason why automated incident response keeps getting faster.
How is it a superpower?
Hopefully you can see how tracing can show us exactly how our system is behaving, with a great level of detail. We’ve married this up with our logging and error reporting too — so every log has a trace_url attribute, and everything that ends up in Sentry (which we use for error handling) has one too.
This means the flow is often: get paged, open the Sentry in the incident channel, click through to the trace, see exactly what happened — a seamless fit for teams already running incidents from Slack, where trace URLs can be shared directly in the incident channel.
Top tips
If you’re thinking about introducing (or improving) your tracing, I’ve got some tips:
- Do what you can to have spans included “for free”. For us, making your database client and HTTP clients start spans gives you a lot of useful information out of the box.
- Store those traces somewhere that can be queried, and make sure everyone on your on-call schedule knows how to run the basic queries when they're paged.
- Make the traces really accessible: add them to your log metadata, your errors, your HTTP headers (each of our requests returns a trace ID). Thread them through in any place they might be useful.
- Have your local setup match production as much as possible. Having tracing available locally really helps everyone build up their tracing muscles: when they’re using it daily, they’ll build up more of a “Hey, a span here would be useful” attitude by default.
Of course, there are some anti-tips too: you should make sure you understand the cost implications of storing larger numbers of traces, as well the impact of numbers of spans (and attributes) on that cost. Attribute names and values often come with limits, too.
How do you use tracing?
Tracing is a flexible tool — so this is just how we use it. We’re a monolith, but tracing is also incredibly useful in distributed architectures. How are you doing things? What are we missing? We’d love to hear from you.

Sam Starling
Product Engineer
See related articles

Don't add a read replica until you've read this
Our learnings from implementing a product-wide read replica migrations, including some useful patterns for routing queries to replica and primary
 Johanna Larsson
July 21, 2026

We rebuilt our post-mortems from the ground up
Today we're launching our new post-mortems experience, and I want to walk you through what we've done and why.
 Pete Hamilton
March 17, 2026

Bloom filters: the niche trick behind a 16× faster API
This post is a deep dive into how we improved the P95 latency of an API endpoint from 5s to 0.3s using a niche little computer science trick called a bloom filter.
 Mike Fisher
November 14, 2025
So good, you’ll break things on purpose
Ready for modern incident management? Book a call with one of our experts today.
We’d love to talk to you about
- All-in-one incident management
- Our unmatched speed of deployment
- Why we’re loved by users and easily adopted
- How we work for the whole organization


