A modern data stack for startups
January 25, 2022 — 20 min read

Nowadays, easy access to data is table-stakes for high-performing companies.
Easy access doesn't come for free, though; it requires investment and a careful selection of tools. For young companies like us, the question is, how much? And at what time do you make that investment?
Having grown to a company of ten people—several without engineering backgrounds but with strong data needs—we decided 2022 was going to be that time.
Two weeks of experimentation and a couple of company workshops later, we're super happy with what we've built. If you're a company with similar needs who cares about data access for all, follow this guide and we guarantee you'll get a great result.
Architecture overview
With data warehouse solutions (BigQuery, Snowflake, Redshift) going mainstream, modern data stacks are becoming increasingly boring—which is great news if you're starting from scratch!
In general, you'll want to:
- Extract data from various tools (your CRM, accounting platform, etc) into a data warehouse.
- Perform data cleaning and transformation on the source datasets.
- Find a visualization tool that can use the warehouse for exploration and insight.
Finding complementary tools is difficult, and we spoke to data engineers from several companies to find what was working for them (and what wasn't). We arrived at the following stack:
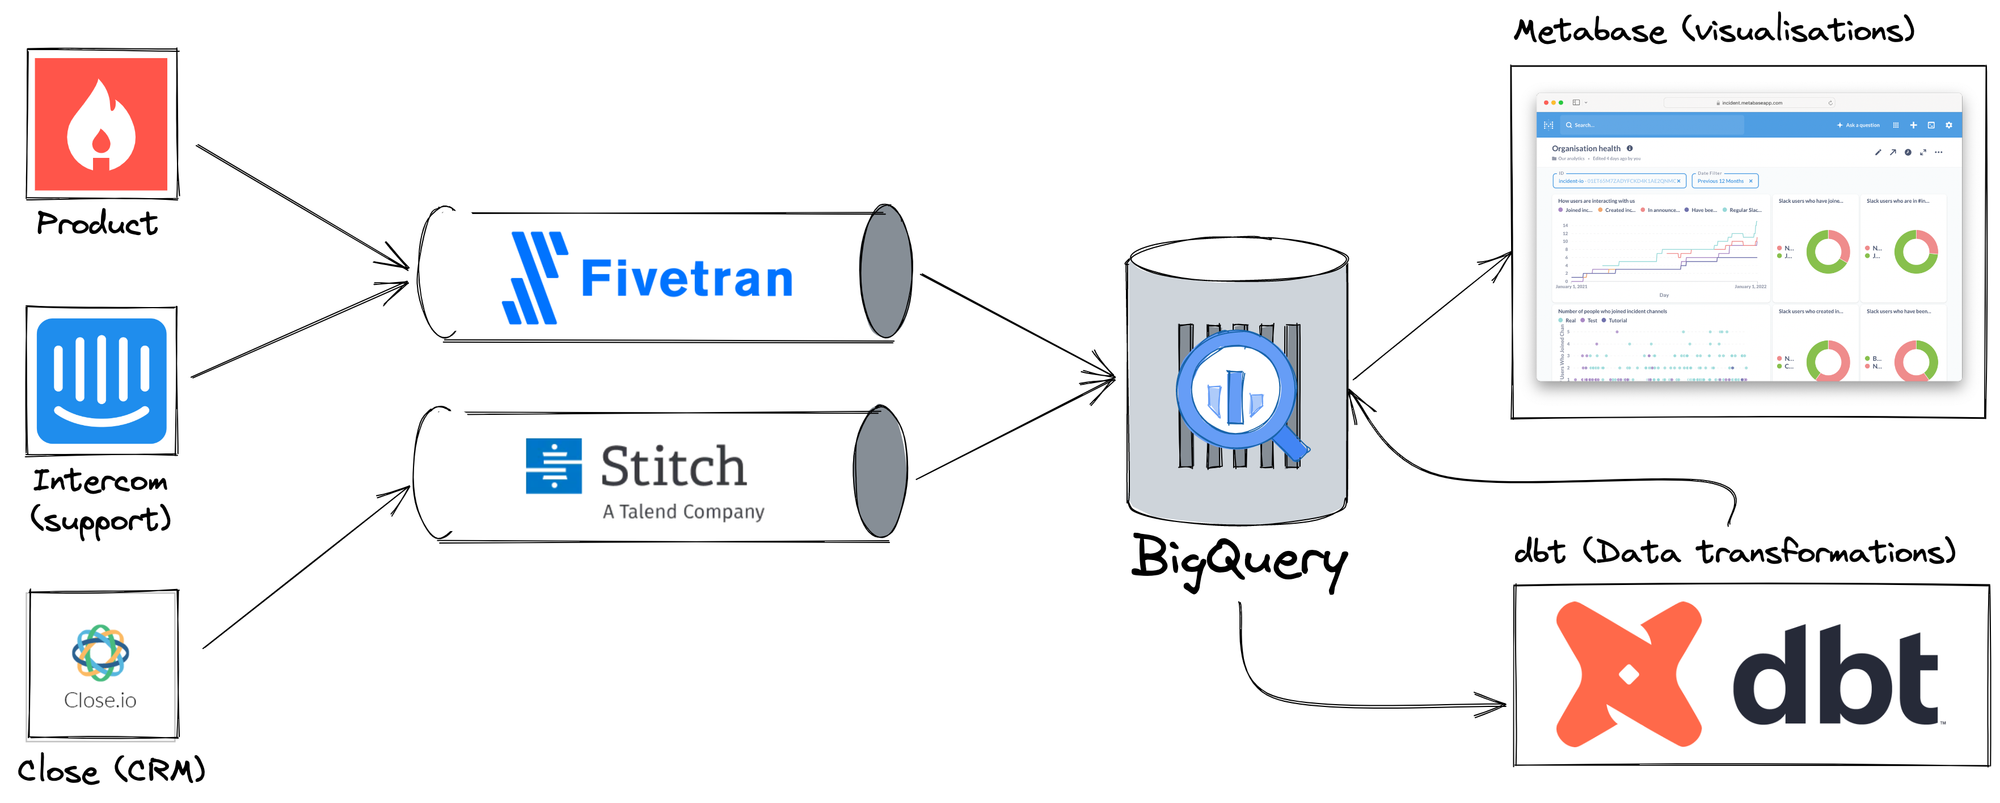
On the left, you'll see data sources (only a sample, we have many more than this) and tools where we generate and work with data. One of them is Product, the Postgres database that powers incident.io, while Intercom and Close are SaaS we use to run our business.
Fivetran and Stitch are both ETL tools designed to transport data from various sources into destinations. We use both to load data into BigQuery, our data warehouse.
Once in BigQuery, we clean and transform the data using a tool called dbt. This allows us to turn raw source data into an ideal 'data warehouse native' format that can be easily used for analysis.
Finally, Metabase provides a visualization and analytics layer, running queries against BigQuery.
That's it, the entire data stack. We think these tools are all we'll need to grow incident.io into a much larger company, and given one of our goals (always, for everything!) is simplicity, we're happy the list is so small.
Let's take a more detailed look at how this works.
Extraction: Fivetran and Stitch
Modern companies produce a huge amount of data across an increasing number of tools.
While each tool provides a custom view of its data, I'm a strong believer that combining datasets unlocks more value than the sum of their parts. We do this by consolidating our data into a single warehouse, which means we can query across all our tools and build insights that combine data in interesting ways.
It used to be that companies would write their own hack-y scripts to perform this extraction - I've had terrible incidents caused by ETL database triggers in the past, and even built a few generic ETL tools myself.
From experience then, believe me when I say you don't want to build these. Thankfully, ETL products like Fivetran and Stitch run and maintain these extraction processes for you.
In both Fivetran and Stitch, the process is the same:
- Pick a connector to access the source data (your Postgres database, or CRM)
- Configure it with authentication and choose which data to sync
- Have the data pushed into the warehouse, usually under a dataset specific to the source
Here's a view of the connectors we have configured in Fivetran:
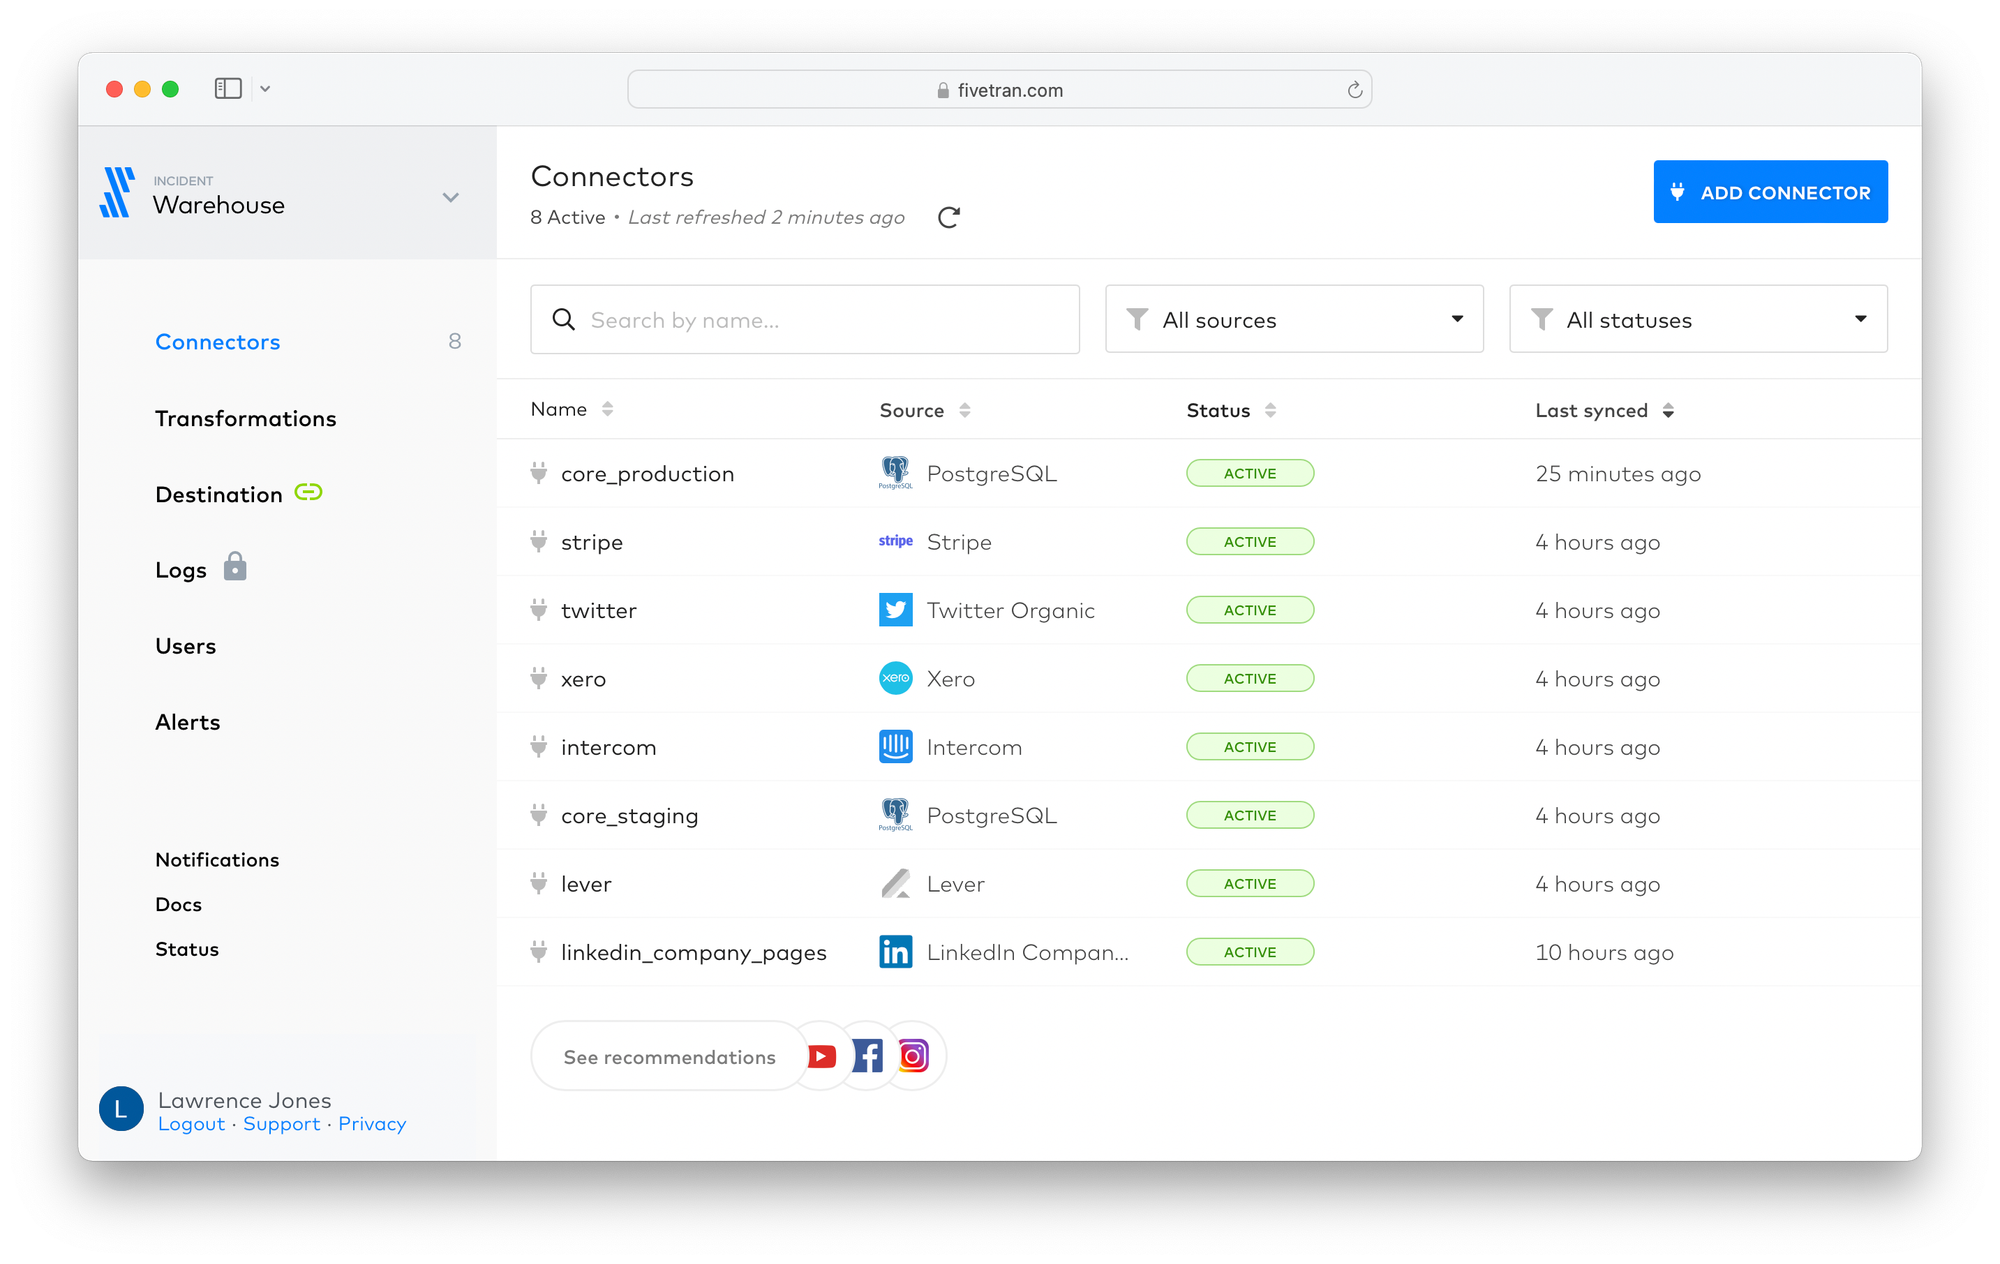
It's worth noting the variety of sources. If you're building a SaaS product, one of the most crucial data sources will be whatever database powers your product. incident.io has a monolithic application powered by Postgres, in which we store tables like:
organizations, a row for each organization using the productusers, each user for an organizationincidents, every incident managed in the product
This data literally is our product, and your equivalent is likely the most high-value data asset to push into your warehouse.
Your database will limit how you can replicate that data, but Fivetran provides connectors that cover most circumstances: as an example, our Heroku Postgres lacks logical replication support, so Fivetran falls back to periodically scanning tables and using xmin as a cursor, instead of reading WAL.
Fivetran will automatically manage the warehouse schema on your behalf, creating tables within the destination dataset for each table in the source. As an example, here's a view of the BigQuery datasets from our production database:
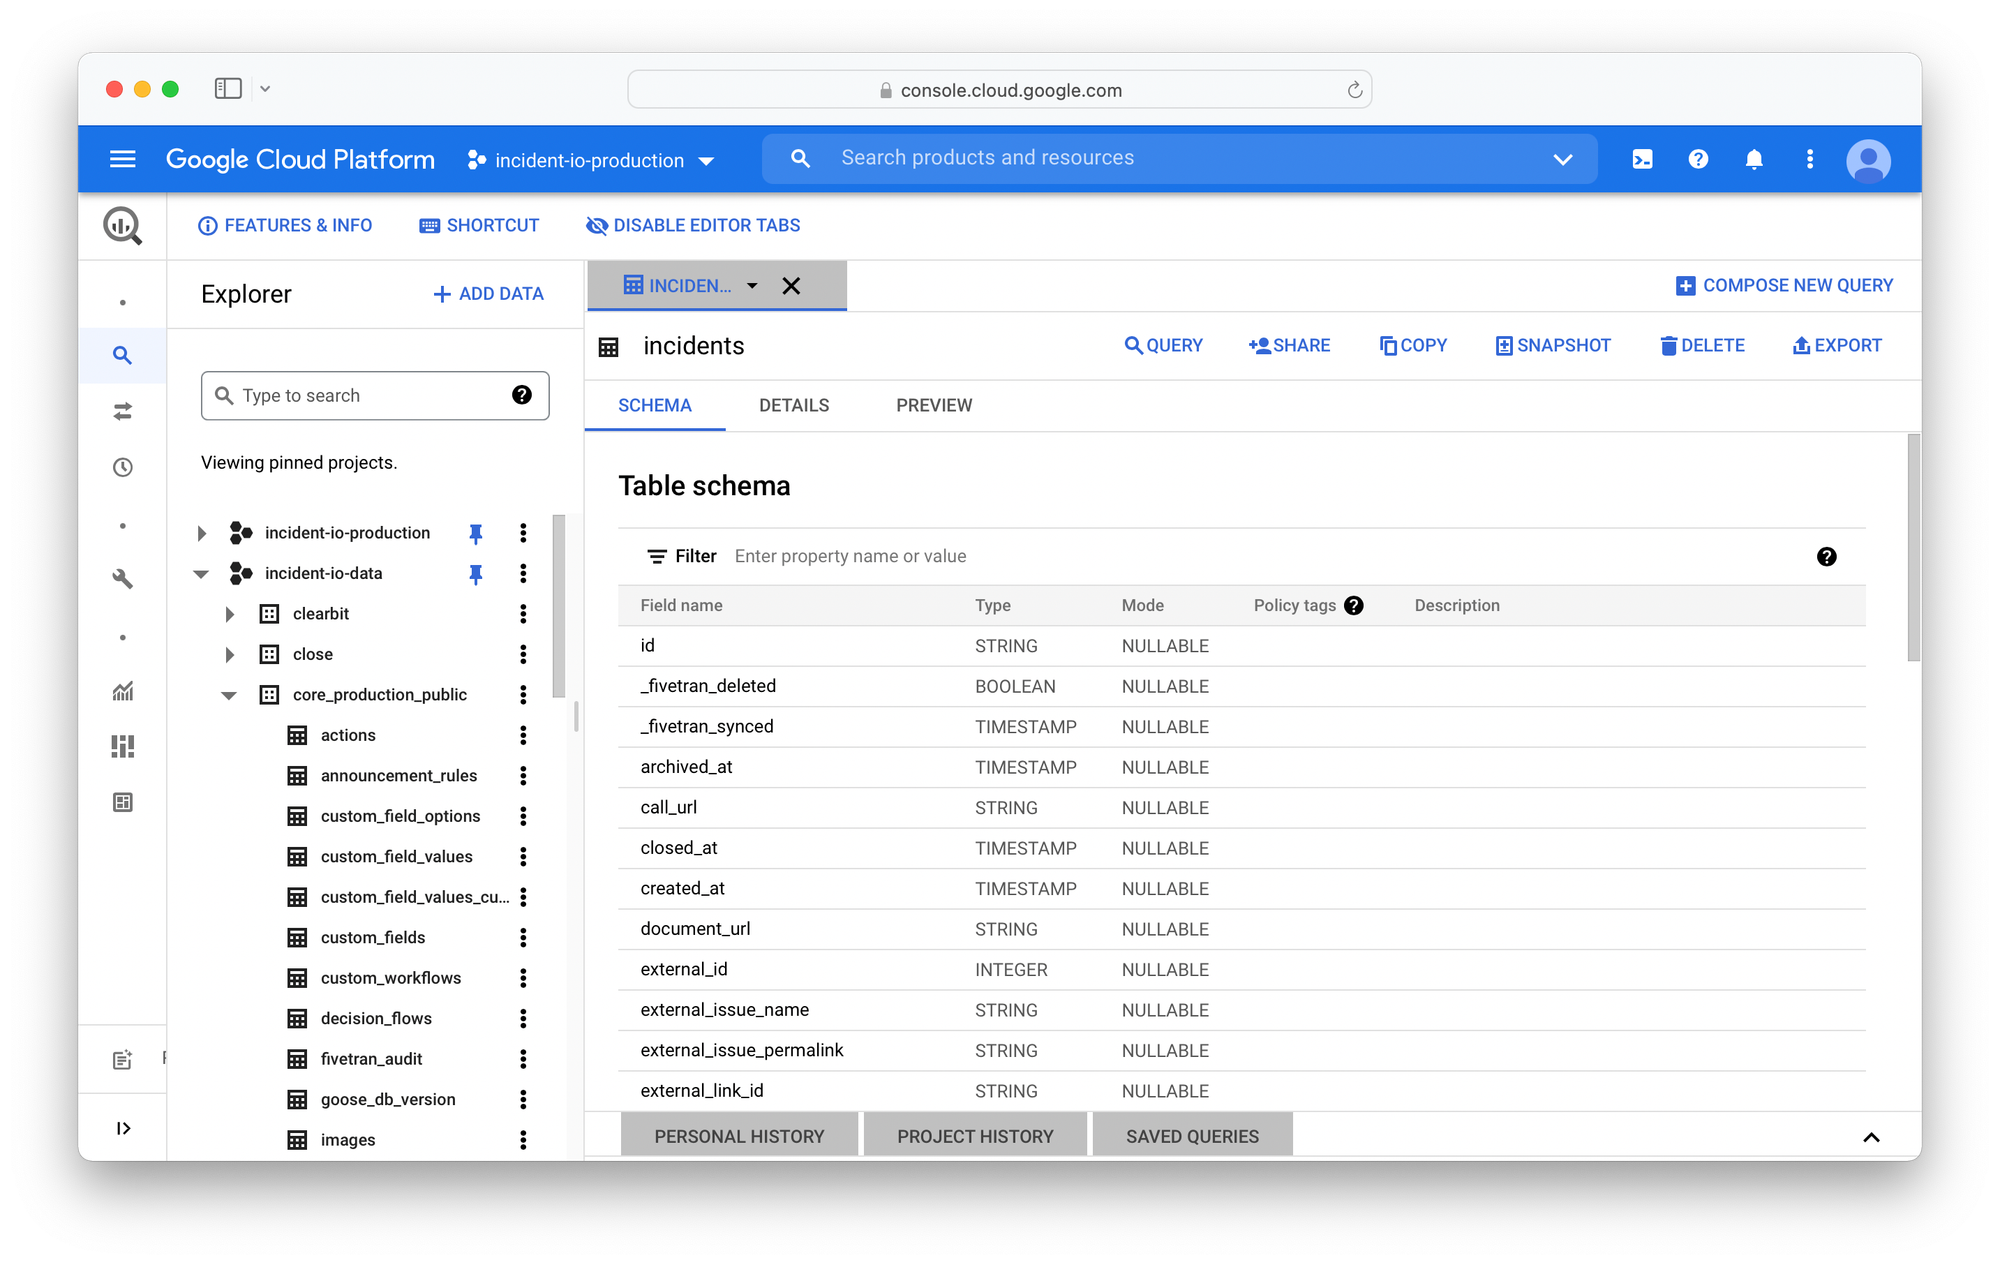
Other data sources like your CRM will be powered by API access to that tool. For those connectors, Fivetran will paginate through API resources using a cursor that is set each run, taking those responses and pushing them into the destination.
Expect this data to be of low quality, or awkward to use without some additional effort. Translating API resources to a data warehouse format needs some human effort, and that's where our transformation step comes in.
Why two tools?
Until now, you were probably wondering why we have two ETL tools. Fivetran looks great, can't we just use that?
The answer is we'd like to, as Fivetran has been exceptional where we've been able to use it, and the pricing is amazing - I think our bill is about $100/month for all these connectors, which is a bargain for the value we get from it.
We're limited by connector availability, though. Stitch is a similar product to Fivetran but is built on the open-source Singer project, a huge collection of data taps (sources) and targets (destinations).
With Singer as the underlying technology, Stitch has a more comprehensive offering of connectors than Fivetran. Of the two tools, only Stitch has support for Close (our CRM) which meant we're forced to run both products, if only for a single connector.
Inconvenience aside, I don't think this is a bad strategy. The goal of ETL tools is to get your data into the warehouse and provided that happens reliably, it shouldn't matter too much how it got there.
For that reason, our policy is “prefer Fivetran, but Stitch otherwise”. It works for us!
Transformation: dbt
Now we have our data in the warehouse, we need to transform it into an appropriate form for querying and analysis. That means turning raw source data into recognizable business concepts, along with tidying artifacts of the ETL process (removing deleted rows, etc).
There is an obviously correct choice for tooling at this stage, which is dbt. Having built a huge community of avid data engineers, dbt is the solution for working with data warehouses and should be consistent with the rest of the industry.
While the tool choice is obvious, how to use dbt is going to be more controversial. There's a load of great resources on dbt best practices, but as you can see from my Slack questions, there's enough ambiguity to tie you up.
We've arrived at a structure that minimizes the number of dbt models (and their schema files, which is the real maintenance burden) and categorizes tables by quality and intended usage.
What follows is taken from our “Intro to Data” tutorial:
What data should I use?
Not all data is created equal, and it's useful to understand the different types of models you can query from Metabase, so you can make the best use of it.
Firstly, the data we expect people to be querying is what we produce from dbt. All tables produced by dbt are located in the All (dbt) dataset in Metabase.
This dataset contains many tables, and each table will be either:
- Dim ⇒ dimension table
- Fct ⇒ fact table
- Stg ⇒ staging table
In general, prefer to use (in this order):
Dimension (dim) and fact (fct) tables
Normally described as 'marts', these tables represent key business data and have been engineered for ease of use when querying.
An example of a dimension table is dim_organizations. In general, dimension tables have a single row per entity they describe (i.e., an organization) and have a large number of columns that can be used to filter and group those entities.
Our dim_organizations table has columns like:
idandname, identifying the organizationin_setup_flow, whether they have completed the setupis_paying, if there is an active Stripe subscriptionlead_id, the ID of the Lead in Close (CRM)
Note that most of the hard work to enrich an organization with data from other sources (such as Close) has already happened, making it easy to filter on any of the available dimensions without complex joins.
Fact tables are complementary to dimension tables, and can be seen as a list of things that happened (also referred to as an 'event stream'). Where dimension tables have one row per entity, you'll find many rows (events) for each of those entities in a fact table, and you'll be expected to join against the relevant dimension table to perform filtering.
As an example, we have an fct_organization_statistics table. This contains a row for each day an organization has existed, along with several measurements like total Slack users, number of incidents, count of users who have created incidents, etc.
These are the highest-quality data tables we offer, and you should prefer to use them when they exist.
Staging (stg) tables
Source data, which is what Fivetran and Stitch generate, is unstable and often awkward to use.
As an example, the source Close data has no concept of opportunities, as those exist within the lead data model and aren't modeled as first-class objects.
Instead of having people query the awkward source tables, we choose to build staging tables from the source data which:
- Renames columns to be consistent (all true/false columns start with
is_orhas_) - Casts columns to the right type (timestamp strings are parsed as timestamps)
- Extracts deeply nested data into a suitable form (custom fields become columns)
And whatever else is needed to turn the source data into the 'ideal' data for querying.
Going back to our Close example, we have the following tables:
stg_close__leadswhich cleans the source lead data and makes custom fields easy to consumestg_close__opportunitieswhich is built entirely from the nested opportunity data in the leads source, presented as you would want to query it
Fallback to staging data when there isn't a dimension or fact table that can better serve your use case.
Working with dbt
Those last few sections are from our data tutorial, and is how we teach choosing the right data tables.
It's normal that this mirrors how we structure our dbt repository:
dbt/models
├── marts
│  └── core
│      ├── core.yml
│      ├── dim_incidents.sql
│      ├── dim_organisations.sql
│      ├── dim_users.sql
│      ├── fct_organisation_statistics.sql
│      └── fct_user_incident_graph.sql
└── staging
    ├── close
    │  ├── README.md
    │  ├── src_close.yml
    │  ├── stg_close.yml
    │  ├── stg_close__activities.sql
    │  ├── stg_close__leads.sql
    │  └── stg_close__opportunities.sql
    └── product
        ├── README.md
        ├── src_product.yml
        ├── stg_product.yml
        ├── stg_product__actions.sql
        ├── stg_product__announcement_rules.sql
        ├── ...
        └── stg_product__workflows.sql
While I was speed-running dbt tutorials, I would have loved to see this structure, to lend some confidence we were headed in the right direction.
With that caveat that I'm only an amateur dbt'ist, it's worth noting some decisions that went into this structure:
- You'll see mentions of "base" tables in dbt literature, described as the first transformation after source and appearing before staging. We've opted not to create these, and to go straight for staging tables - this avoids maintaining another layer of dbt schemas, and lots of our data (especially Product) is close to staging format at source anyway.
- We don't produce marts from staging models unless we join them across schemas (as with the dimension tables) or perform complex transformations on them (fact tables). Again, this is to reduce the number of dbt schemas.
- We only have core marts right now. Until we add more marts, it makes little sense implementing a more complex structure (such as grouping marts under business units), better to adapt as we grow.
In terms of developing against dbt, each engineer has a separate BigQuery dataset (ie. dbt_lawrence) that they target in local development for testing. Running a full build (dbt build) is quick right now, making local development enjoyable.
While this setup makes trade-offs appropriate for incident.io's context, I think anyone setting up a data stack could adopt this with little issue, and it's easy to tweak things once you're more familiar with the tooling.
Visualisation: Metabase
Now our data is cleaned, transformed and shaped into an ideal format for analysis, it's time we pick a visualization tool.
This choice is crucial, as whatever we pick will be how people interact with our data. One of our key goals for this stack was for non-technically trained staff to benefit, and past experience with tools like Looker suggested that was possible only with significant help from a BI team, which we wanted to avoid.
We picked Metabase as the most intuitive of the options, with visualizations that can be built without any SQL knowledge.
Whether a tool is intuitive is subjective, but Metabase certainly feels that way to me. As an example, let's try and chart the number of incident timeline items created per month and see what that process looks like:

Things to notice:
- No SQL was required, even though we built the visualization from scratch (not from an existing question).
- Joining the Stg Product Timeline Items table with Stg Product Organizations was really easy, in part because Metabase can automatically determine join keys (more on this later).
- The interface was super clean, much closer to a wizard or existing spreadsheet tools than the traditional data toolchain.
All of this helps immensely with onboarding, especially for non-technical staff.
Syncing dbt schemas to Metabase
Metabase can really help lower the barrier to accessing your data, but it's limited by how well it knows the schema.
One example is visible in the previous screen recording, where joining Stg Product Timeline Items with Stg Product Organizations prefilled the join key (Organization ID). Metabase can only default this if it knows Organization ID on Stg Product Timeline Items is a foreign key of Stg Product Organizations, and which field it references.
As it happens, our dbt schemas already know this information, through column tests. Here's the schema for the organization_id field of Stg Product Timeline Items:
---
models:
  - name: stg_product__timeline_items
    columns:
      - name: organisation_id
        description: "Organisation ID"
        tests:
          - not_null
          - relationships:
              to: ref('dim_organisations')
              field: organisation_id
Whenever we have a column that specifies a relationship test, we can infer a foreign-key relationship against the parent table.
So how do we get this into Metabase? There's a tool called dbt-metabase that can infer Metabase semantic type information from the dbt schema and push it into Metabase- we run this whenever complete a dbt build, helping sync Metabase with whatever new fields we may have added.
Inferring foreign keys is just one use of this tool, though - you can manually specific column types too.
As example of where this can be useful, annotating columns as a 'name' allows Metabase to power typeaheads for that entities primary key by the name value, such as using a customer name in a customer ID filter.
Here's an example of setting the type:
columns:
  - name: name
    decription: "Name of the organisation"
    meta:
      metabase.semantic_type: type/Name
  - name: archived_at
    decription: "When the resource was archived"
    meta:
      metabase.semantic_type: type/DeletionTimestamp
  - name: opportunity_annual_value
    meta:
      metabase.semantic_type: type/Currency
    description: "If an opportunity event, annual value in in normal currency denomination"
Onboarding and rollout
That covers the entire stack. As a round-up:
- Fivetran and Stitch to extract data into the BigQuery warehouse
- dbt to perform cleaning and transformations to aid analysis
- Metabase for visualization, with [dbt-metabase][tools/dbt-metabase] for syncing the schema
It took about two weeks to figure all this out and get the bulk of our data sources exposed using dbt, and exposed in Metabase. That was a single engineer who hadn't ever used dbt before, and having to make a lot of these decisions on the fly. I expect someone following this guide could do it much faster.
Once we had the stack up and running, we ran two workshops aiming at different audiences:
- Intro to dbt, for engineers who will build dbt models. We can't hire a full-time BI team just yet, and think we can get by with engineers surfacing more complex data features to Metabase by defining them in dbt. This session covered our dbt setup and we mobbed on adding a feature to a dbt model, manually running the schema sync into Metabase.
- Intro to data, for the entire company. Everyone is expected to use data in their work, so everyone needs to be familiar with Metabase. This session included a rundown of the stack, then working as a group to visualize a few key business metrics. Finally, we took a list of questions we've been dying to have answered and divided it among us, with people trying to answer them in pairs.
Both workshops went great, but the entire company session was my favourite. Two weeks is an eternity in a company like ours, and most of my decisions had been made with clear goals but little experience.
It was a big moment, then, when someone with no SQL experience came to show me a conversion funnel for our product tutorial, and it was exactly right:
Over the last 2 weeks, we've been building @incident_io's data stack.
— Lawrence Jones (@lawrjones) January 20, 2022
The dream was to upskill the whole team in drawing insight from our data.
We just ran a workshop & someone with no SQL/data exp built a funnel for our product tutorial, w/ zero help.
Could not be happier 🍾 https://t.co/tAL61AGPSK pic.twitter.com/RJ12ARSljU
Parting thoughts
Data is a currency at most companies, and it's extremely important that everyone has equal access to it. It's easy – especially when companies begin with highly technical teams – to end up with a few people who know all the answers, undermining ownership and autonomy of those outside that group.
I'm really happy with our current setup, primarily because it provides an equality of access that I've not seen before.
Finally, it's worth reiterating a point that can easily go unnoticed: this stack makes it easy to consolidate data from various sources into a single warehouse, which means you can combine it to unlock significantly more value than the data offers when separate.
Connecting this data means your product activity can be joined with your Sales tools, and your customer success reports can take into account things like how often a customer reached out on Intercom, or if they're in arrears in Stripe.
What this post describes are foundations for capitalizing on this industry-wide change. If you're a small company looking to punch above your weight, you'd be mad not to take that opportunity.

Lawrence Jones
Product Engineer
See related articles

We rebuilt our post-mortems from the ground up
Today we're launching our new post-mortems experience, and I want to walk you through what we've done and why.
 Pete Hamilton
March 17, 2026

Bloom filters: the niche trick behind a 16× faster API
This post is a deep dive into how we improved the P95 latency of an API endpoint from 5s to 0.3s using a niche little computer science trick called a bloom filter.
 Mike Fisher
November 14, 2025

My first three months at incident.io
Hear from Edd - one of our recent joiners in the On-Call team - how have they found their first three months and what's it been like working here.
 Edd Sowden
September 1, 2025
So good, you’ll break things on purpose
Ready for modern incident management? Book a call with one of our experts today.
We’d love to talk to you about
- All-in-one incident management
- Our unmatched speed of deployment
- Why we’re loved by users and easily adopted
- How we work for the whole organization


