Shipping at speed: Using DORA's Deployment Frequency to measure your ability to deliver customer value
May 29, 2023 — 8 min read

Ship. Ship. Ship!
It’s the mentality we all have as DevOps folks–well, at least in theory. In an ideal world, we all have the tools, space, and resources to ship great products, features, and iterations.
We have a clear roadmap, zero or no bottlenecks, proof of concept, design partners, and more. But we don’t just ship for the sake of it–we do it with pace and intention. The end goal? To improve the user experience of our customer base.
But let’s take a step back.
How do we measure success in this framework? And how do we do so without falling back to unreliable vanity metrics? Sure, we’re shipping a lot, but what does efficiency look like? This is where the DORA metric of deployment frequency comes into play.
Here, I’ll lay out this critical and insightful benchmarking metric and explain how it can play a big part in the maturation of your DevOps function.
💭 This article is part of our series on DORA metrics. Here are some links to the rest:
What are DORA deployment frequency metrics?
Spoiler alert: the names of all the DORA metrics give everything away.
According to Google, the mind behind the DevOps Research and Assessment key metrics, deployment frequency is: “how often an organization successfully releases to production.”
It’s a pretty easy metric to calculate but can unveil many deep insights into your DevOps function's efficiency.
How do you measure the efficiency of your deployment frequency according to DORA metrics?
So what do these benchmarks look like? Here’s a table to help visualize this metric:
| Metric | Elite performers | High performers | Medium performers | Low performers |
|---|---|---|---|---|
| Number of deployments | Multiple per day | One deployment per week to one per month | One deployment per month to one every six months | Less than one deployment every six months |
In summary, these metrics help give DevOps teams a sense of how often they’re delivering value to customers through their total number of deployments, whether small iterations or bigger projects. And it's a good indicator of how quickly they can fix things when they go wrong too. The best performers can ship quickly, learn quickly and fix quickly.
Wait, isn’t there inherent risk in deploying to production more often?
Yes and no. Intuitively, you might think that shipping changes to production more frequently increase your margin for error, but if you take a step back, you’ll realize that this isn’t actually the case.
When you deploy smaller changes more often, those changes have a very tight scope. Because of this, if a change results in an incident, it becomes that much easier to isolate and diagnose the issue.
When you’re shipping less frequently, but your deployments are huge, it becomes a massive undertaking to figure out what and where things went wrong. So by deploying smaller, more frequent changes, you’re actually mitigating quite a bit of risk overall.
So how can I improve my deployment frequency?
In a nutshell, try doing what’s laid out in the section you just read! Shipping quickly improves your deployment frequency metrics, but do so in smaller, bite-sized chunks. This way, you help eliminate or mitigate the risks of constantly and exclusively deploying big, complex projects.
Again, this will typically work best for smaller teams, so be sure to translate this guidance to work for your organization.
So whether you’re an engineering leader or an IC on an engineering team, try advocating for a “less is more” mentality if you don’t do so already—it’ll help make very meaningful changes in the long term.
But how can focusing on deployment frequency metrics benefit my organization?
Simply put, it can help create goals for your organization. By understanding what level your organizational efficiency is at, whether it be high or medium, you can set up resourcing accordingly and aim to improve over time.
That said, you don’t have to gun for Elite status above everything else, just the next level up. So if you’re currently deploying at “low” level, consider what changes you can make to your deployment processes, team structure, or something else to reach “medium” level.
Here at incident.io, we ship all the time. If you need proof, just check how often our changelog is updated. That said, we’re well positioned to do so as a 2-year-old startup with just under 50 engineers. In short, we have the infrastructure to allow us to deploy at a high cadence.
A decades-old enterprise company with thousands of engineers and lots of overhead and moving parts just might not have the capacity to ship at the same rate–but it’s not a lost cause.
Again, just consider what it would take to go from shipping once a quarter, to once per month as a start.
Why your organization should care about deployment frequency metrics
Competition is everything right now–and there’s a lot of it. Lots of companies, including the one that you’re a part of right now, are likely fighting for the attention of thousands, if not millions, of the same prospects.
Because of this, it’s really important to be perceived as a company that delivers unquestionable value at a reasonable cadence. And on top of perception, customers have come to expect iteration, all of the time. If you’re standing still, you’re falling behind.
No one, whether you’re a consumer or a vendor, wants to wait months for the next great product feature or iteration. Measuring your deployment frequency can be a great way to get one step closer to executing on your goal of delivering customer value.
This DORA metric is no-nonsense, and, above all, isn’t a vanity metric that exists just to check off a box without much insight in return.
If you have a DevOps team, it’s a fair suggestion to recommend using deployment frequency as a benchmark of success.
How incident.io’s Insights complement deployment frequency metrics
If you're reading this, chances are that you're trying to figure out how to get the most insight into your processes so you can make meaningful changes. And chances are, you also deal with your fair share of incidents.
But it’s fair to say that the process of compiling appropriate data can be quite complicated, especially when it comes to critical incident response metrics.
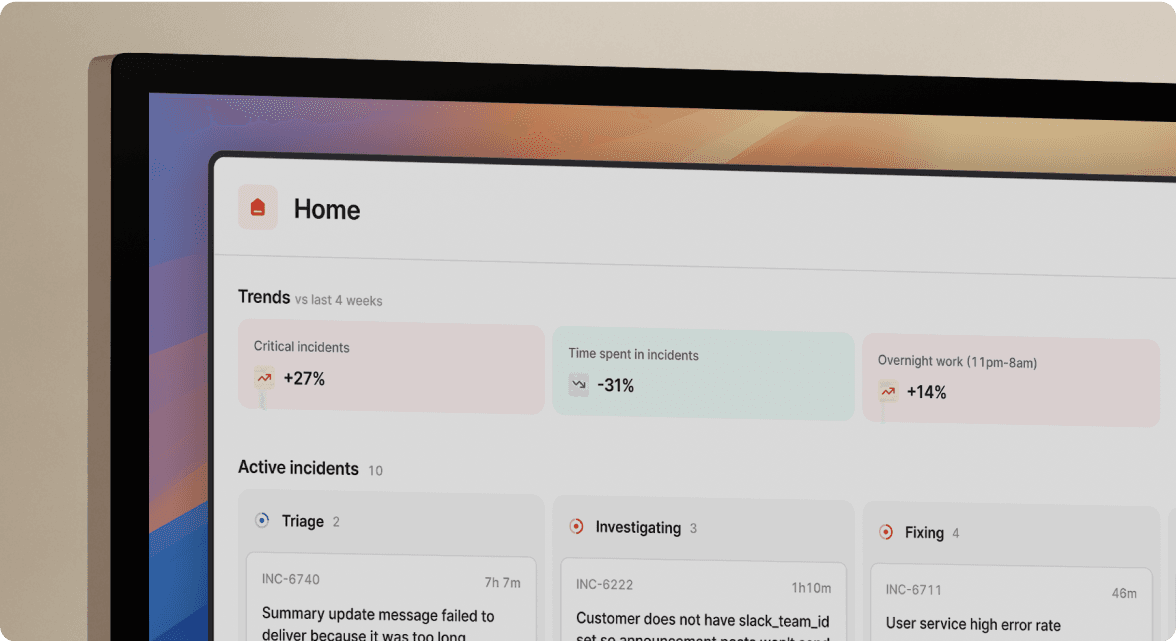
This is where the incident.io's Insights dashboard comes in.
With it, teams can glean dozens of insightful response metrics, allowing them to make meaningful changes to how they operate during incidents.
The best part? Lots of these dashboards are pre-built, so you can jump right in and analyze your response metrics without any overhead. But don’t worry, you can set up your dashboards as well. Here are just a few of the metrics you can track right out of the box:
- Seasonality: To help you answer questions such as, “Do our incidents concentrate around certain days of the month?” or “What do we expect incident workload to be around the Christmas holidays?”
- Pager load: A measure of how your team is responding to on-call, helping to answer questions like “What's the trend in the number of times my team is being paged?” or “Are there only a few people who have been woken up out of hours?”
- Readiness: A set of data points that gives you insight into questions like “How many people have recently responded to incidents involving this service and are likely to know how to handle future incidents?” and “Is our responder base growing or shrinking?”
- MTTX: Datapoints that can help you answer questions such as, “Is our mean-time-to-respond increasing?” or “Which of our services has the lowest time-to-detection?”
...and more.
If you’re interested in seeing how Insights work and how its metrics can fit alongside deployment frequency metrics, be sure to contact us to schedule a custom demo.

Luis Gonzalez
Content Marketing Manager
More from DevOps Research and Assessment (DORA) guide

What are DORA metrics and why should you care about them?
Google's DORA metrics can help organizations create better products, build stronger teams, and improve resilience long-term.
 Luis Gonzalez
May 3, 2023

Development efficiency: Understanding DORA's Mean Lead Time for Changes
By using DORA's Mean Lead Time for Changes metric, organizations can increase their speed of iteration
Luis GonzalezMay 26, 2023

Driving successful change: Understanding DORA's Change Failure Rate metric
By using DORA's change failure rate metric, organizations can highlight inefficiencies in deployment processes and prevent pesky incidents from repeating.
Luis GonzalezJuly 5, 2023
So good, you’ll break things on purpose
Ready for modern incident management? Book a call with one of our experts today.
We’d love to talk to you about
- All-in-one incident management
- Our unmatched speed of deployment
- Why we’re loved by users and easily adopted
- How we work for the whole organization


