What are DORA metrics and why should you care about them?
May 3, 2023 — 9 min read

If you’re in the world of DevOps, you’re well-acclimated to acronyms by now.
SLOs, MTTR, K8s. You get the point. The list goes on and on. But while you’ve likely heard of the three acronyms I just mentioned, one that you might be less familiar with is DORA.
A quick Google search for this acronym will typically render a few results: the DORA I’m about to discuss here, Dora the Explorer (unfortunately, I’m saving our deep-dive into this for another blog series), or DORA, also known as the Digital Operational Resiliency Act.
While the latter does touch on certain concepts that DevOps teams should keep in mind, specifically ICT Risk Management, this Act focuses mostly on setting up regulatory foundations for banks and financial institutions.
So what exactly is the DORA I’m referencing, and why should DevOps teams care about it? I’ll take a deep dive in the sections below, but in summary, it’s a framework of performance metrics that helps give teams a sense of how effectively and efficiently they’re deploying, delivering, and maintaining their software.
💭 This article is part of our series on DORA metrics. Here are some links to the rest:
What is DORA and its key metrics?
DORA stands for DevOps Research and Assessments. It’s a set of metrics developed by Google Cloud’s DevOps Research and Assessments team and is largely based on research into the DevOps practices of tens of thousands of engineers.
In fact, as recently as 2022, Google released a report into the State of DORA, which honed in on DevOps security trends that year. In other words, DORA is a living, breathing thing—not something that was dropped into the ether 15 years ago that everyone follows blindly for reasons of precedent.
So what are the metrics that DORA focuses on?
Deployment Frequency
This metric is relatively straightforward. It measures how often a DevOps team successfully deploys code to production or releases software. These are the benchmarks of success for DORA:
- Elite: Multiple deployments per day
- High: One deployment per week to one per month
- Medium: One deployment per month to one every six months
- Low: Less than one deployment every six months
That said, every organization is different, and the deployment and software delivery definitions vary. But however you define it, DORA helps define what success looks like and what level of team performance might be a cause for concern.
Mean Lead Time for Changes
This metric measures the time between committing and releasing code into production. In practice, the less time between these two points, the faster your team can ship software to users. To measure it, DevOps teams should calculate project run time from start to finish and find the average time. Here’s how DORA defines this metric:
- Elite: Less than one per hour
- High: Between one day and one week
- Medium: Between one month and six months
- Low: More than six months
Again, what this looks like per organization will vary quite a bit depending on the makeup of your teams, priorities, and other variable factors.
Change Failure Rate
In the world of DevOps, unfortunately, things break all the time. Change Failure Rate measures the percentage of deployments that cause a failure in production, requiring an immediate fix. To calculate this metric, teams can use the following formula:
(deployment failures / total deployments) x 100
Here’s how DORA benchmarks this metric:
- Elite: 0-15%
- High: 16-30%
- Medium: 16-30%
- Low: 16-30%
Time to Restore Service
And finally, Time to Restore Service, also known more widely as MTTR or mean time to recovery, measures how quickly teams resolve incidents that cause service disruptions for users.
Here are the benchmarks for this metric:
- Elite: Less than one hour
- High: Less than one day
- Medium: Between one day and one week
- Low: More than six months
Put together, these four metrics help give DevOps teams a comprehensive picture of how they're performing overall and where there might be any areas for improvement. It can also help identify high-performing engineers and spotlight low-performers or teams needing appropriate guidance.
Why should my team be using DORA metrics to measure DevOps performance?
This is the million-dollar question. Every team has their own measures of success. Whether you’re already using DORA metrics and don’t even realize it, or you’re using something else, measuring something is a good signal that you’re taking things seriously.
But why does DORA stand out specifically as the metrics to work towards? Put simply, it’s the one with the best proof of concept. Like I said at the beginning here, Google went out and surveyed quite literally tens of thousands of DevOps teams and engineering leaders in order to compile the guidance and metrics for DORA.
When you have a sample size that large, it makes any results pretty noteworthy and reliable.
What are the benefits of using DORA metrics?
Implementing metrics at any organization is a long process—but there are always benefits to doing so.
It’s no different with DORA.
While it may seem a bit intimidating at first, there’s plenty of upside to using the metrics laid out above to measure the performance of your DevOps teams.
Data speaks volumes
When it comes to DevOps, metrics carry a lot of weight. They help teams understand any areas of improvement, bottlenecks in processes, what to lean into as a strength, and much more. With DORA, teams can get a comprehensive performance overview across four highly-relevant areas.
Iteration, iteration, iteration
The best part about all of the insight you can gather through DORA? You can implement any learnings into organization-wide improvements. But this isn’t a one-time exercise. As you continue evolving as an organization and re-analyze your DORA metrics, you can further iterate on any changes you’ve made.
So whether you’ve made changes to processes, team structure, deliverables, tooling, or something else, the insights you gain from DORA can help you determine if the changes were for the best.
How incident.io’s Insights can help improve your DORA metrics
If you’re interested in DORA, chances are you’re very data or results-driven—or both! But as you probably know, the process of gathering appropriate data can be quite cumbersome and an exercise in frustration, especially when it comes to incident response metrics.
This is where incident.io comes in.
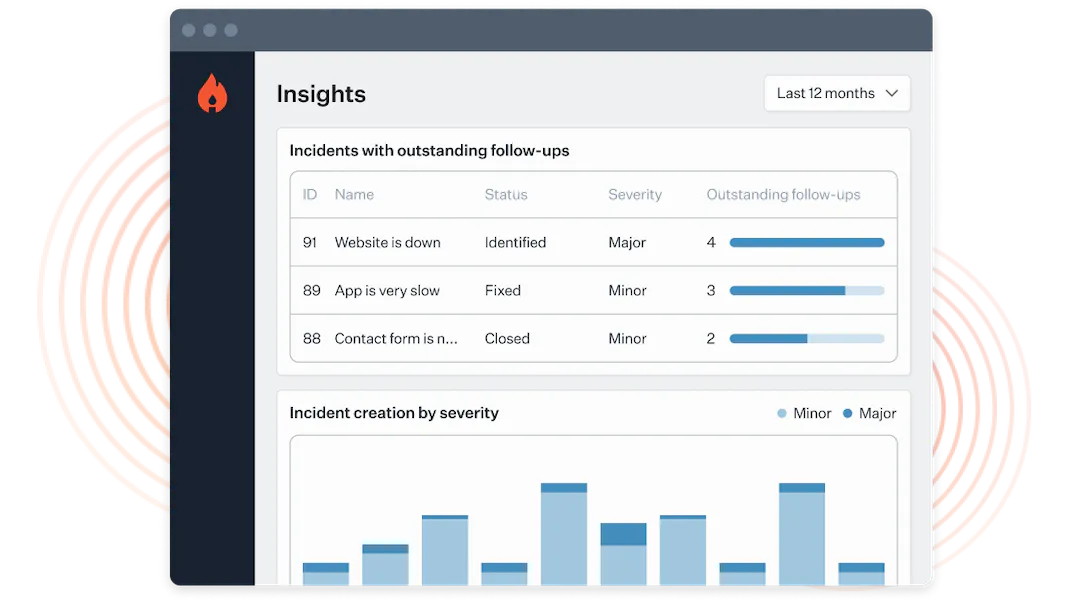
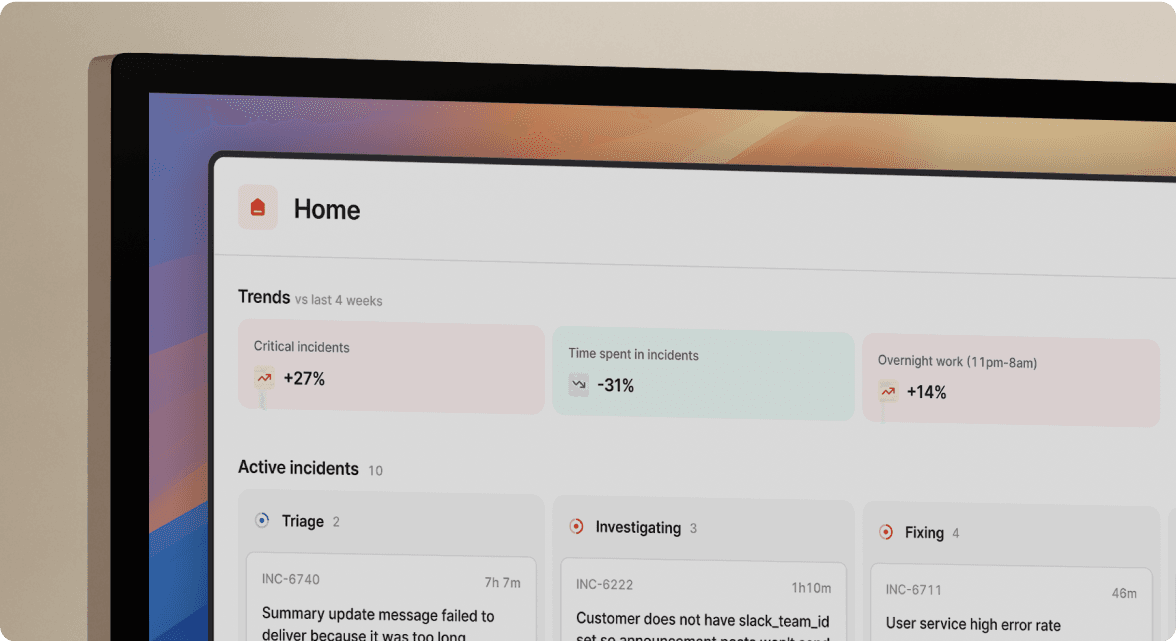
One of the biggest benefits of our incident management tool is our Insights dashboard. With it, teams can glean many relevant and insightful response metrics, allowing them to make meaningful changes to how they structure their teams, organize on-call rotations, and even the processes they have in place.
The best part about it? Many of these dashboards are pre-built, so you can jump right in and analyze your response metrics without any overhead. Here are just a few of the metrics you can track right out of the box:
- MTTX: Datapoints that can help you answer questions such as, “Is our mean-time-to-respond increasing?” or “Which of our services has the lowest time-to-detection?”
- Seasonality: To help you answer questions such as, “Do our incidents concentrate around certain days of the month?” or “What do we expect incident workload to be around the Christmas holidays?”
- Pager load: A measure of how your team is responding to on-call, helping to answer questions like “What's the trend in the number of times my team is being paged?” or “Are there only a few people who have been woken up out of hours?”
- Readiness: A set of data points that gives you insight into questions like “How many people have recently responded to incidents involving this service and are likely to know how to handle future incidents?” and “Is our responder base growing or shrinking?”
...and more.
If you’re interested in seeing how Insights work and how its metrics can fit alongside DORA, be sure to contact us to schedule a custom demo.

Luis Gonzalez
Content Marketing Manager
More from DevOps Research and Assessment (DORA) guide

Development efficiency: Understanding DORA's Mean Lead Time for Changes
By using DORA's Mean Lead Time for Changes metric, organizations can increase their speed of iteration
 Luis Gonzalez
May 26, 2023

Shipping at speed: Using DORA's Deployment Frequency to measure your ability to deliver customer value
By using DORA's deployment frequency metric, organizations can improve customer impact and product reliability.
Luis GonzalezMay 29, 2023

Driving successful change: Understanding DORA's Change Failure Rate metric
By using DORA's change failure rate metric, organizations can highlight inefficiencies in deployment processes and prevent pesky incidents from repeating.
Luis GonzalezJuly 5, 2023
So good, you’ll break things on purpose
Ready for modern incident management? Book a call with one of our experts today.
We’d love to talk to you about
- All-in-one incident management
- Our unmatched speed of deployment
- Why we’re loved by users and easily adopted
- How we work for the whole organization


