Development efficiency: Understanding DORA's Mean Lead Time for Changes
May 26, 2023 — 7 min read

Raise your hand if you like shipping changes quickly. (Yes, let's assume that everything you're shipping has value and isn't a vanity project).
Chances are, you, the person reading this now, agreed with the above. When you start on a project, big or small, you want to keep any changes moving along and avoid getting stuck.
The less time between the beginning and end of a project, the faster you can shift your focus to other things. Ultimately, no one wants to spend more time than they have to on any given task.
Here is where Mean Lead Time for Changes comes in. This DORA metric gives teams guidance on what successful change deployment timelines look like.
In this article, I'll dive deeper into Mean Lead Time for Changes and how DevOps teams can implement its insights into their day-to-day to reduce the amount of time it takes to ship value to customers.
You'll also learn how incident.io can fit into this part of the DORA metric puzzle, with an Insights feature designed to help you learn from any incidents you encounter along the way.
💭 This article is part of our series on DORA metrics. Here are some links to the rest:
What is Mean Lead Time for Changes?
Mean lead time for changes is a metric used by software development teams to measure the time between committing code into a repository and that same code running (or being available to run/behind a feature flag) in production.
Let's imagine an engineering team is working on a small isolated code change. The moment they commit the change is when the Mean Lead Time for Changes clock starts–it ends once they deploy it to production. But there's some nuance to it that we'll cover in the sections below.
What are the benchmarks of success for Mean Lead Time for Changes?
Here's how DORA defines success or failure when it comes to this metric:
- Elite performers: Less than one hour
- High performers: Between one day and one week
- Medium performers: Between one month and six months
- Low performers: More than six months
Again, this will vary quite a bit depending on the size and maturity of your organization. Larger companies tend to have more drawn-out processes and organizational complexity, so their longer Mean Lead Time for Changes will likely reflect that nuance. On the other hand, smaller organizations tend to have tighter processes with fewer folks in the room, so they may rank a bit higher here.
OK, so what else is there to this metric?
Mean Lead Time for Changes is an essential metric for your company, since it ultimately measures how quickly and efficiently your team can action change requests. For instance, if your customer experiences some unexpected behavior in-app, how fast can your team deploy a fix? The faster, the better.
As a general point, companies that deal with longer lead times do so because they involve multiple teams, have shared environments, complex routes to live, and more. Each one of these, and more, have the potential to slow teams down to a crawl.
To improve and optimize your Mean Lead Time for Changes, it's crucial to understand its components and the best way to understand and make improvements on this metric is by breaking your process down into sections. For example, the actual work on the change should be considered separate from the time it takes to deploy that finished change to production.
By mapping and isolating these segments, you’ll be able to identify which part of the process to focus on. It’s worth calling out that how many segments you break this up into will depend on how you organize your processes.
…so how can I actually improve my Mean Lead Time for Changes?
Broadly speaking, the biggest challenge to an Elite Mean Lead Time for Changes is testing.
But let me make one thing clear: testing is crucial.
The issue is that many teams tend to treat it as a completely separate step in their release process, which can add a significant chunk of time to the change lead time. So to get around this, try to integrate testing into your development and deployment processes instead of treating it as a separate step.
It’s all about eliminating bottlenecks throughout the process.
But it’s also important to look around for any other areas where Mean Lead Time for Changes can get drawn out. I called out a few reasons why organizations might have delayed lead times above, but some other things to consider are slow deployment frequency processes or bad communication between teams. If any of these are persistent issues for your org, try to focus some effort and resources on streamlining those and other areas for improvement.
By identifying and addressing these hurdles, you can significantly reduce your Change Lead Time and deliver changes to production much faster.
How incident.io's Insights can give you a comprehensive view of your operational efficiency
If you're interested in improving your Mean Lead Time for Changes, chances are you're very data-driven. But the process of compiling appropriate data can be pretty complicated, especially when it comes to critical incident response metrics.
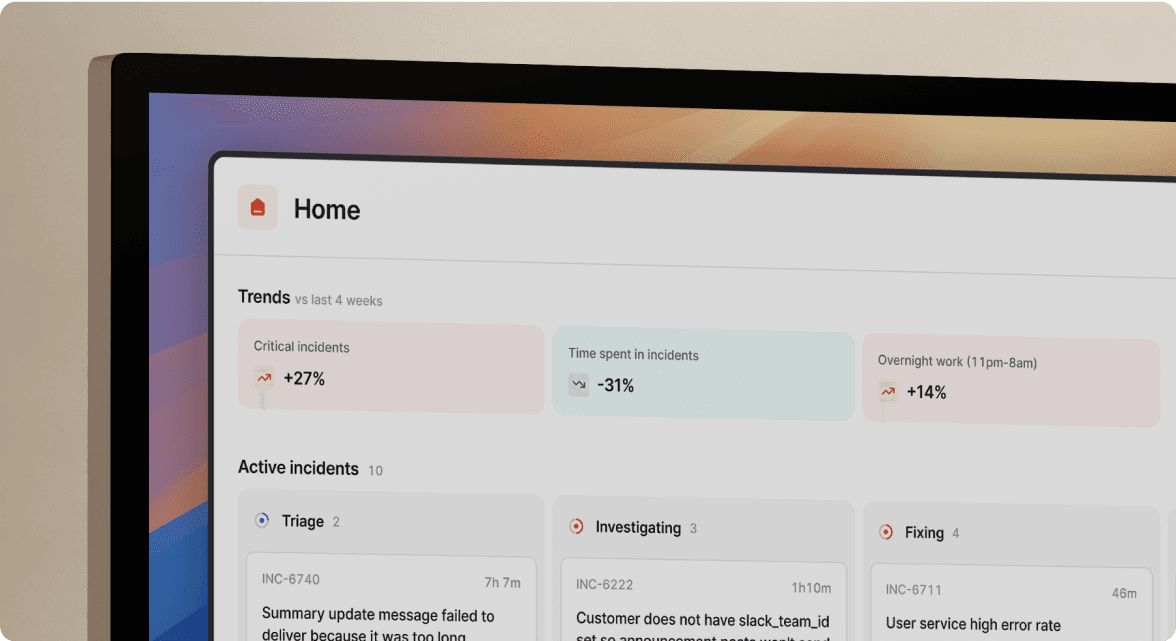
This is where incident.io's Insights dashboard comes in.
With it, team members and engineering leaders can glean dozens of insightful response metrics, allowing them to make meaningful changes to how they operate during incidents.
The best part? Many of these dashboards are pre-built, so you can jump right in and analyze key metrics without the overhead. But don't worry; you can set up your dashboards as well. Here are just a few of the metrics you can track right out of the box:
- Seasonality: To help you answer questions such as, "Do our incidents concentrate around certain days of the month?" or "What do we expect incident workload to be around the Christmas holidays?"
- Pager load: A measure of how your team is responding to on-call, helping to answer questions like "What's the trend in the number of times my team is being paged?" or "Are there only a few people who have been woken up out of hours?"
- Readiness: A set of data points that gives insight into questions like "How many people have recently responded to incidents involving this service and are likely to know how to handle future incidents?" and "Is our responder base growing or shrinking?"
- MTTX: Datapoints that can help you answer questions such as, "Is our mean-time-to-respond increasing?" or "Which of our services has the lowest time-to-detection?"
...and more.
If you're interested in seeing how Insights work and how its metrics can fit alongside Mean Lead Time for Changes, be sure to contact us to schedule a custom demo.

Luis Gonzalez
Content Marketing Manager
More from DevOps Research and Assessment (DORA) guide

What are DORA metrics and why should you care about them?
Google's DORA metrics can help organizations create better products, build stronger teams, and improve resilience long-term.
 Luis Gonzalez
May 3, 2023

Shipping at speed: Using DORA's Deployment Frequency to measure your ability to deliver customer value
By using DORA's deployment frequency metric, organizations can improve customer impact and product reliability.
Luis GonzalezMay 29, 2023

Driving successful change: Understanding DORA's Change Failure Rate metric
By using DORA's change failure rate metric, organizations can highlight inefficiencies in deployment processes and prevent pesky incidents from repeating.
Luis GonzalezJuly 5, 2023
So good, you’ll break things on purpose
Ready for modern incident management? Book a call with one of our experts today.
We’d love to talk to you about
- All-in-one incident management
- Our unmatched speed of deployment
- Why we’re loved by users and easily adopted
- How we work for the whole organization


