How we model our data warehouse
November 8, 2024 — 13 min read

We've written several times about our data stack here incident, but never about our underlying data warehouse and the design principles behind it.
This blog post will run through the high-level structure of our data warehouse and then will go in-depth into the underlying layers.
At a glance
We follow dbt labs’ high-level approach for data modeling, splitting our data warehouse into staging (stg_[source]__[model name]), intermediate (int_[source]__[model name]) and marts layers (dim/fct for internal facing data models, and insights for customer-facing data models).
- Note that we include the
sourcename in our intermediate models which isn’t in the guide - but it works for us as typically most joins we’re doing in intermediate models are all from 1 data source.
We also apply these design principles for achieving flexible but consistent data modeling in our BI tool (which we’ll go through at the end):
- Use pre-joined, modeled marts tables in your BI tool to answer ~80-90% of queries, and give power users the ability to the other 10-20%
- Don’t surface intermediate tables in your BI tool
- Don’t “over model” your marts models
- Don’t allow staging tables to become part of these pre-joined datasets in your BI tool, and don’t save custom columns in your BI tool
1. Staging models
Purpose: rename columns & cast data types, perform basic calculations.
Staging models are typically one dbt model per source table, but we're not overly prescriptive about this.
In some cases, data sources can have a highly denormalized table structure (like Stripe or Salesforce), and we might have multiple source tables that are only ever used in conjunction with others. Take the Salesforce user and user_role tables for example in our stg_salesforce__users table:
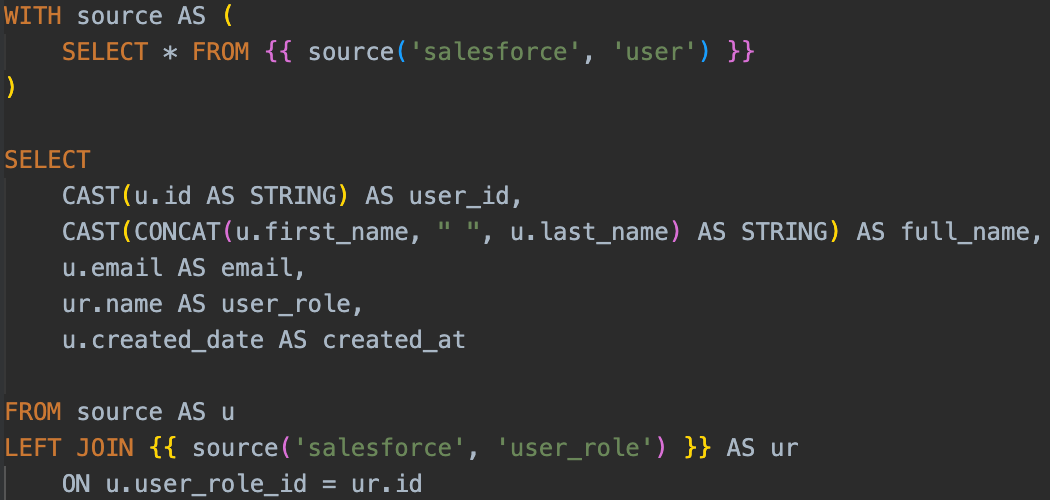
We could have a stg_salesforce__user_roles table, but given we have no use case for it outside of this data model - combining both into a single data table saves us having 2 separate dbt models.
This is the exception, rather than the norm, and it’s easier to strike this balance when you’re a smaller data team with a lot more context on how data sources are used across the whole repo.
However, we make sure that regardless of whether 1 or more source tables are used for a staging model:
- They end up as 1 row per “thing” described by the model name, such as a Salesforce user
- They aren’t used for complex joins and calculations, as we do these in intermediate models
2. Intermediate tables
Purpose: join tables together, and perform more complex calculations.
Intermediate tables essentially act as the “plumbing” between our staging and marts layers. You can think of these as cases where we might have complex calculations involving joining one or more tables together that we might want to reuse across multiple data models, or that we might want to break out as a separate step before pulling into our marts layer.
A good example of this is calculating some metrics on a per-user-per-day level before bringing them into our marts layer. This might be an expensive or difficult calculation and doing it on the fly in a marts model as well as joining several other data tables at the same time might make the overall pipeline run a lot slower.
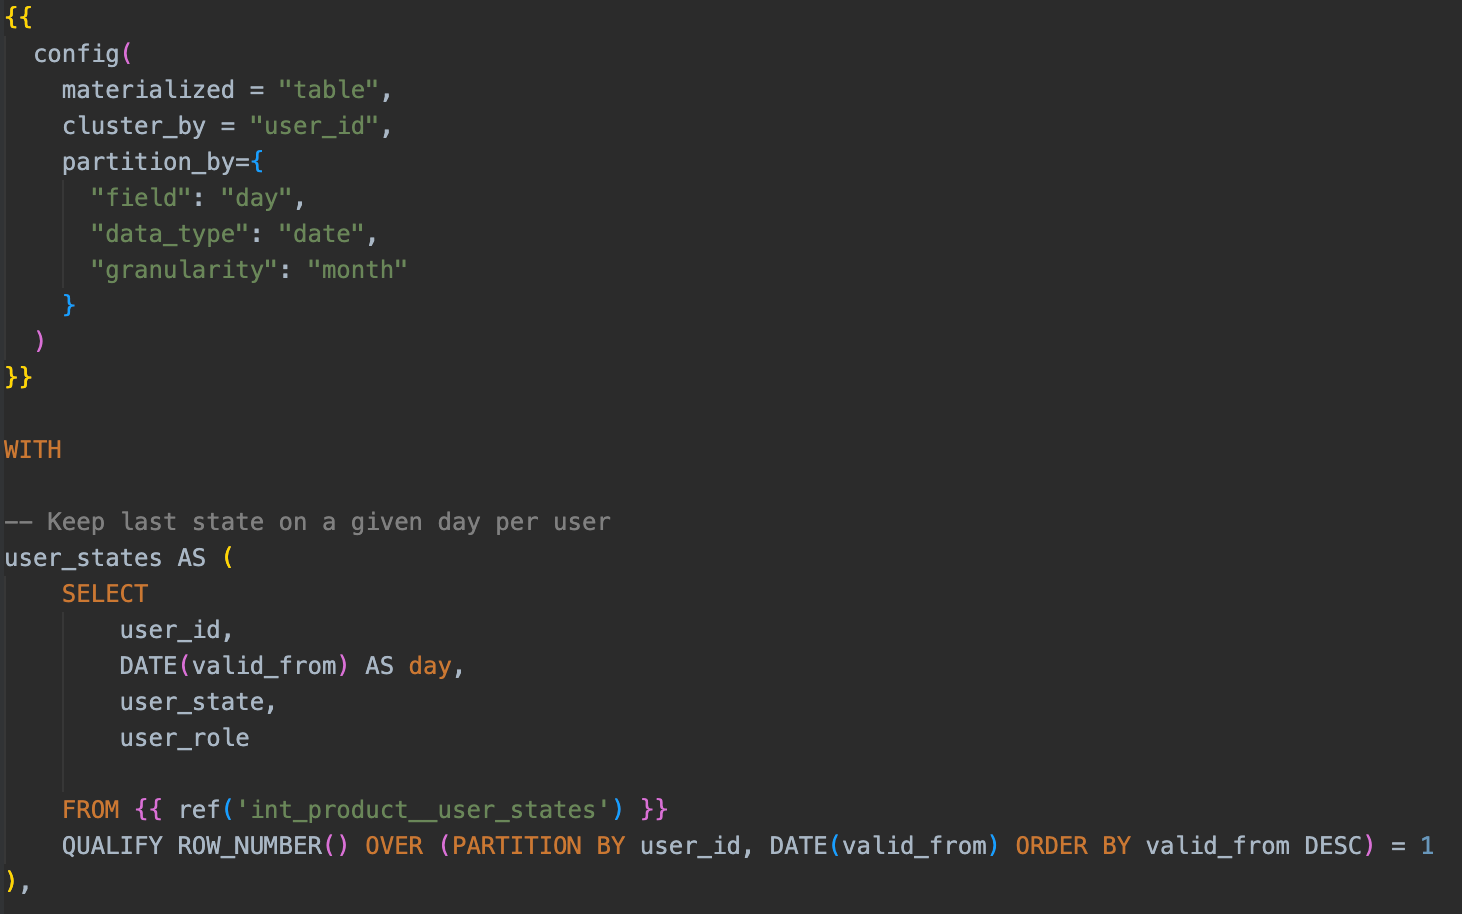
Our intermediate layer has the least restrictive naming conventions, as our staging and marts layers both, by design, are named by their granularity whereas you can have multiple intermediate models with the same granularity (e.g. per user per day) - typically to split complex calculations out so they can be run in parallel.
Intermediate models can select from any layer - as there are legitimate cases where you might do further transformation on a marts model before another marts model. The important part is that they aren’t used in our BI tool (more on that later).
3. Marts models
Purpose: surface data internally or to our customers.
Our marts layer is split into two main sections, a customer-facing set of data models and an internal-facing set of data models.
➡️ Customer facing marts (insights) models
These are the models used to power our Insights feature in our product - a set of dashboards that cover everything from paging through to how your workload is being shared across your responders.
We build these models first in our data pipeline to check that they run before replacing any production data.
As this is the most important part of our dbt pipeline, we do a couple of things to keep the modeling as neat as possible and make sure we only surface things in our customer-facing insights that we intend to:
- We restrict our embedded chart tool, Explo, to only have access to models in the
models/marts/insightsfolder by cloning them into a separatedbt_production_insightsschema and only giving it access to that schema. The advantage of this is that we can't accidentally include data models from outside of the insights folder when building customer-facing charts. - Secondly, we avoid having anything in the
models/marts/insightsfolder selecting data from our internal facing marts models (prefixed withdim/fct). This is because we don't want our customer-facing data models to be downstream of a lot of our internal-facing data models - it means insights models take longer to run and are downstream of models that are inherently more breakable as they are changed more often.
⬅️ Internal marts models
Our internal data models are your typical dimension (dim) or fact (fct) tables which are one row per “thing” that can change over time and one row per “thing that happened” (that doesn't change over time) respectively.
Currently, we only have one model per granularity. For example, we have one dim_users table rather than separate tables with the granularity of one row per user ID. This prevents us from having a complicated set of data models where you don't know which table contains which column.
- This may not scale when you end up with tables that are very wide with a lot of columns, where it may be more sensible to split it out into a core table and satellite tables. But for now, this approach works for us.
Another important consideration for data warehousing is how the data models will be used, particularly when you are considering BI tools.
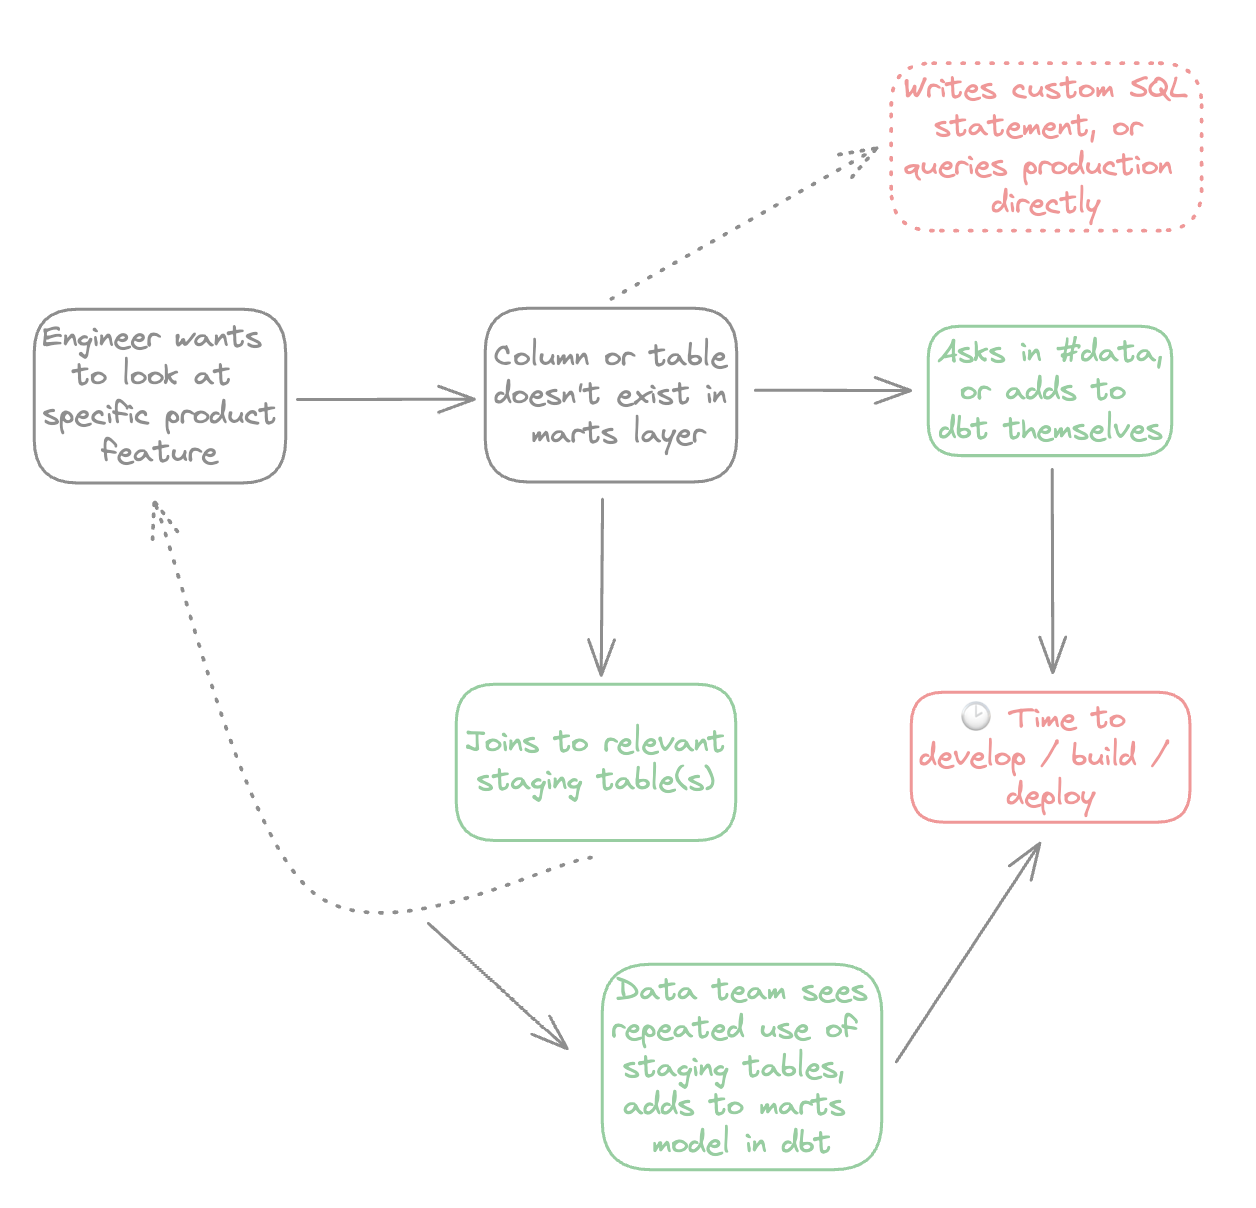
Typically, in BI tools, you’d only surface marts models like a dim_users table. But say an engineer wants to look at how a specific product feature is being used - and they are missing a column (or entire data model!) needed to answer their question.
In this scenario, they’d go through 1 of 2 flows:
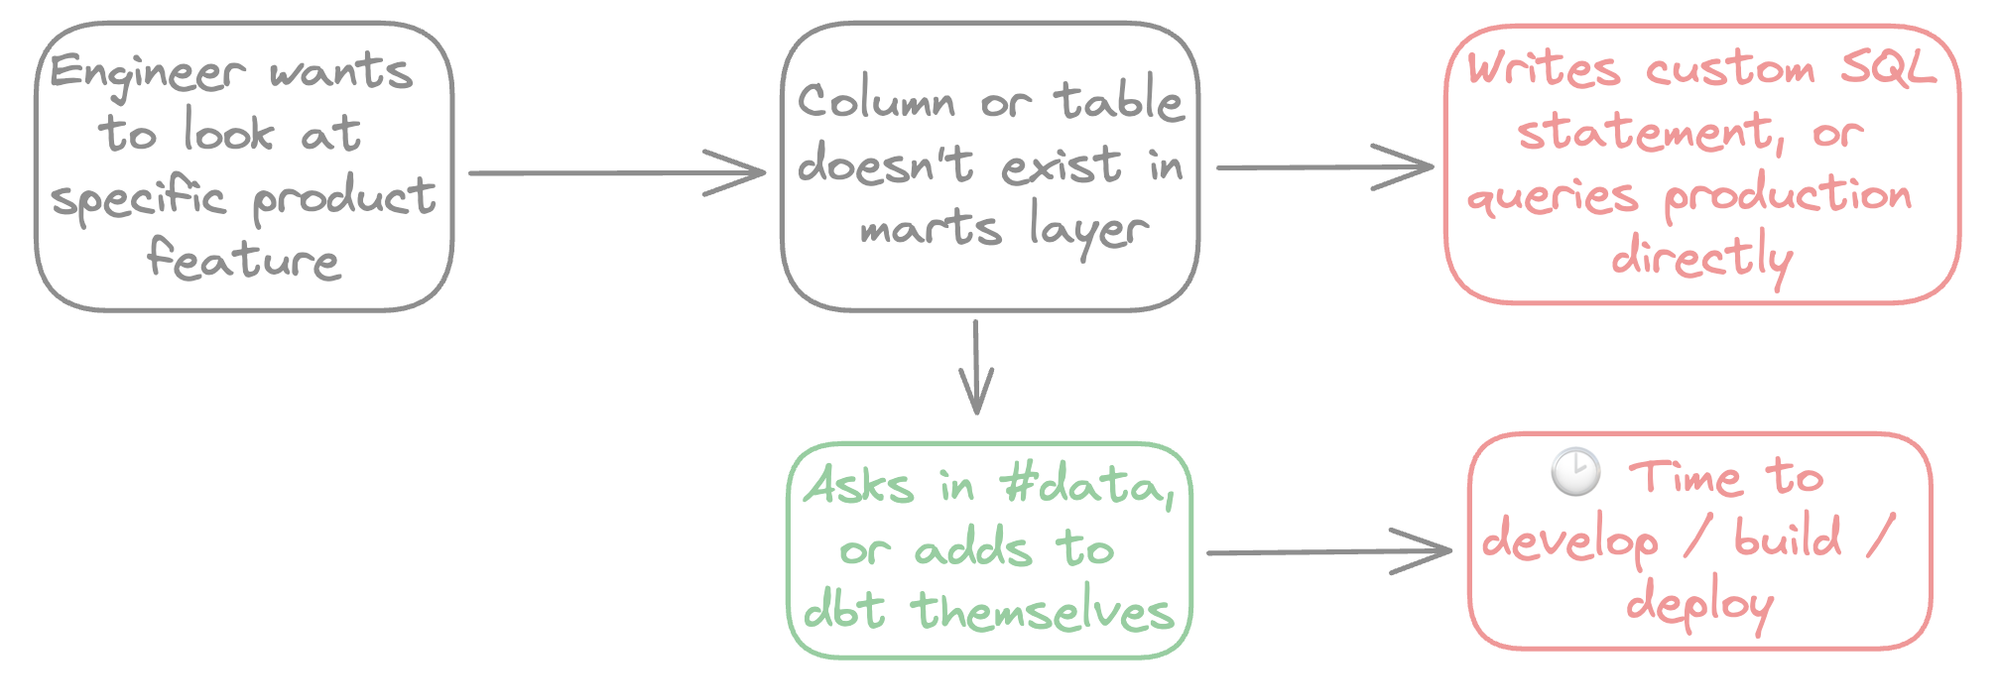
Strictly adhering to one route has downsides:
- Always going via the top route results in a mess of custom-written SQL where it’s nearly impossible to have consistent joins and filters being applied
- Always going via the bottom flow results in data being inundated with requests for new dbt models and code, delays in answering questions, and a lot of upfront work
So the question is - how do you know what to put in marts models? And should marts models be the only ones being surfaced in your BI tool?
Design principles for achieving flexible but consistent data modeling in your BI tool
Use pre-joined, modeled marts tables to answer ~80-90% of queries, and give power users the ability go the other 10-20%
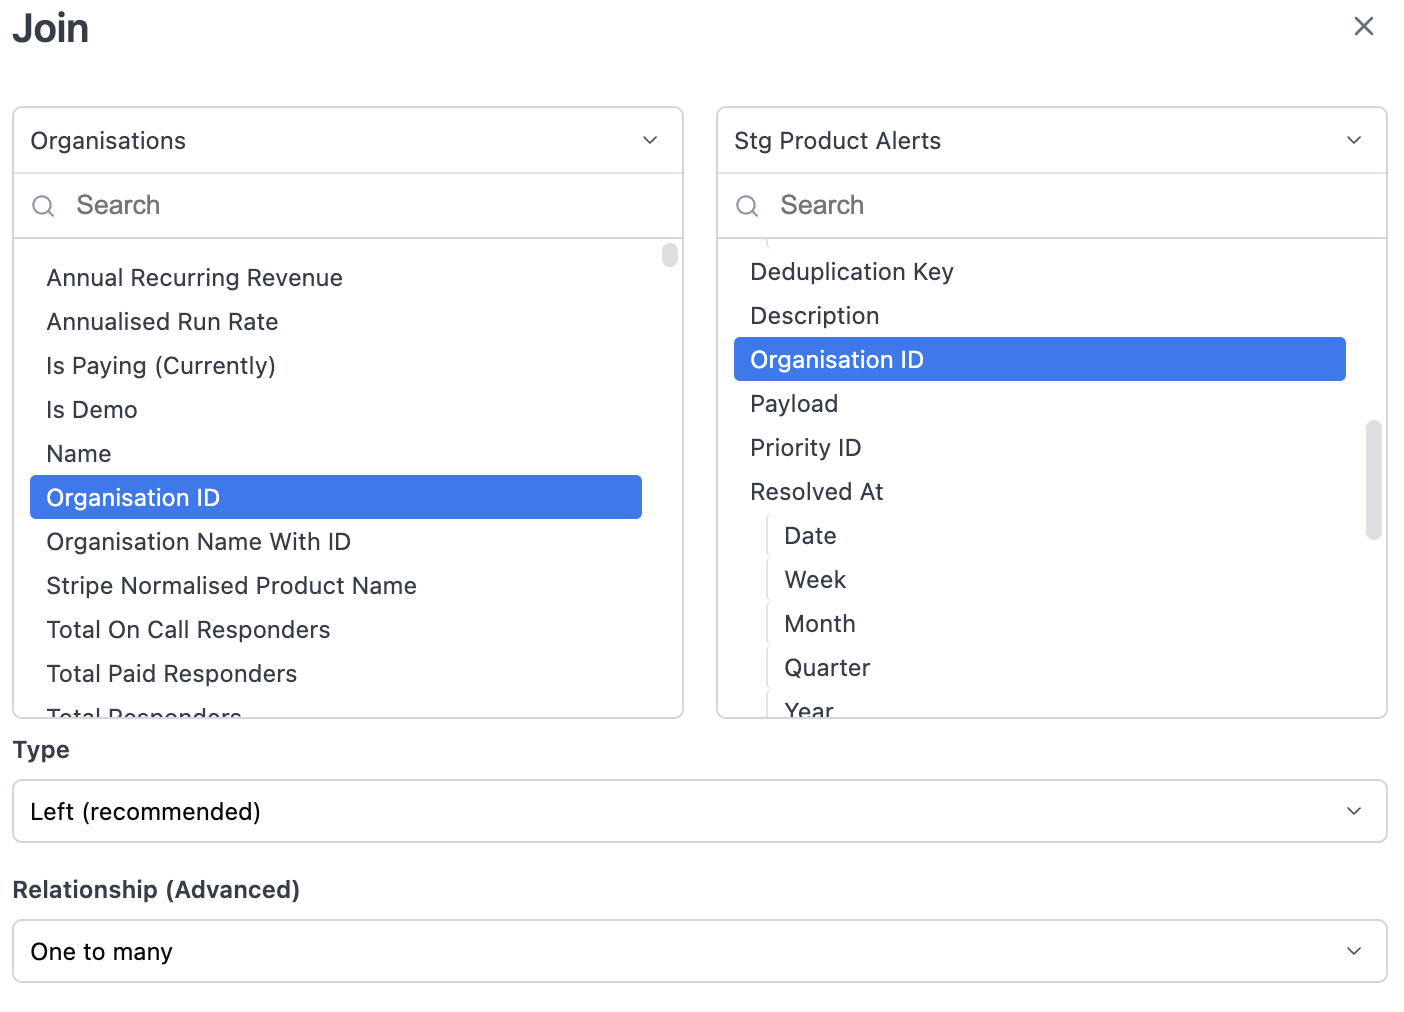
Using our BI tool Omni, we can surface pre-joined datasets like dim_organizations and fct_organizations_daily with default filters applied.
This is accessible through a simple point-and-click UI that will answer most questions people have using marts models. Note that we remove dim and fct prefixes in our BI tool for simplicity for the end user!
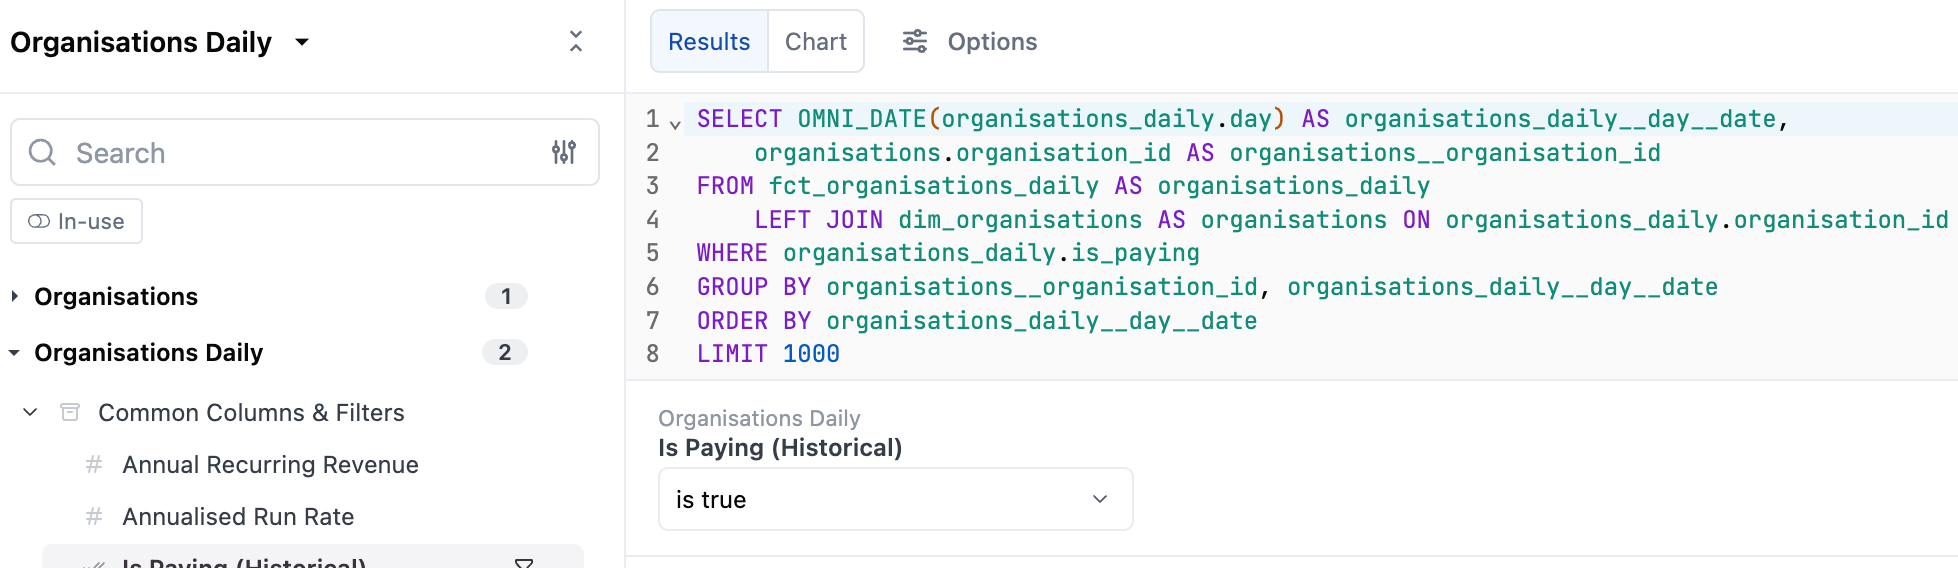
Then power users can still use the UI to join to staging tables on the fly if they want to.
This solves for consistency (using a UI, with pre-joined and filtered datasets) with flexibility, but doesn’t answer:
- What about intermediate models?
- When should something be added to a marts model, or when should a new marts model be created?
Don’t surface intermediate tables in your BI tool
As I mentioned earlier, you can have multiple intermediate models that have the same granularity, and in our old BI tool we fell into a pattern of “I just need this column that’s not in a dim/fct model so I’ll join to this intermediate model”.
This can result in a confusing mess of joins across multiple tables of the same granularity, meaning it’s easy to get something wrong and goes too far against the principle of consistency.
In our dbt_project.yml file, we simply put the intermediate models in another schema altogether.

This has the nice bonus of creating a clean gap between a marts model that is surfaced to non-technical users, and staging models for those technical users that need to go the extra step.
Don’t “over model” your marts models
It's very easy when adding new data sources, especially with tools like dbt, to add lots of columns & calculations to your marts models that you might need in the future.
Whilst this is useful, it can also result in lots of speculative data modeling where you might be adding 10+ columns to a table just because you need one at the time but might need the others in the future.
If you're running your dbt model hourly or several times a day than the cost of adding a column that is never used builds up very quickly over time. There’s also the added complexity (and potential slowness) to your BI tool by having 5-10x the number of columns than you actually use.
Whilst this is a nice idea in principle, it still doesn’t provide a firm guide as to what to include in your marts layer and when. This leads us to our final principle.
Don’t allow staging tables to become part of these pre-joined datasets in your BI tool, and don’t save custom columns in your BI tool
If you allow a staging table to become part of a pre-joined dataset (surfaced to all users) in your BI tool, it’s basically a marts model in all but name!
The same applies to custom column logic - once you’ve established that a calculation is useful enough to be re-used across your company, it should be moved into dbt. You can make the odd exception here (e.g. a column purely for BI purposes, like using the domain to create a hyperlink), but having saved calculations living in your BI tool results in business logic being spread across 2 areas.
Both of these things result in demand-driven modeling when adding to your marts layer. Consider our engineer’s cycle again but with the addition of ad-hoc joins to staging tables:
By deliberately adding light friction: having to always specify joins to staging models on the fly rather than being pre-joined, and having to start any custom calculations from scratch, you create demand for something to be added to the marts layer.
A great example of this was our stg_salesforce__contacts model. We found ourselves doing so many ad-hoc joins to it that we decided to create a dim_salesforce_contacts model so we could include it in our pre-joined datasets.
This approach avoids lots of upfront modeling, duplicate dbt marts models that are just a SELECT * from a staging model, a lot of dbt calculations that may not be used, and importantly doesn’t make the data team a bottleneck.
🧠 Closing thoughts
This approach works for us as a smaller company as it’s easy to have a subjective view on when there’s enough of a demand for something to be added to our marts layer, but there are ways to make this scale:
- You can use database logs to see which staging tables are being used the most frequently in your BI tool
- You can also use database logs to see which columns and models are barely used and can be cut
Hopefully this post has given you an insight into how we structure our data warehouse, and why such a large influence comes from how we use them in our BI tool.

Jack Colsey
Head of Data
See related articles

Institutional knowledge doesn't scale: Building an agentic data analyst
Institutional knowledge was always the bottleneck. Here's how we built an agentic data analyst to distribute it more efficiently — and what happened when we let the whole company ask it questions.
 Navo Das
August 3, 2026

Dashboards aren’t (quite) dead
How they still matter as the curated, trusted layer that keeps both humans and LLMs telling the same story from the same data.
 Jack Colsey
July 29, 2026

Pager fatigue: Making the invisible work visible
We developed The Fatigue Score to make sure our On-call responders’ efforts are visible. Here's how we did it, and how you can too.
 Matilda Hultgren
April 25, 2025
So good, you’ll break things on purpose
Ready for modern incident management? Book a call with one of our experts today.
We’d love to talk to you about
- All-in-one incident management
- Our unmatched speed of deployment
- Why we’re loved by users and easily adopted
- How we work for the whole organization


