Data stack 2024
August 6, 2024 — 11 min read

It’s been almost 2 years since our last post on our data stack, and an update is long overdue! This post will give an overview of what our current setup looks like, and dive a bit more into some highlights like:
- Why we moved to Omni for our internal BI tooling, Explo for customer facing embedded insights in our product, and how we’re using Hex for ad-hoc analysis
- Some of the improvements made to our local dev setup
- How we use our own On-call product to identify and alert us of any data pipeline issues
🧱 Our current setup
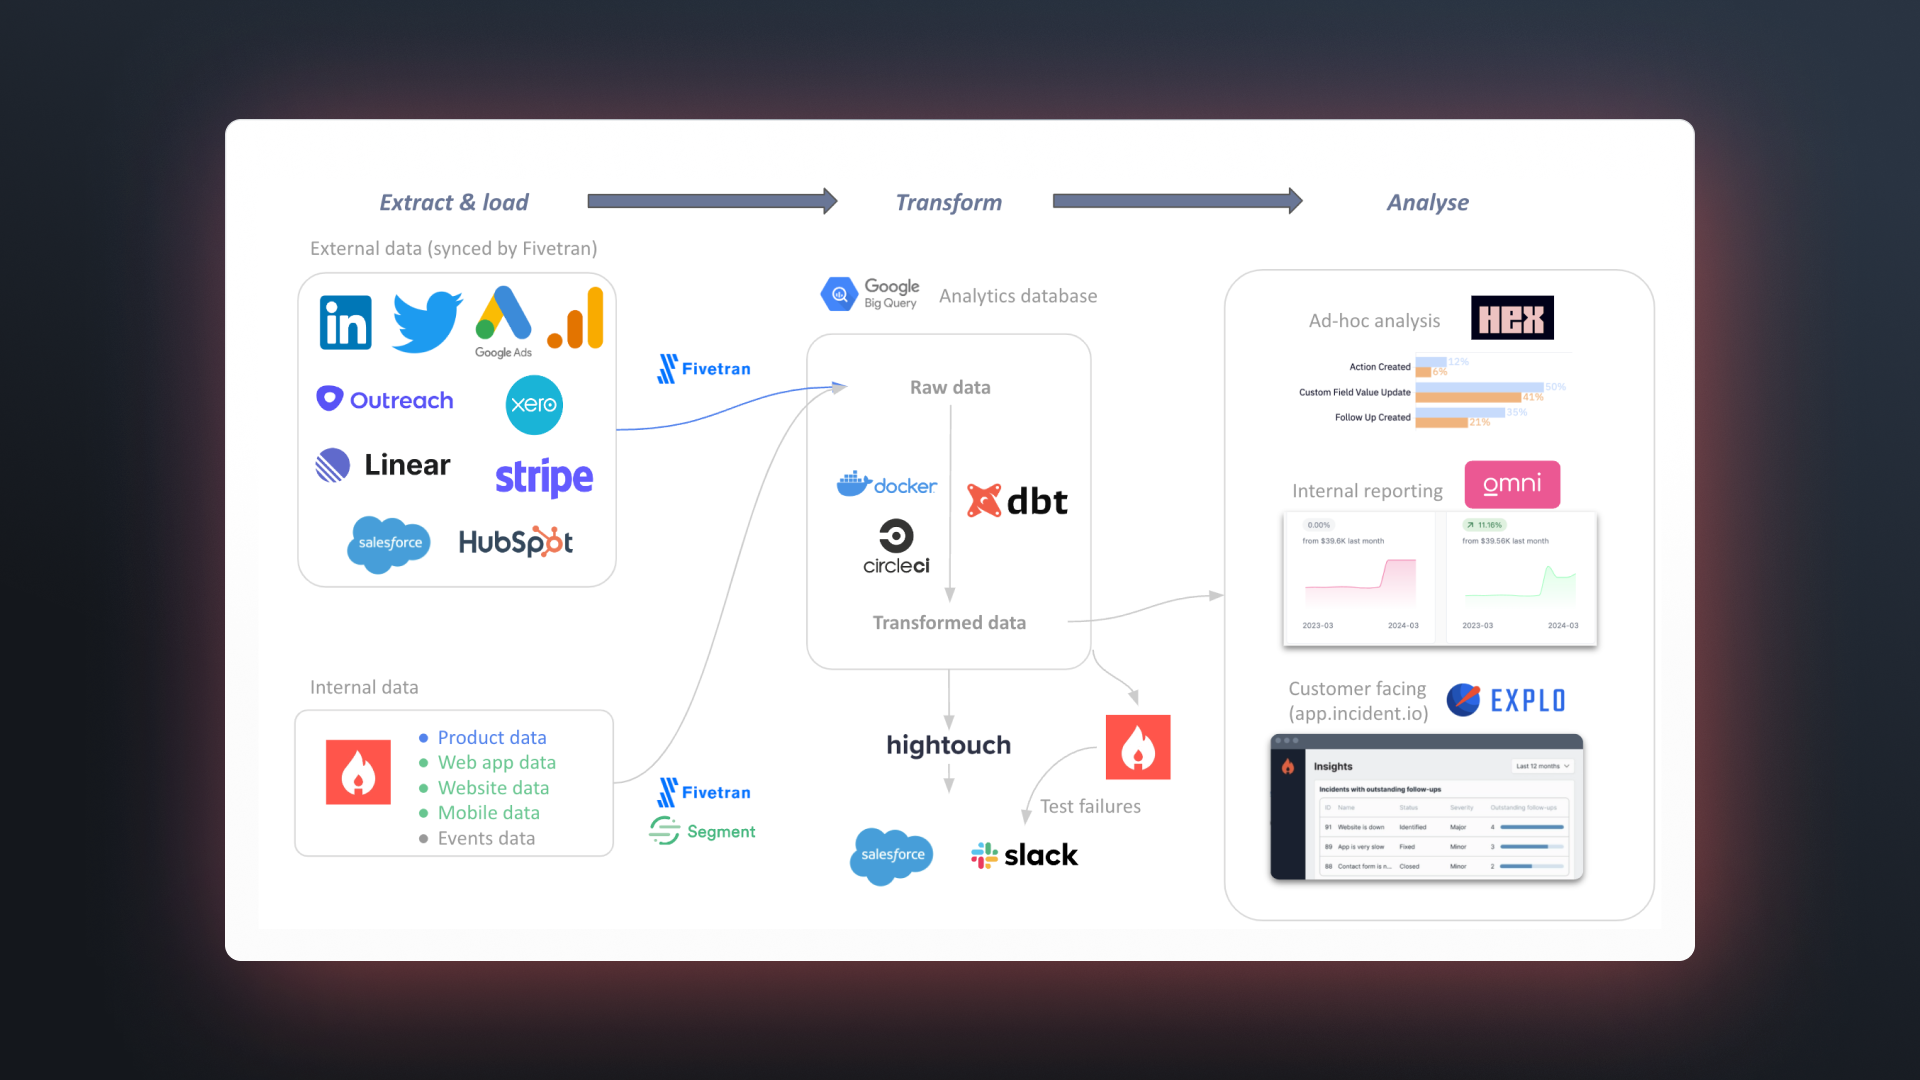
As in the last post on our data stack, we’ll start with a quick overview of how our data stack fits together. Our stack can be thought of being in 3 broad sections: Extract & load (EL), Transform (T), and Analyze.
Extract & load:
- We use Fivetran to sync all of our external data sources—as well as our production data from our GCP Postgres database—into BigQuery
- Other event data from our product that is more transient or doesn’t live in our production database (e.g. a status page being viewed, or a Slack command being invoked) is published directly into BigQuery
- We use Segment to sync data from website activity, our web app (app.incident.io), and our mobile app into BigQuery
Transform:
- We’re big fans of dbt here, and use it for all of our SQL transformations and data model documentation & testing
- We use CircleCI for running CI/CD (testing that code changes work before deploying, and deploying any changes), and generally running our dbt SQL code on a regular basis
- We use Docker for running dbt on CircleCI
- We use Hightouch to sync transformed data from BigQuery into Salesforce, and to send alerts / data insights to Slack
Analyze:
- We use Omni for internal facing dashboards and analytics, Explo for customer facing embedded insights, and Hex for ad-hoc analysis
🔎 Analytics tooling
Explo
Our Engineering team recently carried out a migration to Explo for our Insights product, which allows our customers to get a deeper understanding into their own data—like how much time is being spent on incidents, which users are being paged most, and how diligent teams are in completing post incident flows.
Explo as a tool is purpose-built for embedded analytics, and enables:
- Fast iteration: It’s now a lot faster, and safer, for engineers to create and update charts in our insights product
- Greater customization: More colors, fonts, etc., to bring our embedded charts into our brand styling
- Drill down: Customers can now dig into the data behind the charts, such as individual incidents
Omni
Earlier this year the Data team made the move to Omni analytics, built by some of the early team from Looker, for our internal BI tooling—and we’ve been very impressed with it so far!
We needed a tool that:
- Captured semantic logic (table joins and measures defined in code)
- Provided safe, pre-joined models for self-serve users
- Was able to do ad-hoc joins and more complex calculations for power users
- Was tightly coupled with dbt
Over a ~4 week trial period, it was clear that Omni fit our use case nicely, striking a solid balance between governance and flexibility. It achieves this through its concept of model layers:
- Our dbt models, in BigQuery, are synced directly to Omni every run in their “schema model”, which you can think of as Looker views that are automatically kept in sync
- The “shared model” combines the schema layer with any changes / additions / deletions you make like number formatting, measures, and renaming or deleting columns. You can think of these as being like Looker extends, but with Omni managing the combination of the underlying schema plus your edits in one file
- The “workbook model” allows you to make any edits to the shared model in a dashboard without writing back to the shared model. This essentially treats each dashboard like its own git branch that can still be updated from the shared model (it doesn’t become stale)
The last part is particularly useful - you can create a set of measures, joins, or custom columns that you want to reuse across a single dashboard without affecting the company-wide shared model. Should you want to write back to the shared model, you can cherry pick the changes to write back or just push everything.
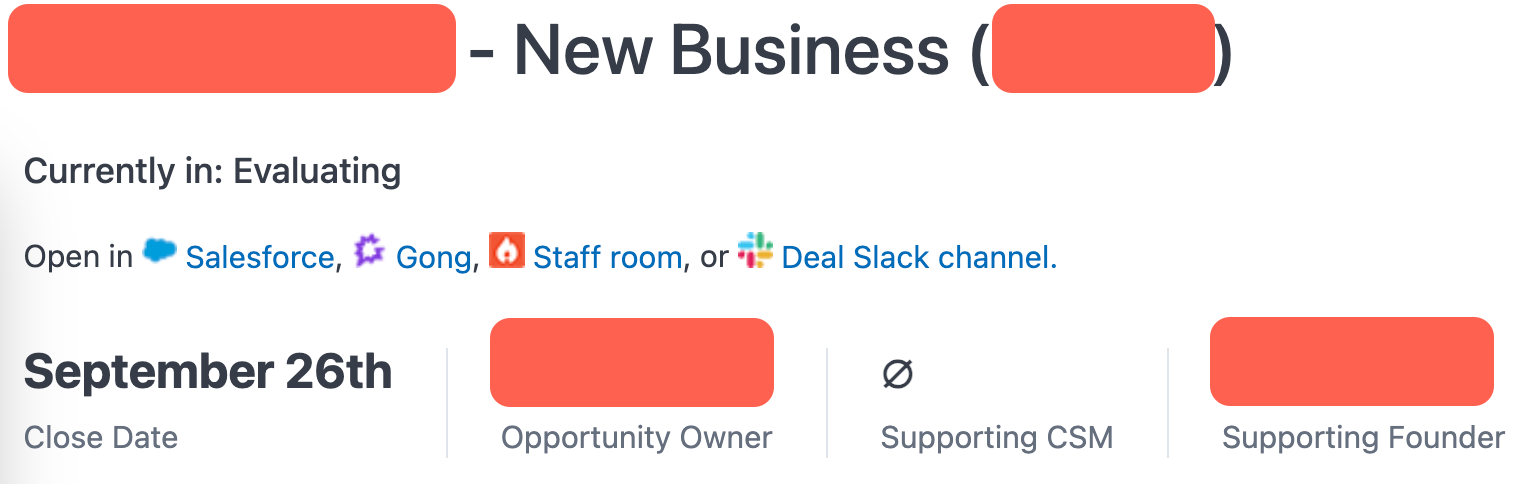
There were a bunch of other features we really liked as well: the ability to write Excel formulas and translate it into SQL, custom markdown visualisations (example below), being able to embed just about anything into a dashboard (e.g. Gong calls), and how easy it was to embed dashboards into Salesforce to bring insights directly to our Commercial users.
Hex
Whilst Omni enables ad-hoc analysis across the company, there are times where we want to be able to step through multiple SQL transformations, or use Python in combination with SQL.
Hex does an excellent job of this—you can think of it as a supercharged Jupyter notebook that makes it really easy to do ad-hoc / deep-dive analyses. We use it extensively as a Data team and it’s a really valuable tool in our stack.
🔧 Our dev setup
We onboarded our first Data Engineer a few months ago, and he’s since made several improvements to our setup that he outlines in a separate blog post.
But something to call out specifically that has been a huge quality of life improvement is how we run dbt locally.
Anyone familiar with dbt knows the pain of editing a model, then having to run everything upstream of it, before being able to test your changes. You can, of course, do a few workarounds:
- Dry runs / limited data runs: Only testing your SQL is valid, or testing your SQL on a subset of data, will speed up runs but you’ll lose the ability to run tests on your whole dataset
- Cloning production data into your dev schema: Essentially doing what SQLMesh does, enabling you to use production data without recreating it. This, however, requires a production
manifest.jsonfile to use forstate, and still takes some time to carry out (plus in BigQuery you can’t set clones to expire) - Compiling the master manifest and using the —defer —state flags: As mentioned above, this still requires checking out master, generating the
manifest.jsonfile, and moving it out of the target folder
The third option is the cleanest, but is a bit of a pain to do whenever you want to do any local dev work. Dry runs / limited data runs are still a good idea in general—but at our size of datasets, running individual models is relatively fast and we can use incremental builds in any outlier cases.
A really nice solution that our Data Engineer implemented was to upload the latest manifest.json from the most recent production run of dbt (when a code change is deployed) to Google Cloud Storage, which we can then pull locally to use for --defer --state.
The Python code to pull the latest manifest is wrapped in a bash script, and this allows us to have some really simple bash aliases to perform any type of --defer based dbt command locally:
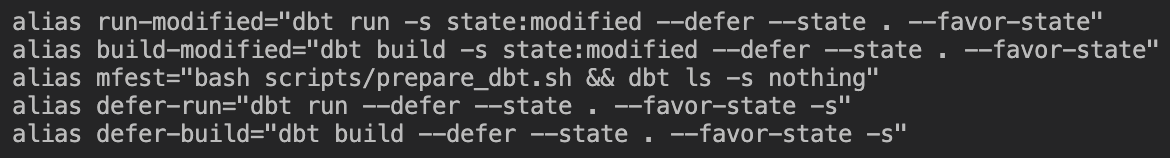
mfest downloads the latest production manifest file, then runs dbt ls -s nothing which does nothing apart from getting dbt to compile the manifest file for the current branch and is faster than dbt compile. The other commands then either:
- Build or run all modified files, deferring to production
- Build or run all models specified after the
-s, deferring to production

📟 Using our own On-call product
We use our own product extensively at incident.io, and the Data team is no exception.
If the data pipeline fails, it’s an incident—and since you’re doing the work anyway to rectify the issue, you might as well track it!
Data incidents will typically fall into one of two categories:
- Actual issues: If something needs fixing then it’s worth keeping a record of what needed fixing (and why) for future reference. Plus, in our product we use incident activity to infer time spent fixing incidents which is extremely valuable as a Data team to quantify the impact of data quality issues
- Transient issues: A.K.A., “Retry it and it normally works”. While it might feel like overkill to declare incidents for these issues, letting data pipeline failures be accepted as the norm without being incident worthy is a dangerous pattern to fall into. If your pipeline is constantly being affected by flaky test failures, then this in itself is an issue worth fixing
Previously, we’d create an incident manually if we were notified by email, via CircleCI, that our data pipeline had a failure. This would capture the first type of incident above, but often the second type would be missed as the first step would be to hit retry on the failing job.
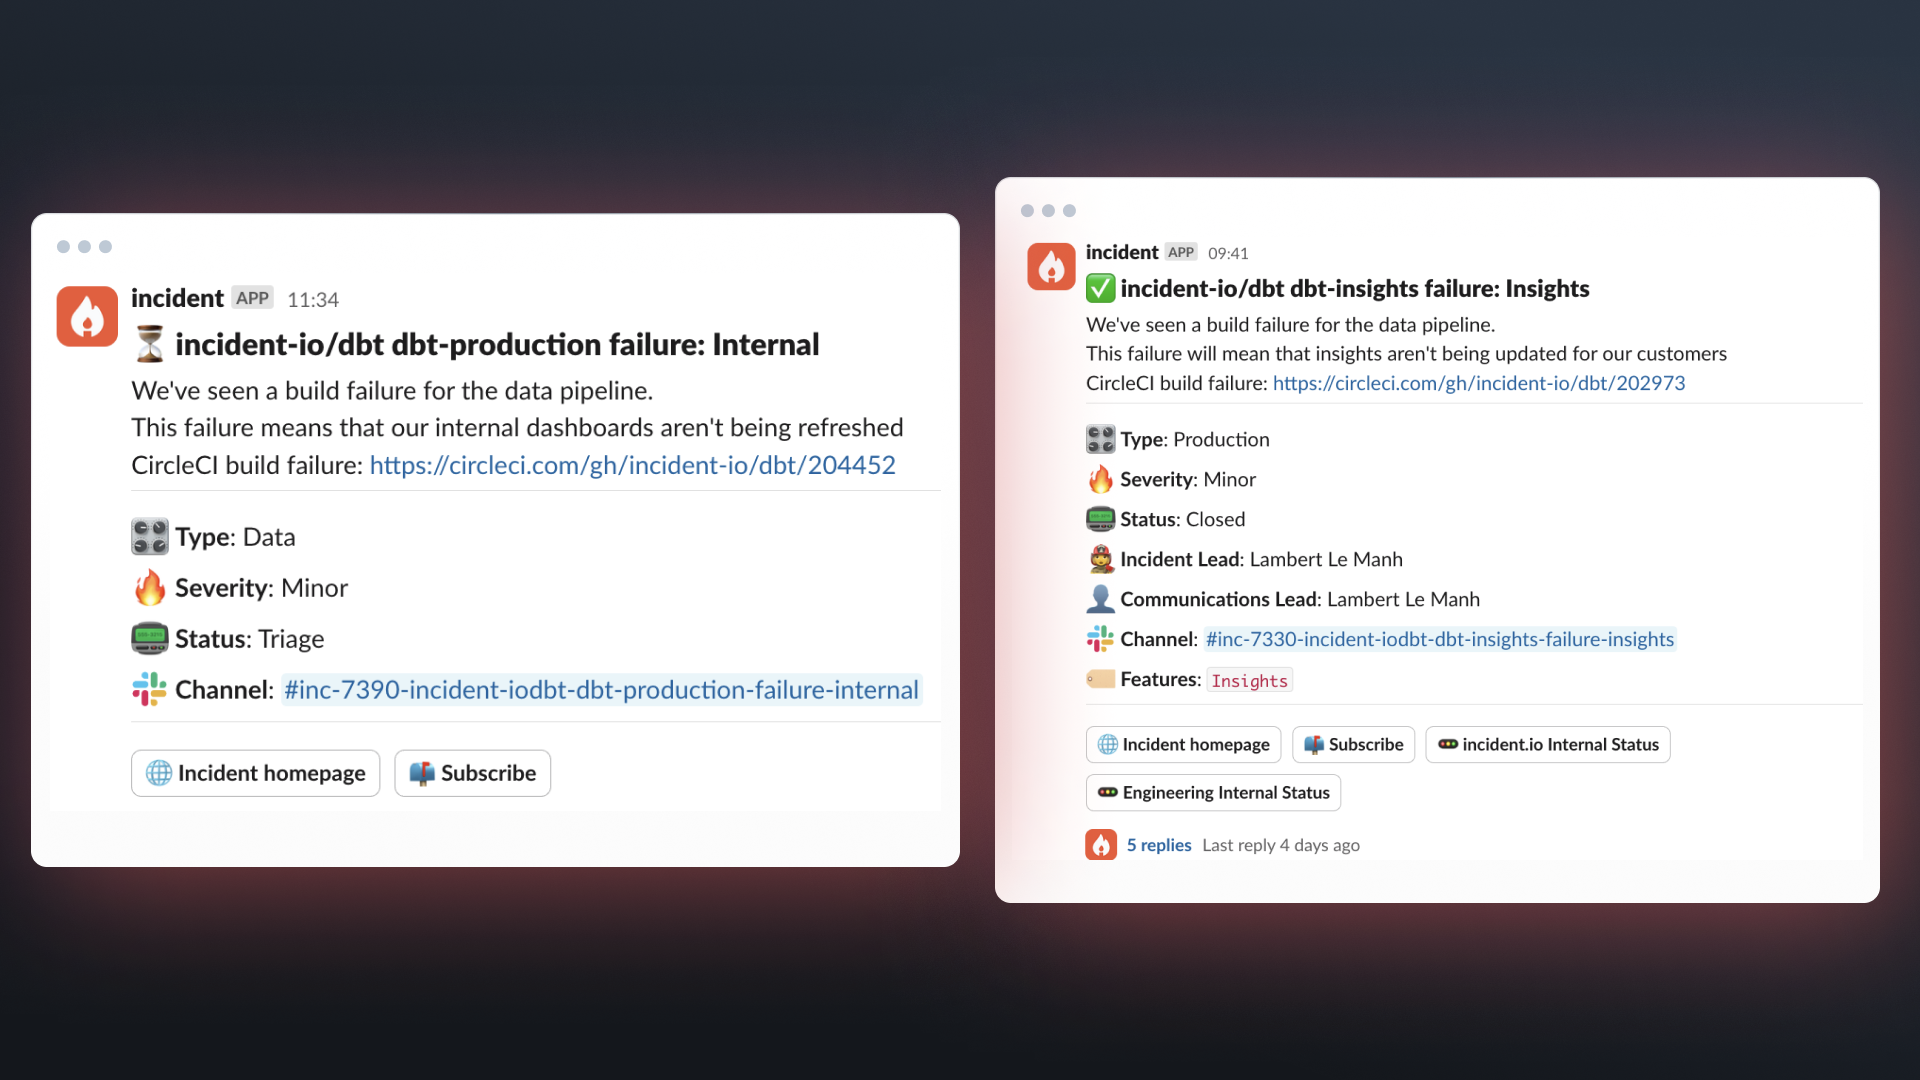
Now, using our On-call product that we launched earlier this year, we can:
- Automatically declare incidents in Slack if a CircleCI job fails
- Page an engineer (via Slack, email, or cell) if it’s the part of our pipeline that’s customer-facing, regardless of what time of day it is
- Page someone in the Data team if it’s the part of our pipeline that’s not customer-facing, but only in working hours
- Use schedules to keep a rota of who is on call in the Data team, and sync this with the
@data-responderSlack group so that anyone who needs help resolving an incident doesn’t need to know who’s on the rota—they just tag the group
✍️ Summary
Quite a lot has changed over the past couple of years, but the core structure of our stack and our dbt repo have scaled well: Fivetran still remains a very effective tool for syncing data to BigQuery (although this is not surprising as an earlier-stage B2B company), and we’ve not drastically changed how our dbt repo is set up.
But the tools and vendors available in the data space are always changing—and data stacks rarely stay static as a result. There’s a fine (and difficult) balance to strike between focusing on executing with the tools you have at your disposal already, and spending the time and money bringing new ones in.
We’ll continue to adapt our stack as new tools become available and hit new challenges as we scale—but hopefully this time it won’t be 2 years until we next write about it!

Jack Colsey
Head of Data
See related articles

Pager fatigue: Making the invisible work visible
We developed The Fatigue Score to make sure our On-call responders’ efforts are visible. Here's how we did it, and how you can too.
 Matilda Hultgren
April 25, 2025

Going beyond MTTx and measuring “good” incident management
What does "good" incident management look like? MTTx metrics track speed, but speed alone doesn’t mean success. So, we decided to analyze 100,000+ incident from companies of all sizes to identify a set of new benchmarks for every stage of the incident lifecycle.
 Chris Evans
March 25, 2025

How we handle sensitive data in BigQuery
We take handling sensitive customer data seriously. This blog explains how we manage PII and confidential data in BigQuery through default masking, automated tagging, and strict access controls.
 Lambert Le Manh
November 14, 2024
So good, you’ll break things on purpose
Ready for modern incident management? Book a call with one of our experts today.
We’d love to talk to you about
- All-in-one incident management
- Our unmatched speed of deployment
- Why we’re loved by users and easily adopted
- How we work for the whole organization


