Updating our data stack
August 24, 2022 — 16 min read

It’s been over 6 months since Lawrence’s excellent blog post on our data stack here at incident.io, and we thought it was about time for an update. This post runs through the tweaks we’ve made to our setup over the past 2 months and challenges we’ve found as we’ve scaled from a company of 10 people to 30, now with a 2 person data team (soon to be 3 - we’re hiring)!
To summarise, we’ve:
- Migrated Fivetran to a separate BigQuery project to deal with concurrent query limits
- Set up CircleCI to run the dbt pipeline sequentially rather than in parallel, in case the same pipeline is triggered twice (e.g. a scheduled run, and a manual run) and the runs would otherwise overlap
- Moved from using the
GOOGLEFINANCEfunction in Google Sheets to using an API feed for our GBP:USD FX rates - Materialised all of our dbt models as tables, instead of views, to optimise for query performance in Metabase
- Introduced intermediate tables into our dbt pipeline, that sit in-between our staging tables and our reporting - dimension and fact - tables
- Used the SQLFluff VSCode extension to automatically format our SQL code, and detect errors as we type
- Introduced a new folder structure in Metabase that differentiates one-off analyses from those used by stakeholders across the company
A recap on our setup
Our data stack can be broadly split into 3 sections:
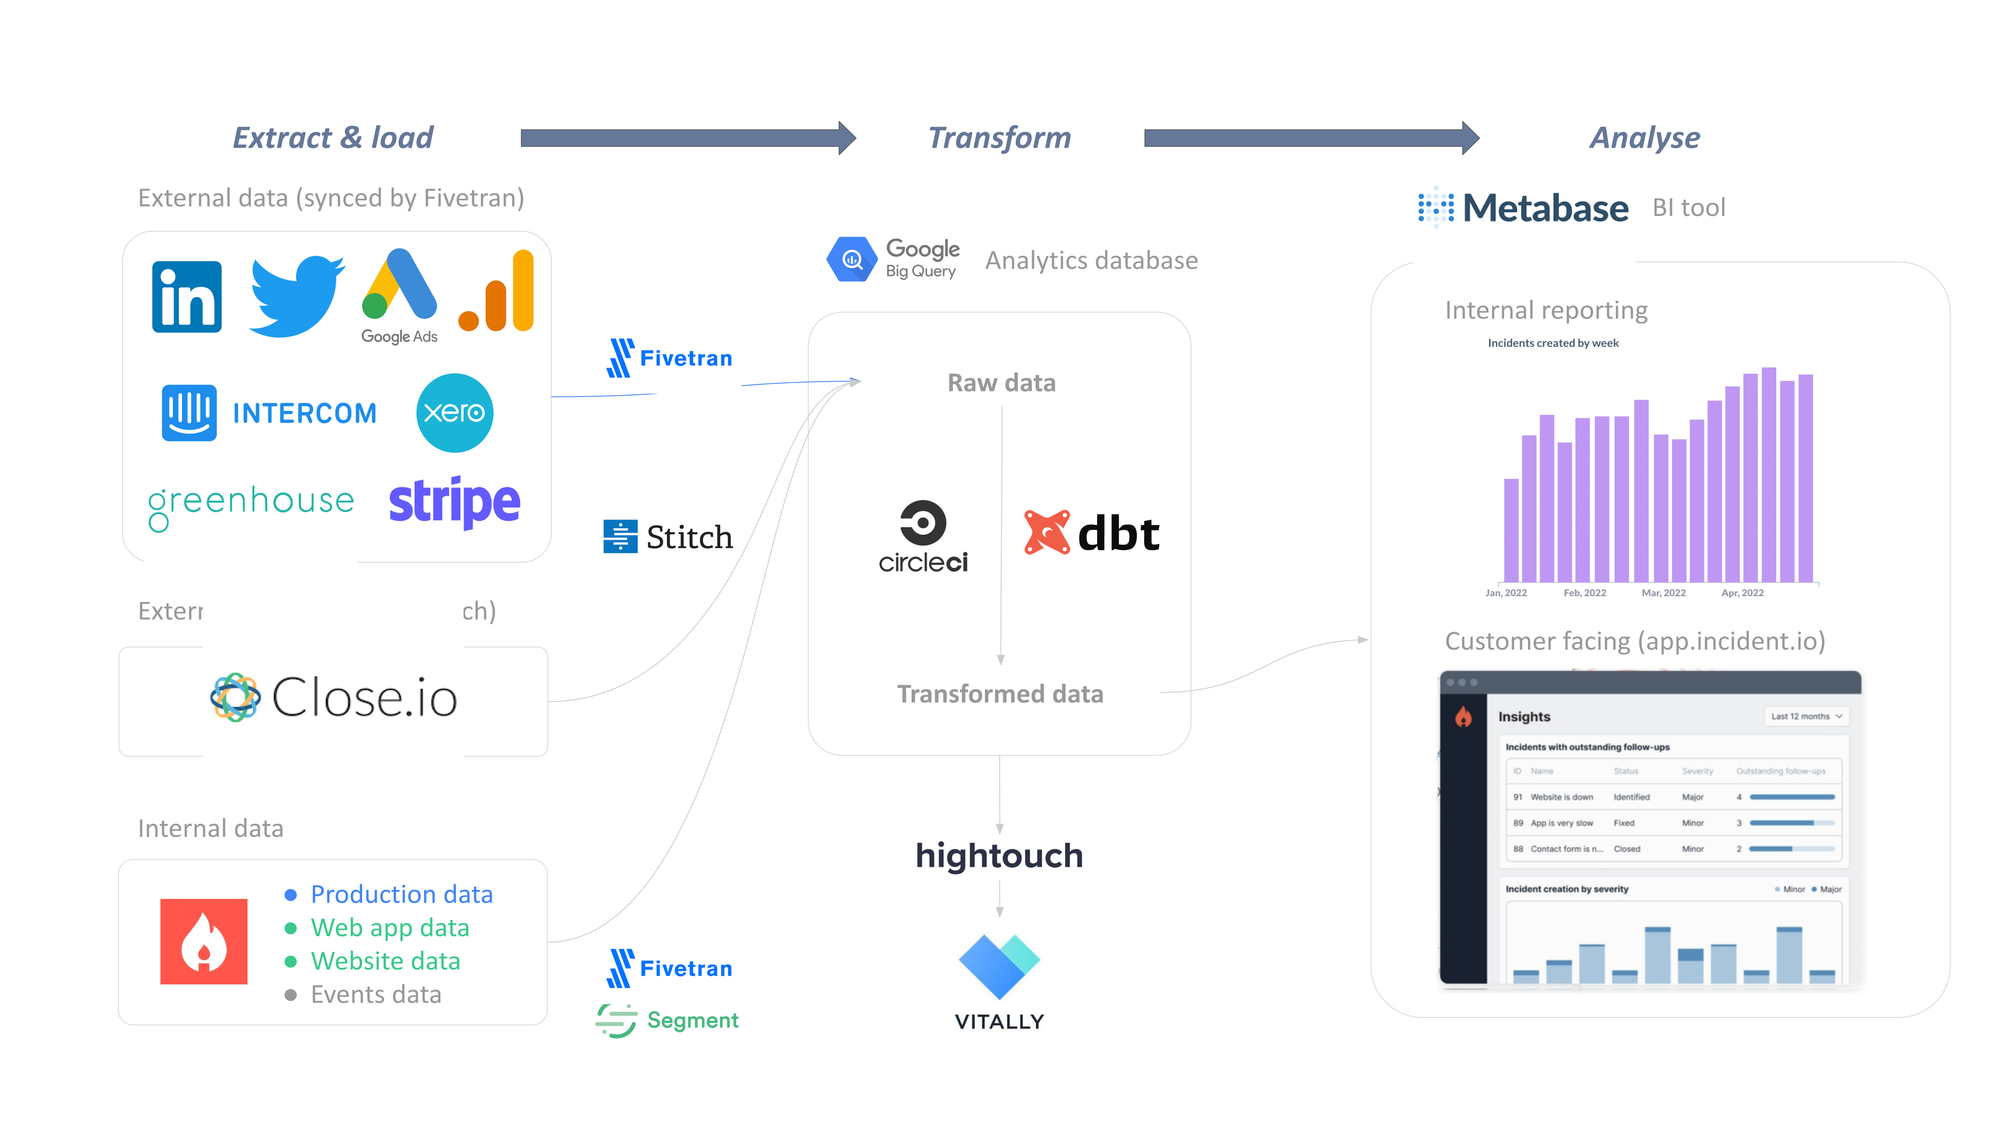
Extract & load:
- We use Stitch to sync data from Close, our CRM tool
- We use Segment to sync data from website activity and our web app (app.incident.io)
- Our events data is written directly into BigQuery
- All of our other external data sources, and our production data from our PostgreSQL database, are synced via Fivetran
Transform:
- We’re big fans of dbt here, and use it for all of our SQL transformations and data model documentation & testing
- We use CircleCI for running CI/CD (testing that code changes work before deploying, and deploying any changes), and generally running our dbt SQL code on a regular basis
- We use hightouch to sync transformed data from BigQuery back into Vitally, our customer success tool - for metrics relating to customer health
Analyse:
- We use Metabase for all of our internal analytics, as well as in our customer facing insights part of our web app
- The excellent dbt-metabase Python package means that any changes to our data models in dbt are automatically reflected in Metabase whenever we merge a code change (via CircleCI). It can also set data types in Metabase from a dbt yml file, and even infers foreign key relationships whenever a
relationshipstest is specified.
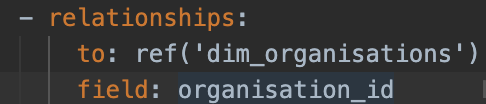
In our dbt yml file
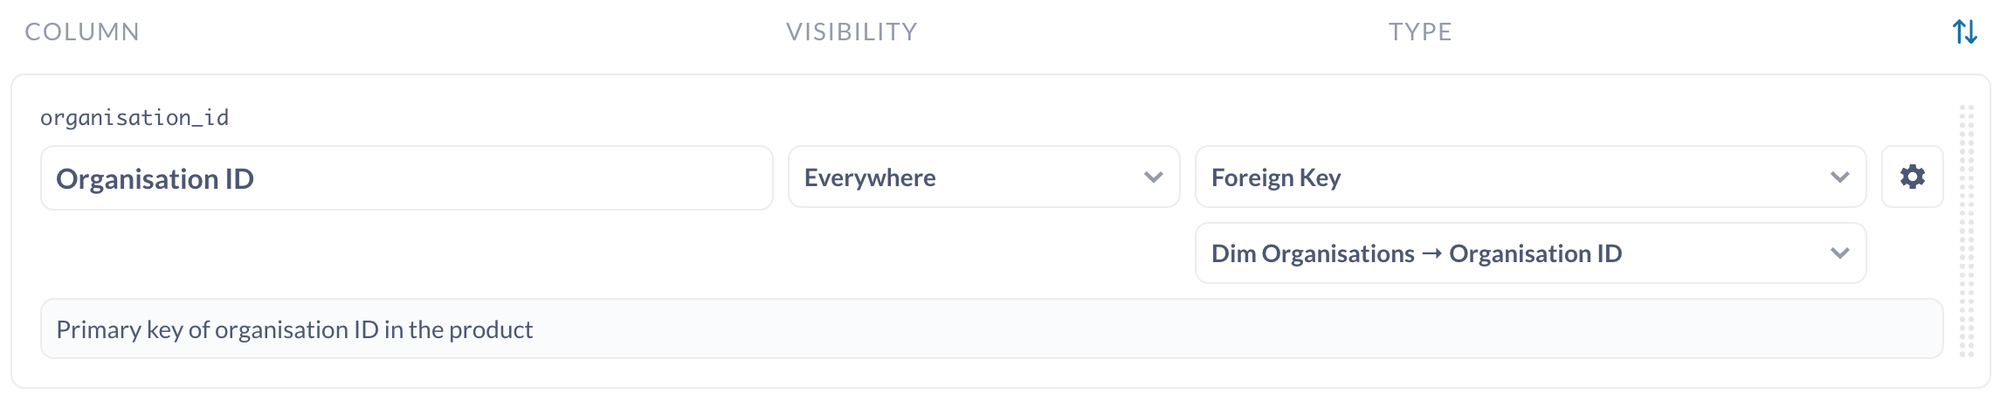
The column in Metabase’s data model
We broadly stick with the ‘ELT’ approach to getting data into Google BigQuery, our analytics database, by using a mixture of extract & load tools to ingest raw data - then let dbt do the heavy lifting of transforming everything via SQL.
There are a few exceptions:
- For LinkedIn, Twitter, and Intercom we use Fivetran’s dbt packages for social media reporting and Intercom. These do some very helpful standardised transformations that we’d have to create ourselves otherwise
- For Google Analytics (web traffic data), Google doesn’t let you access the source data via Fivetran, so instead we use custom reports to bring in transformed data to BigQuery
What we’ve been updating
Extract & Load
Fivetran migration
At the end of June, we were starting to see some of our dbt test jobs fail in CircleCI without any clear error message. Each time, a single test (a different one each time) would time out after 10 minutes - despite each test not taking >5 seconds to run in BigQuery itself.
On inspecting our BigQuery monitoring page, it turned out that >100 concurrent interactive queries were running at the same time in our main BigQuery project, which is over the maximum quota of 100.
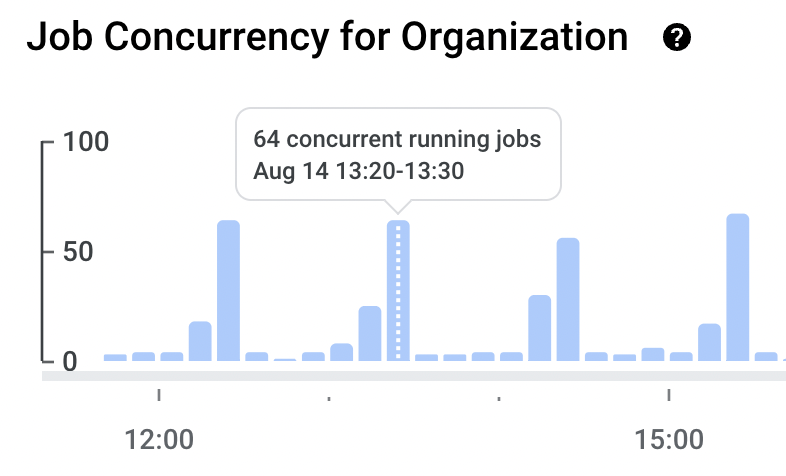
Fivetran syncs, hourly CircleCI runs of our master dbt branch, Metabase, and any ad-hoc queries run by us were all competing for resource in the same BigQuery project - not ideal!
We had a couple of options:
- Change CircleCI to use
batchinstead ofinteractivequeries, which would prevent concurrency issues but the code (and a result any code changes) would be slower to run - Move Fivetran to a separate BigQuery project
We went for option 2, as in any case, it’s good practice to have your source data stored separately from your analytics data - both for keeping the BigQuery projects from becoming overloaded with several schemas (datasets) and controlling who has access to raw data.
Fortunately, Fivetran is very easy to get set up for all of the different connectors, and this took us less than a day’s worth of work in total to get everything shifted across.
We’ll probably encounter some concurrency issues when we scale even further with more analysts, but for the time being this setup will keep us running nicely for the next 3-6 months.
Run concurrency
When code changes are merged, CircleCI will run our dbt pipeline from scratch. We also run the code every hour on a schedule. At the moment, our dbt pipeline takes ~5 minutes to run and test end to end (perks of being early stage B2B), so infrequently we’d have cases where a code change and a schedules run overlapped.
This presented some weird cases where 2 pipelines, both creating and dropping the same set of tables in the same dbt_production schema, were clashing.
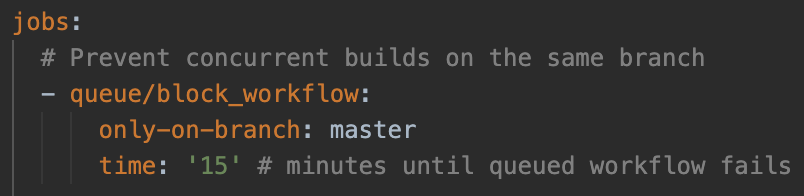
The fix for this was fairly straightforward, we used the queue workflow orb developed by an engineer at CircleCI. This checks for concurrent workflows (our “deploy” workflow is essentially our dbt pipeline) running on the same branch, and makes a workflow wait for the prior one to finish before running.
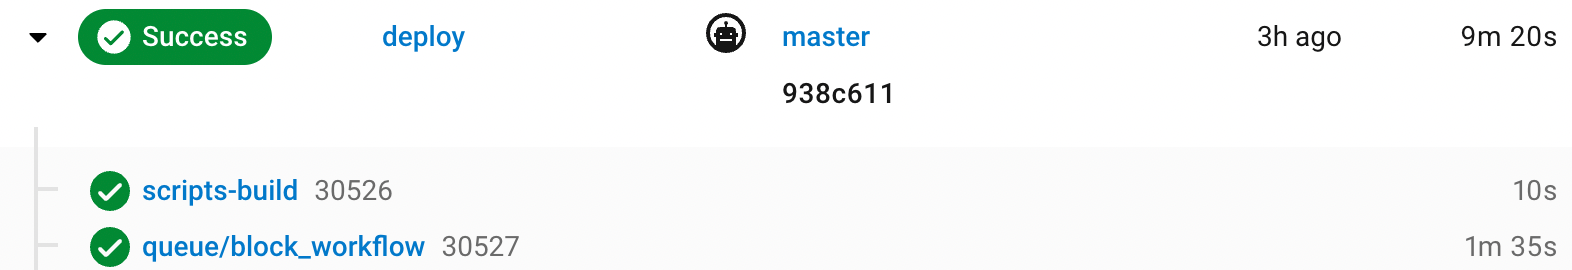
Below is an example of our scheduled dbt pipeline (workflow) waiting for a prior run to finish before running the rest of our code.
As a side note, we’re going to look into testing dbt cloud later in the year as there are a lot of nice features that (unsurprisingly) tightly integrate with dbt itself.
FX rates
A lot of our Stripe subscriptions are denominated in GBP, but we report figures such as ARR in USD.
Previously, we had a simple Google sheet set up using the GOOGLEFINANCE function which pulled daily GBP:USD FX rates, which we could then linked into BigQuery and used in a dbt model.
However, there are some known issues with this function - primarily that it’s not reliable and frequently returns #N/A.
We needed a reliable set of FX rates that populates daily. So we solved this in 4 steps:
- Take a historical list of GBP:USD FX rates from
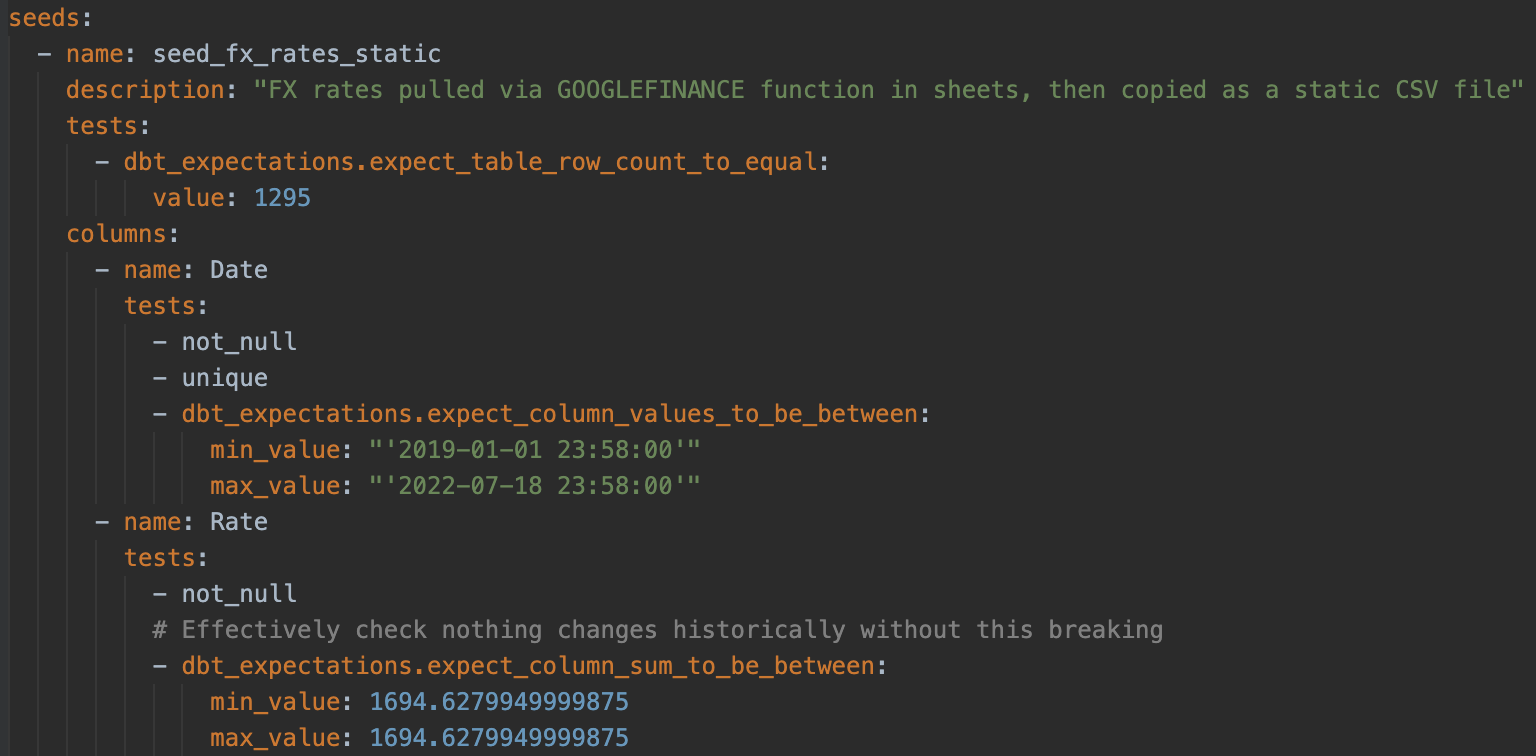
GOOGLEFINANCEand version control them in a CSV file, then load these into BigQuery using a dbt seed. A benefit here was being able to easily write tests to make sure this data never changed in terms of row count or values
- Write a simple Python script to pull daily GBP:USD FX rates from the APILayer exchange rates API, write to a CSV file, then load this into BigQuery as a drop & replace. We can query up to 365 days’ worth of data from this API, so the only manual effort needed is, annually, to add a year’s worth of data to the seed file from step 1 and update the extraction dates
- Stitch
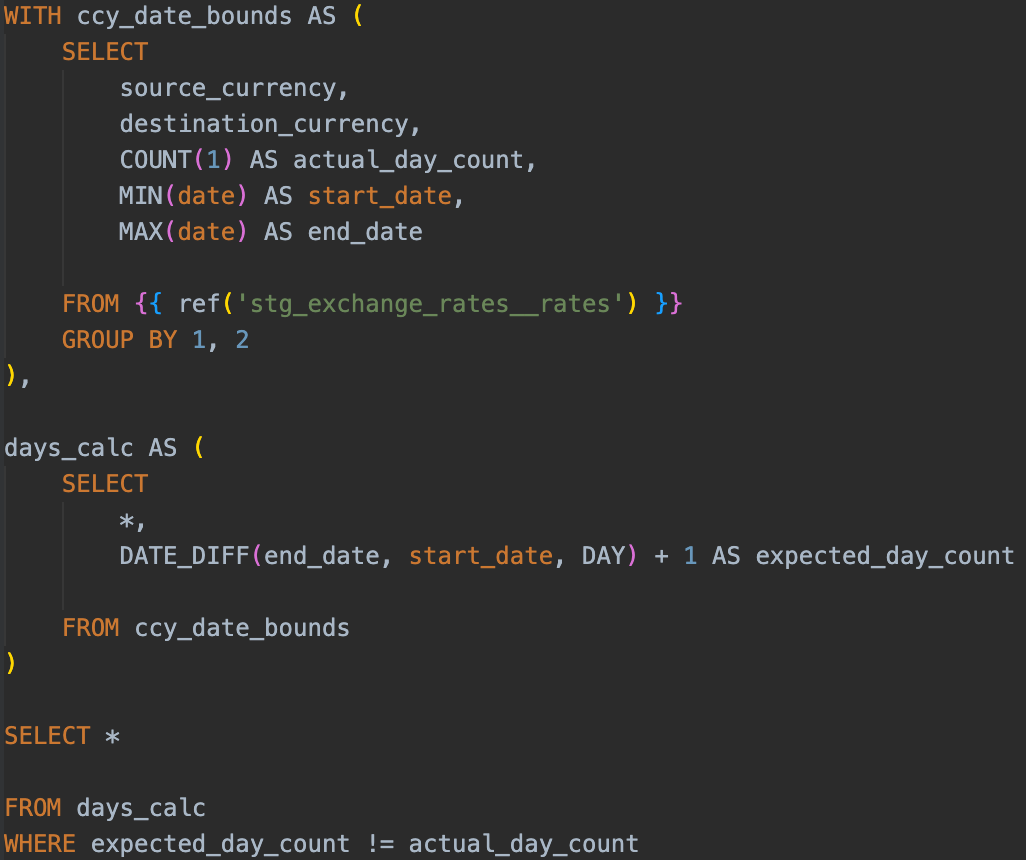
1and2together via aUNION ALL - Write dbt tests to ensure that every combination of date and currency pair is unique, that every currency pair has data up until the current date, and that for every currency pair the dates are gapless - i.e. if there are 99 days between our earliest and latest GBP:USD rates data then there should be 100 rows of data
Transform
Materialisation
A fairly straightforward change, but we changed all of our models to by default materialise as tables instead of views. This optimises performance downstream in Metabase when running queries - at the expense of a slightly longer runtime in our pipeline (this has little to no effect when we’re at our current size!).
There was a really interesting post from dbt labs themselves on how they dynamically materialise tables depending on what environment their code was running in. In short, they materialise some models as views when running in development and staging (for speed of running code), but as tables when running in production (for downstream query speed).
Staging and intermediate tables
Previously, every table in our dbt codebase was either a staging (stg) table, a dimension (dim) table, or a fact (fct) table.
One struggle we had was separating which staging tables were just a rename & recast operation - selecting from a single source, and which were more complex bits of SQL that were joining different models together.
So, in line with dbt’s style guide, we introduced intermediate (int) models into our codebase. However, we’ve made some design choices that can be seen below with a snapshot from our DAG:
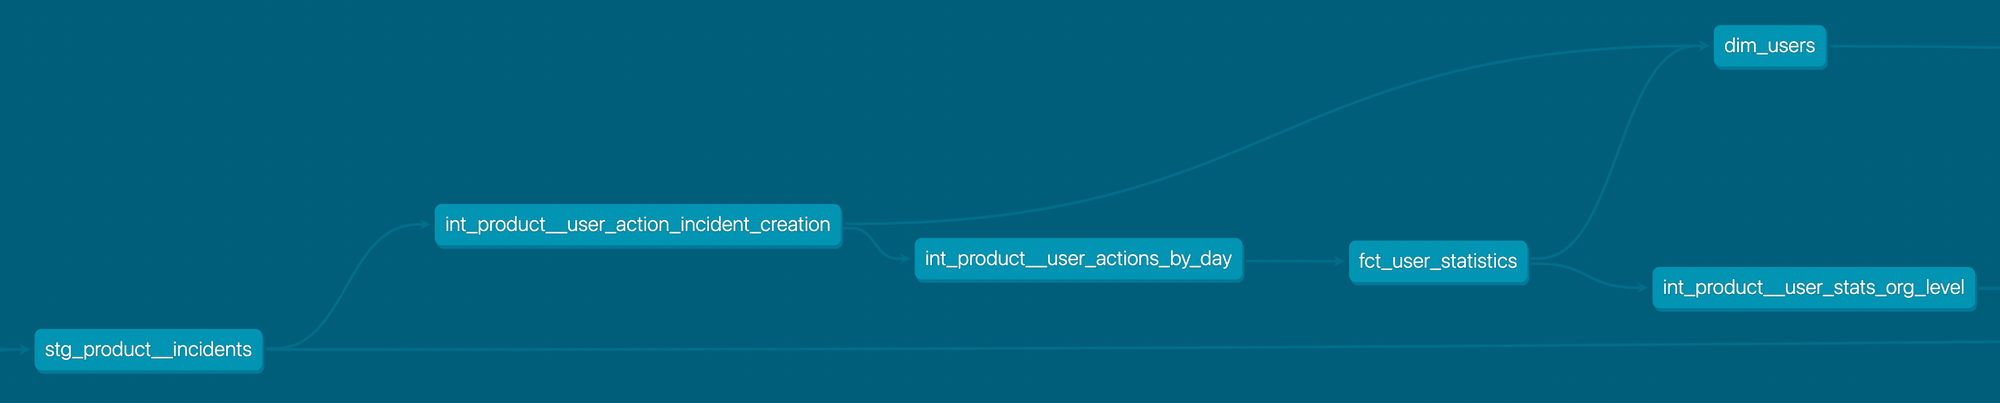
int_product__user_action_incident_creation defines the logic for when a user declares a “real” (not test or tutorial) incident in one place and reuses it in 2 separate places without having to define it twice:
- The data is pulled into
dim_userson a timestamp level (e.g.first_incident_created_at) - The data is also rolled up in
int_product__user_actions_by_dayat a daily level (e.g.number_incidents_created)
Given our pattern of enforcing fct_user_statistics to run before dim_users, so that the latter can pull the latest row’s worth of statistics data (e.g. number_incidents_created_to_date), if we didn’t have this intermediate table then in dim_users we’d have to either:
- Declare the same logic for “incident created” that
fct_user_statisticsuses as a CTE withindim_usersto get timestamps forfirst_incident_created_at- which is an antipattern because we’re defining the same logic in 2 places, or - Lose the timestamp granularity and only be able to show
first_incident_created_date, which seems a bit arbitrary to lose granularity given how simple it is to fix
int_product__user_actions_by_day is then simply pulled into fct_user_statistics by a LEFT JOIN as it’s already on a date & user_id level. There are other int_product__user_action_* tables that go into this rollup table that aren’t shown in the diagram.
int_product__user_stats_org_level gives us an easy way of rolling up daily user metrics to a date and organisation_id level, which is pulled into fct_organisation_statistics as a simple LEFT JOIN.
Linter
It’s easier to review someone else’s code when you both format your code in a similar way. It’s also easier to write code when formatting is automatically taken care of for you.
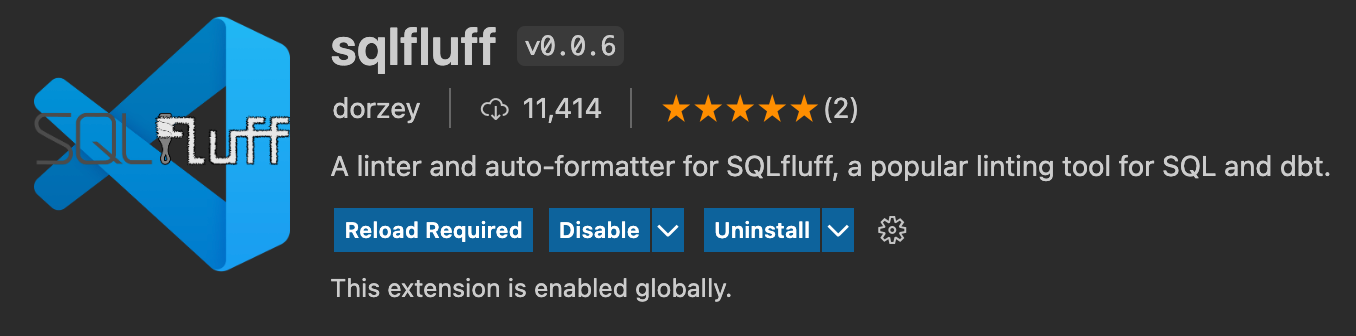
Enter sqlfluff, a Python package that automatically formats your SQL code for you and is even compatible with dbt’s Jinja syntax!
Both of us currently develop using VSCode, and there’s a really nice extension that actually runs sqlfluff as you type and highlights errors - and even autoformats your code with a keyboard shortcut.
We use this in conjunction with a version controlled .sqlfluff file that lets you configure sqlfluff rules and ignore rules you don’t like:
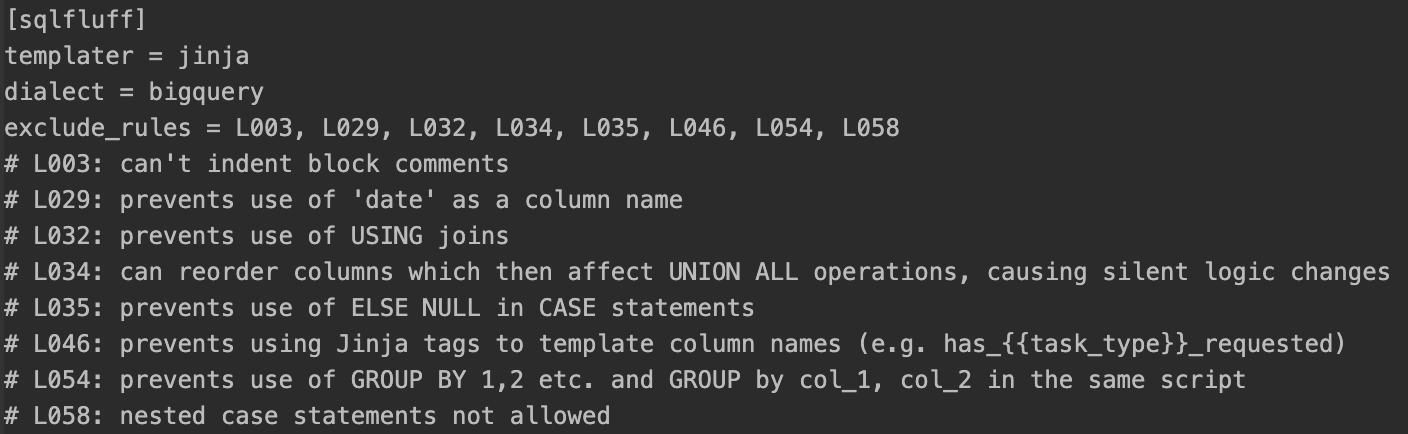
There are several benefits to this setup:
- Enforces standards with indentation, table and column aliasing, and capitalisation
- Very little effort, and the error highlights encourage you to fix as you go along
- Single configuration that everyone uses
Analyse
The only major changes to our Metabase setup have come from our folder structure. Beforehand, we had an “Our Analytics” folder (the default place you’d save to) and a scattering of folders for the different areas of incident (Product, Sales etc.).
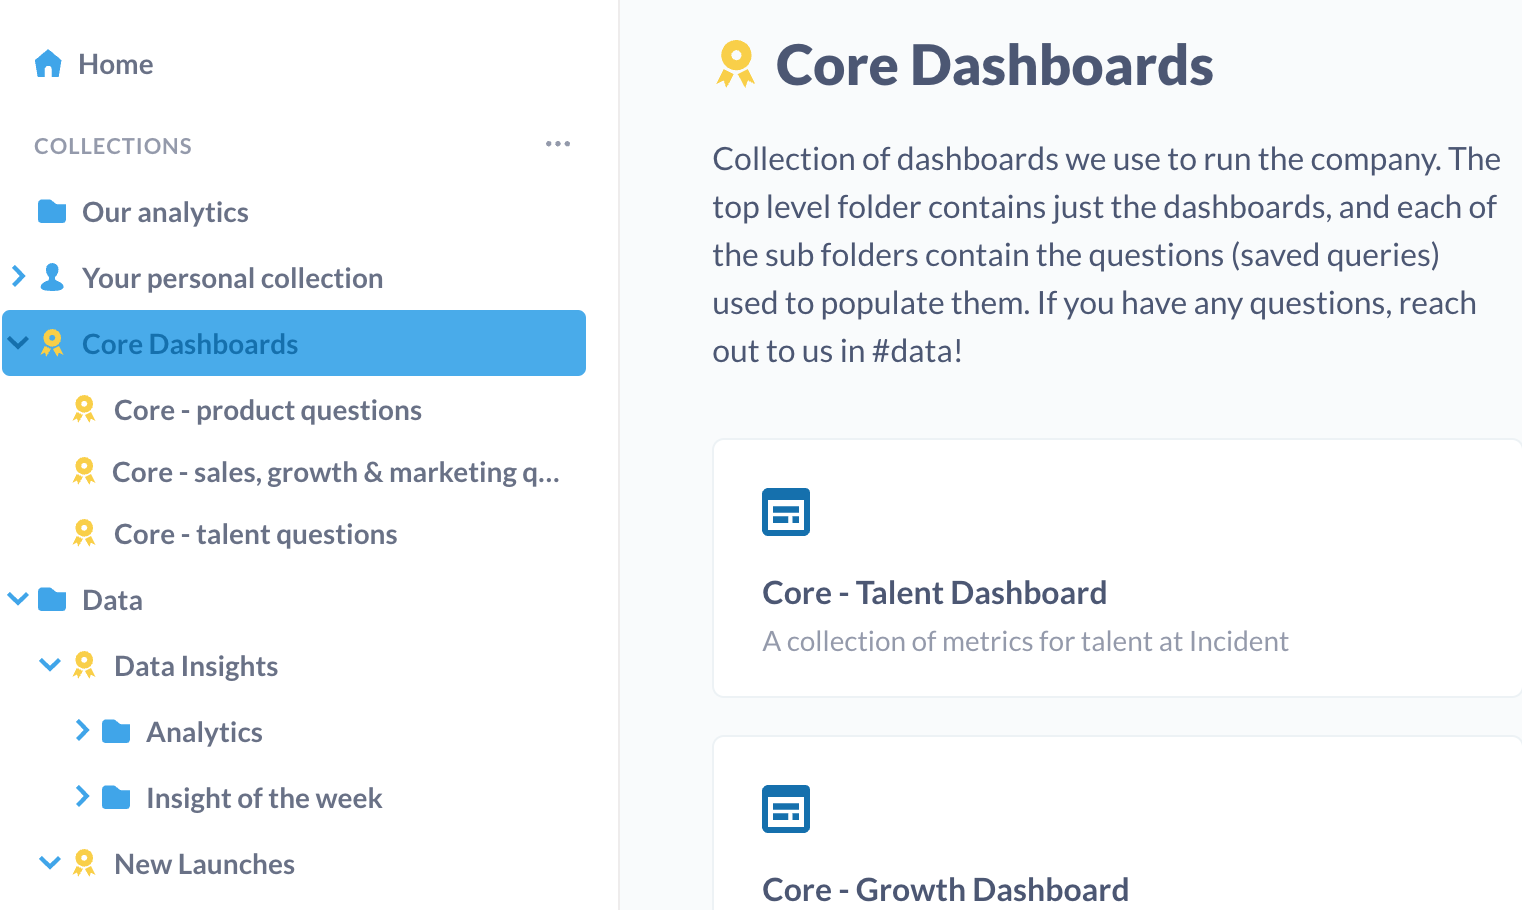
We launched a couple of new folder structures which resulted in 4 main areas of Metabase:
- “Our Analytics” - save anything here, treat it like a sandbox
- Area folders (Product, Sales etc.) - anything reusable that’s not a core dashboard we run the company with, or specific to a project or product launch
- Data - an area for the data team to save anything relating to deep dive analyses, and dashboards used to monitor any new launches
- Core Dashboards - a locked down area containing dashboards used to run the company with
The addition of the 2 new areas has made it simple to figure out where you need to go to look at how any of our new product launches are going, or if we’re running a deep dive analysis where we can save all of our charts in a one-off folder.
It also optimises for users who want to use Metabase as ‘read only’, as the core dashboards folder is basically the one-stop shop for everything we use to run the company with.
Importantly, it also doesn’t discourage anyone in incident.io from getting hands-on with data and saving their own questions and dashboards somewhere. There’s a delicate balance to strike between having “data approved” sections and people feeling like there’s a high barrier for what goes into Metabase.
A really nice perk of Metabase is that you can save a chart or a table in one place (as a question) and reuse it across several dashboards. So a question sat in our “Core - product questions” folder could appear in both our key metrics dashboard and our growth dashboard, and edits made to it are reflected in both places.
What’s next
We’ve spent a fair amount of time over the past couple of months building out the core data models we’ll need to answer most of our questions in a quick and repeatable way. We’ve also made sure that our data pipeline is robust and well tested, so now our work more recently has shifted towards focusing very heavily on the analytics side of things!
From a data stack perspective, there are still a couple of things we’d like to look at in the coming months:
- How we can use dbt severity levels on tests to differentiate between
error(get this fixed now) andwarn(fix at some point this week), and get our CI/CD process set up to sendwarnmessages to a separate slack channel - currently we’re only notified oferrormessages via CircleCI, and spotwarnmessages when we test locally - Using dbt’s
state:modified+selector to only run CI checks for modified files and downstream, rather than our whole pipeline. This is a very minor point given how quick our pipeline runs in general, but it’s a relatively easy change to put in for probably quite a good performance gain
We hope you enjoyed reading through what we’ve been up to in the world of data! If you’d like to join us, we’re hiring into our data team (and a bunch of other roles too).

Jack Colsey
Head of Data
See related articles

Don't add a read replica until you've read this
Our learnings from implementing a product-wide read replica migrations, including some useful patterns for routing queries to replica and primary
 Johanna Larsson
July 21, 2026

We rebuilt our post-mortems from the ground up
Today we're launching our new post-mortems experience, and I want to walk you through what we've done and why.
 Pete Hamilton
March 17, 2026

Bloom filters: the niche trick behind a 16× faster API
This post is a deep dive into how we improved the P95 latency of an API endpoint from 5s to 0.3s using a niche little computer science trick called a bloom filter.
 Mike Fisher
November 14, 2025
So good, you’ll break things on purpose
Ready for modern incident management? Book a call with one of our experts today.
We’d love to talk to you about
- All-in-one incident management
- Our unmatched speed of deployment
- Why we’re loved by users and easily adopted
- How we work for the whole organization


