Optimizing LLM prompts for low latency


Making API calls to LLM prompts – whether that is to a provider like OpenAI and Anthropic, or into your own self-hosted models – is at the heart of AI product experiences. It’s also often the slowest and most expensive part of serving an AI interaction.
In a world where most AI experiences are slow, one of the best ways to stand out is focusing on latency, making your product feel snappy.
There are UX strategies that can disguise or repackage LLM latency to make it feel better, and architectures that can significantly reduce it (see "Break chatbot speed limits with speculative tool calls"). For example, you could stream responses or have a model share "chain of thought" as it progresses.
Fundamentally, though, you’ll be limited by how fast your LLM can give you a response.
Thankfully, you can optimise the hell out of that. At incident.io, we recently made a part of our Investigations agent 4x faster by tuning the prompt, without changing its behaviour. This post shows you how we did it, and how you can apply the same techniques to your own LLM-powered features.
Understanding LLM performance bottlenecks
With LLMs, output tokens cost more (~4x) than input tokens. This is true both for the latency you experience and the money you pay providers. That pricing structure isn't arbitrary – it reflects the actual computational costs involved in running these models.
Why? It comes down to how transformer architectures process information. When your prompt goes in, all input tokens are loaded into the model in parallel. Modern accelerators like GPUs and TPUs are designed to handle this kind of parallel processing efficiently, often in a single forward pass.
Output generation is completely different, as the model generates each token sequentially, with each new token depending on all previously generated tokens. Every output token requires a separate forward pass through the model, which creates a fundamental bottleneck that can't be parallelised away.
The practical impact is that the time to generate a response scales roughly linearly with the number of output tokens. Want a response twice as long? Expect to wait about twice as long. In some cases with very long outputs, it gets even worse as the growing context window introduces additional overhead.
Thankfully, this means if you care about either cost of processing or latency, then output tokens are where you should focus your efforts. You can get really significant improvements by adopting more terse output formats, as we’ll see next.
Case study: Planning Grafana dashboards for an incident
When incidents happen, every second counts. At incident.io, we've built an incident Investigations agent that helps responders get up to speed quickly by automatically selecting relevant Grafana dashboards based on the specific alert that triggered the incident.
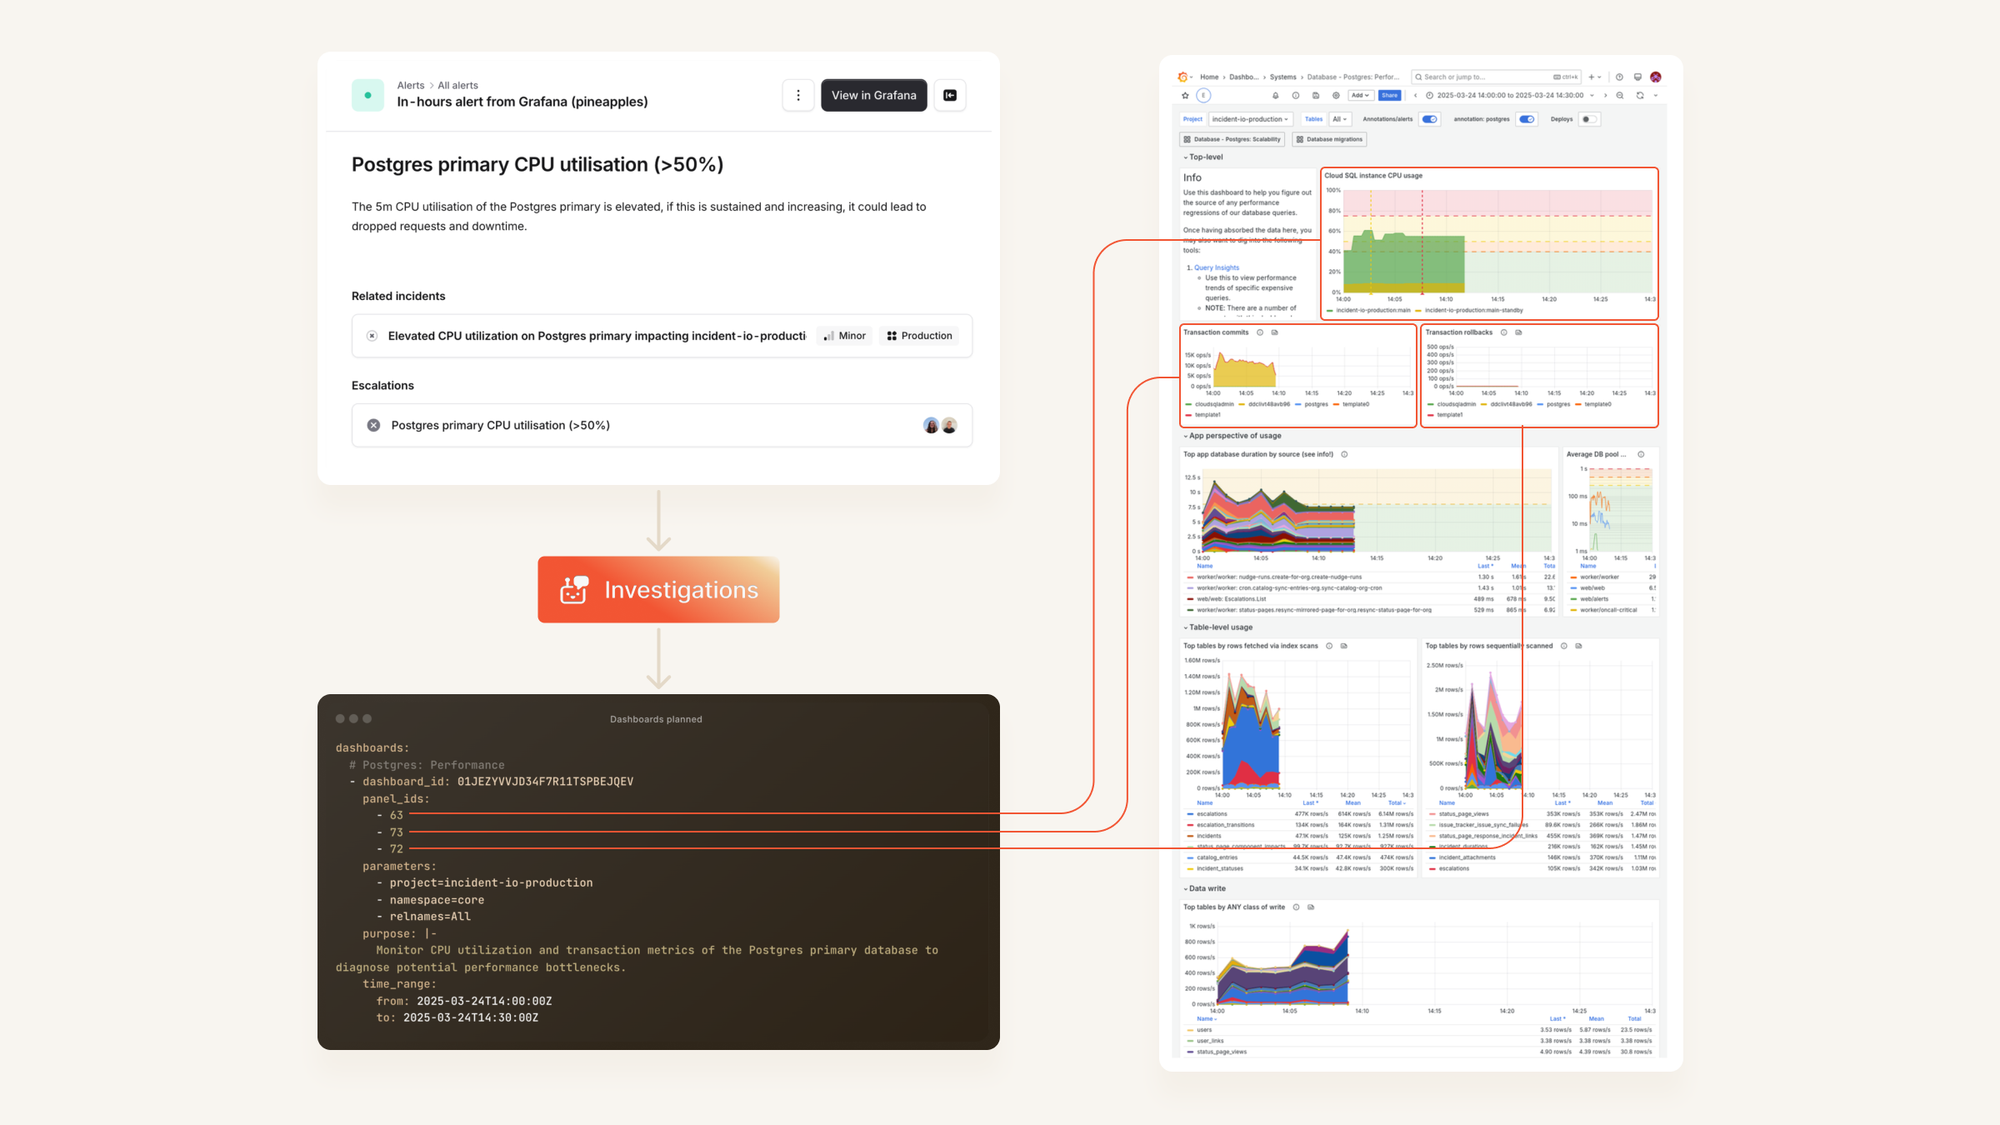
When an incident is declared, our system analyses the incoming alert and plans which Grafana dashboards to examine. For each dashboard, we need to determine the right template parameters, specific panels to focus on, and appropriate time ranges. This helps responders check useful information before they even arrive on the scene.
For example, if we receive a "Postgres primary CPU utilisation (>50%)" alert at 2:13pm, we want to query our "Postgres: Performance" dashboard showing data between 2:00-2:30pm, with a focus on transaction commits and rollbacks panels.
Here’s a diagram of how this alert is passed to our Investigations system, which leverages LLMs to plan which dashboards to check, pulling screenshots from Grafana for analysis:
Driving down latency
Initially, our prompt:
- Took around 11 seconds to respond
- Usually output 300-400 tokens
- Required processing >15,000 input tokens, including all our knowledge about the dashboards in Grafana
This wasn’t great, so we tried a few tweaks to see what was possible.
Originally: JSON with all the reasoning (11s)
Like many engineering teams working with LLMs, we default to using JSON for both input and output formats. JSON provides structure, is easily validated with schemas, and integrates well with our Go backend through reflection.
Initially, the prompt that would choose a dashboard would respond like so:
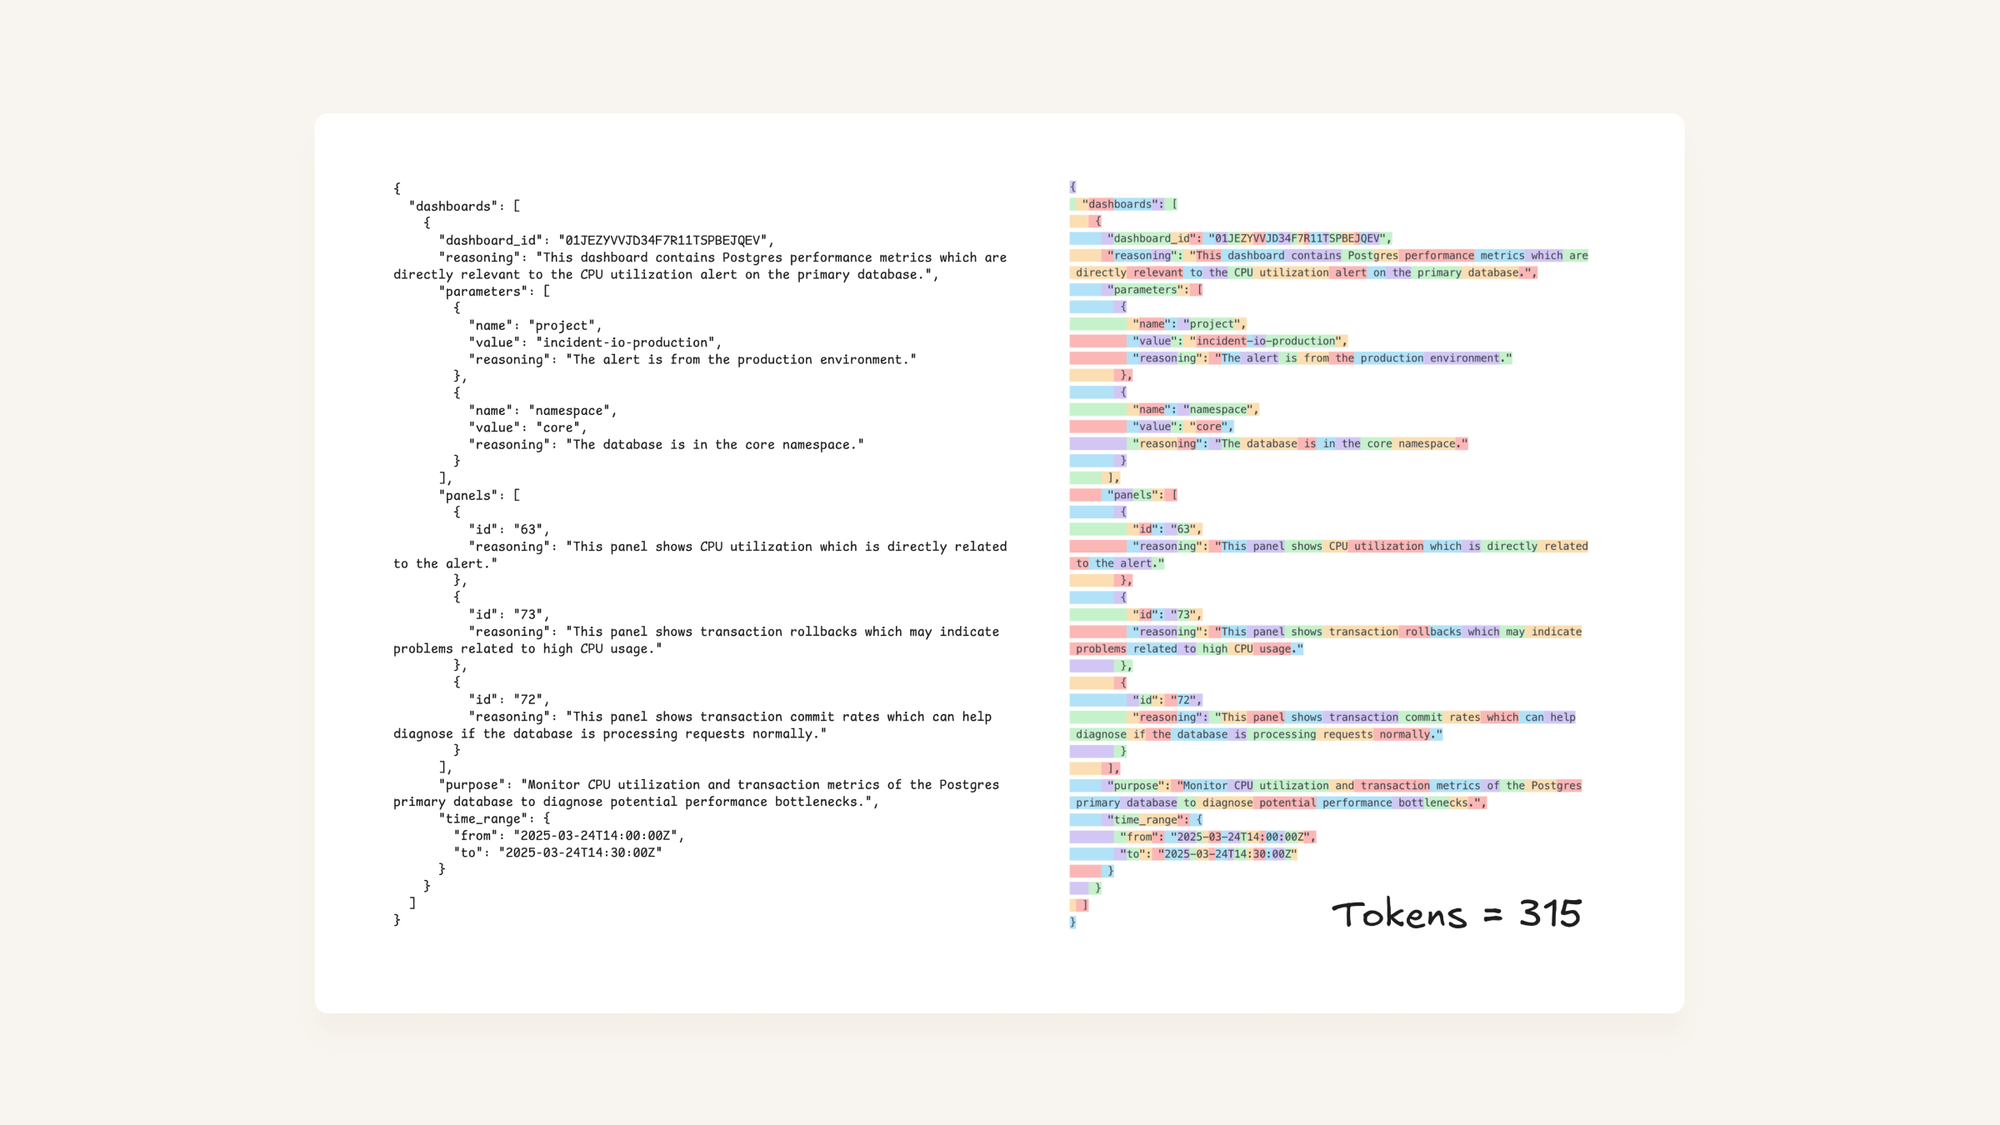
Asking LLMs to provide reasoning is great for debugging and understanding their choices, but can end up being expensive. As we’ve explained above, output tokens have the most significant impact on prompt latency, so the first thing to do was try dropping the reasoning fields.
This reduced output tokens from 315 to 170:
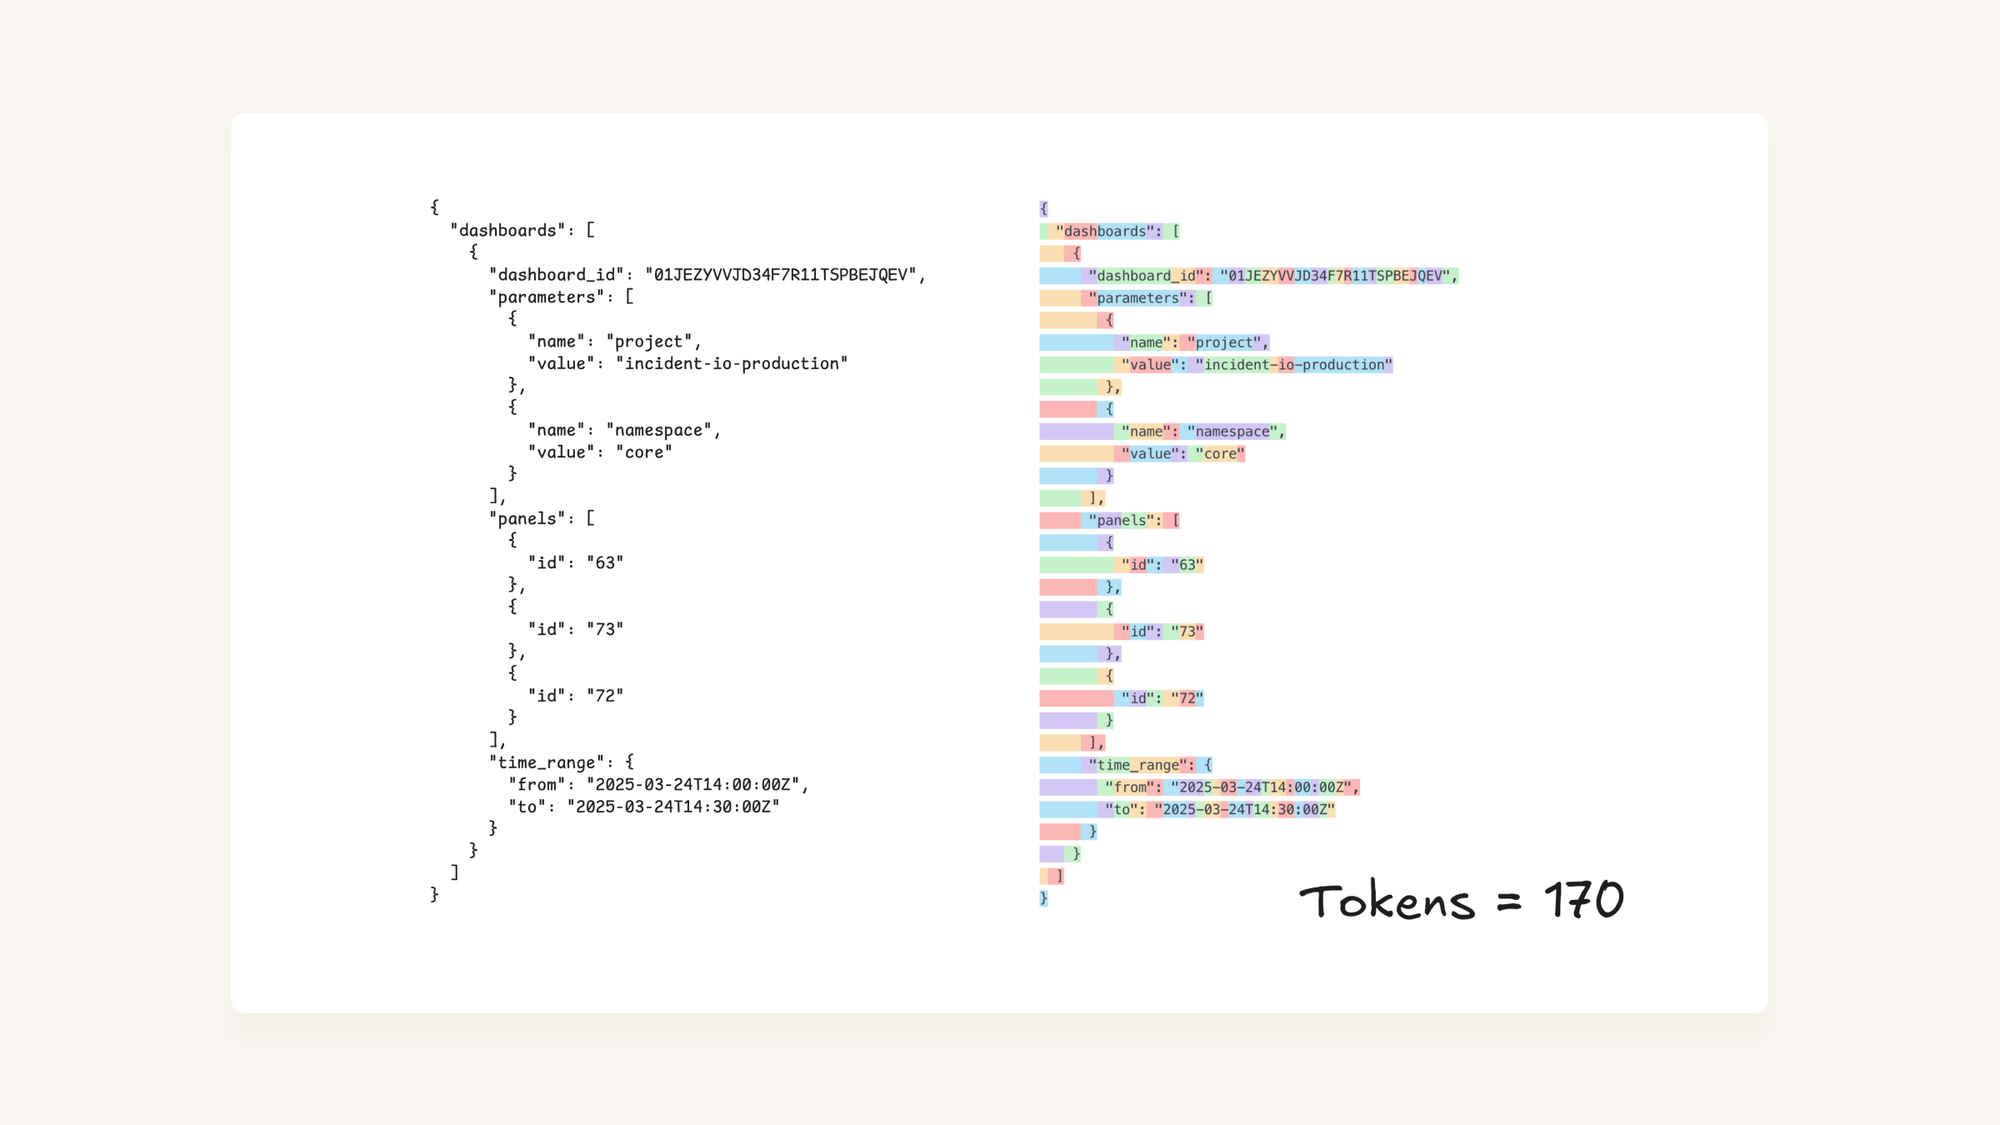
Which brings latency from 11s to 7s, a 40% improvement.
Losing the reasoning is a trade-off we’re happy with too, as we can always add it back conditionally if we need the additional output, even if that can somewhat alter how a prompt behaves. Crucially though, this is as close to a ‘free’ optimisation as we’d hope to get.
But it’s still slow, what about input tokens? (7s)
The thing is, 170 tokens isn’t that many tokens. That’s pretty small-fry when it comes to modern LLMs, and even 7s is quite a while to wait for a response. Especially when most third-party web requests are 500ms-2s, that’s pretty heavy.
So while OpenAI’s “Latency optimization” and other provider guidance emphasises output tokens are most important when it comes to latency, and our knowledge of transformer architecture backs this up, it feels sensible to consider what we can do to reduce input tokens just to see how it does impact things.
Taking a look at the input into the prompt, we were representing the dashboards we’d indexed from Grafana as a JSON structure. We’d have anywhere up-to 100 dashboards, which inflated into about 15k tokens.
As you can see from the tokenisation in the above diagrams, JSON is not token efficient. Most LLM tokenisers will break on " punctuation and JSON being self-documenting (as in, it contains the keys of the objects in all objects) is not a compact representation of the data.
So what happens if we take the dashboard data, but represent it in a more compact format?
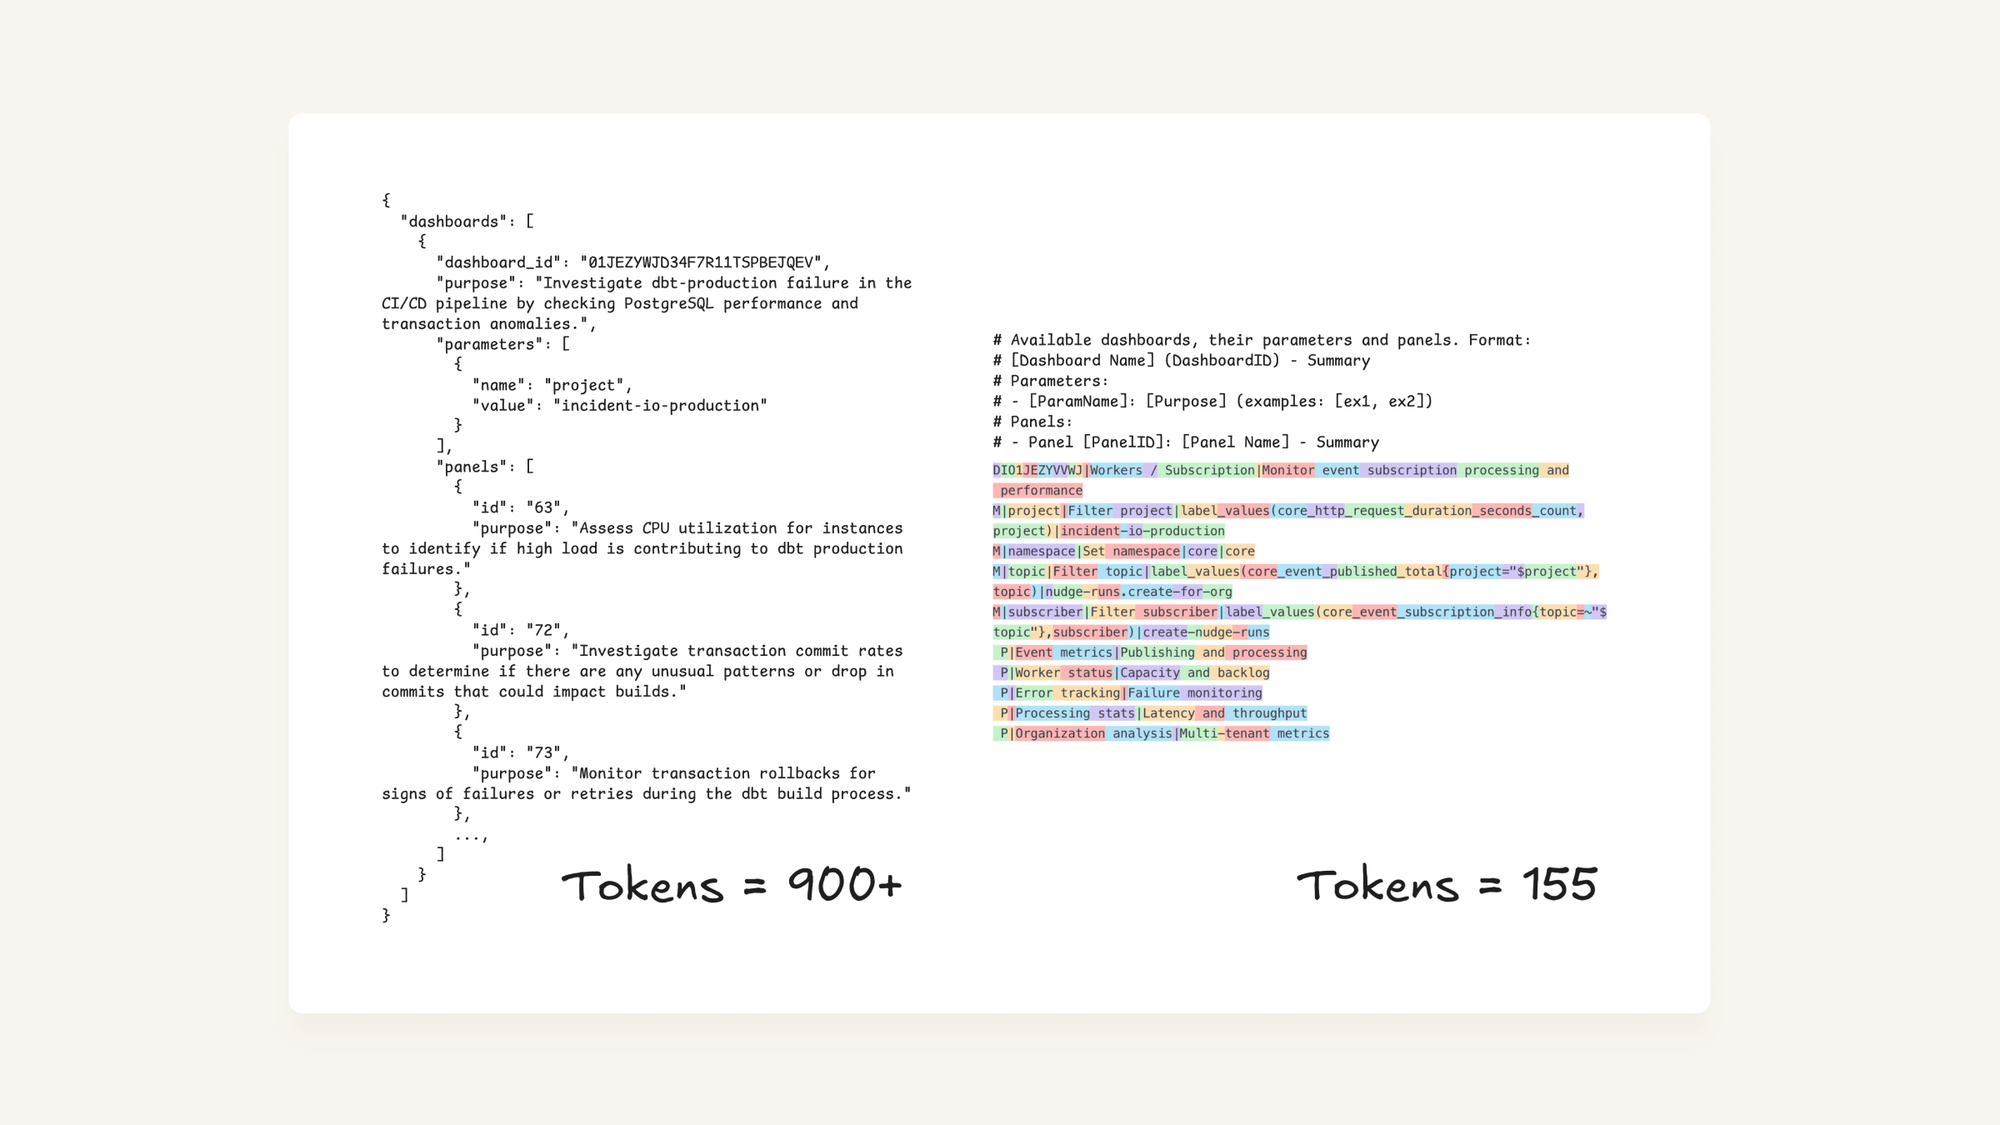
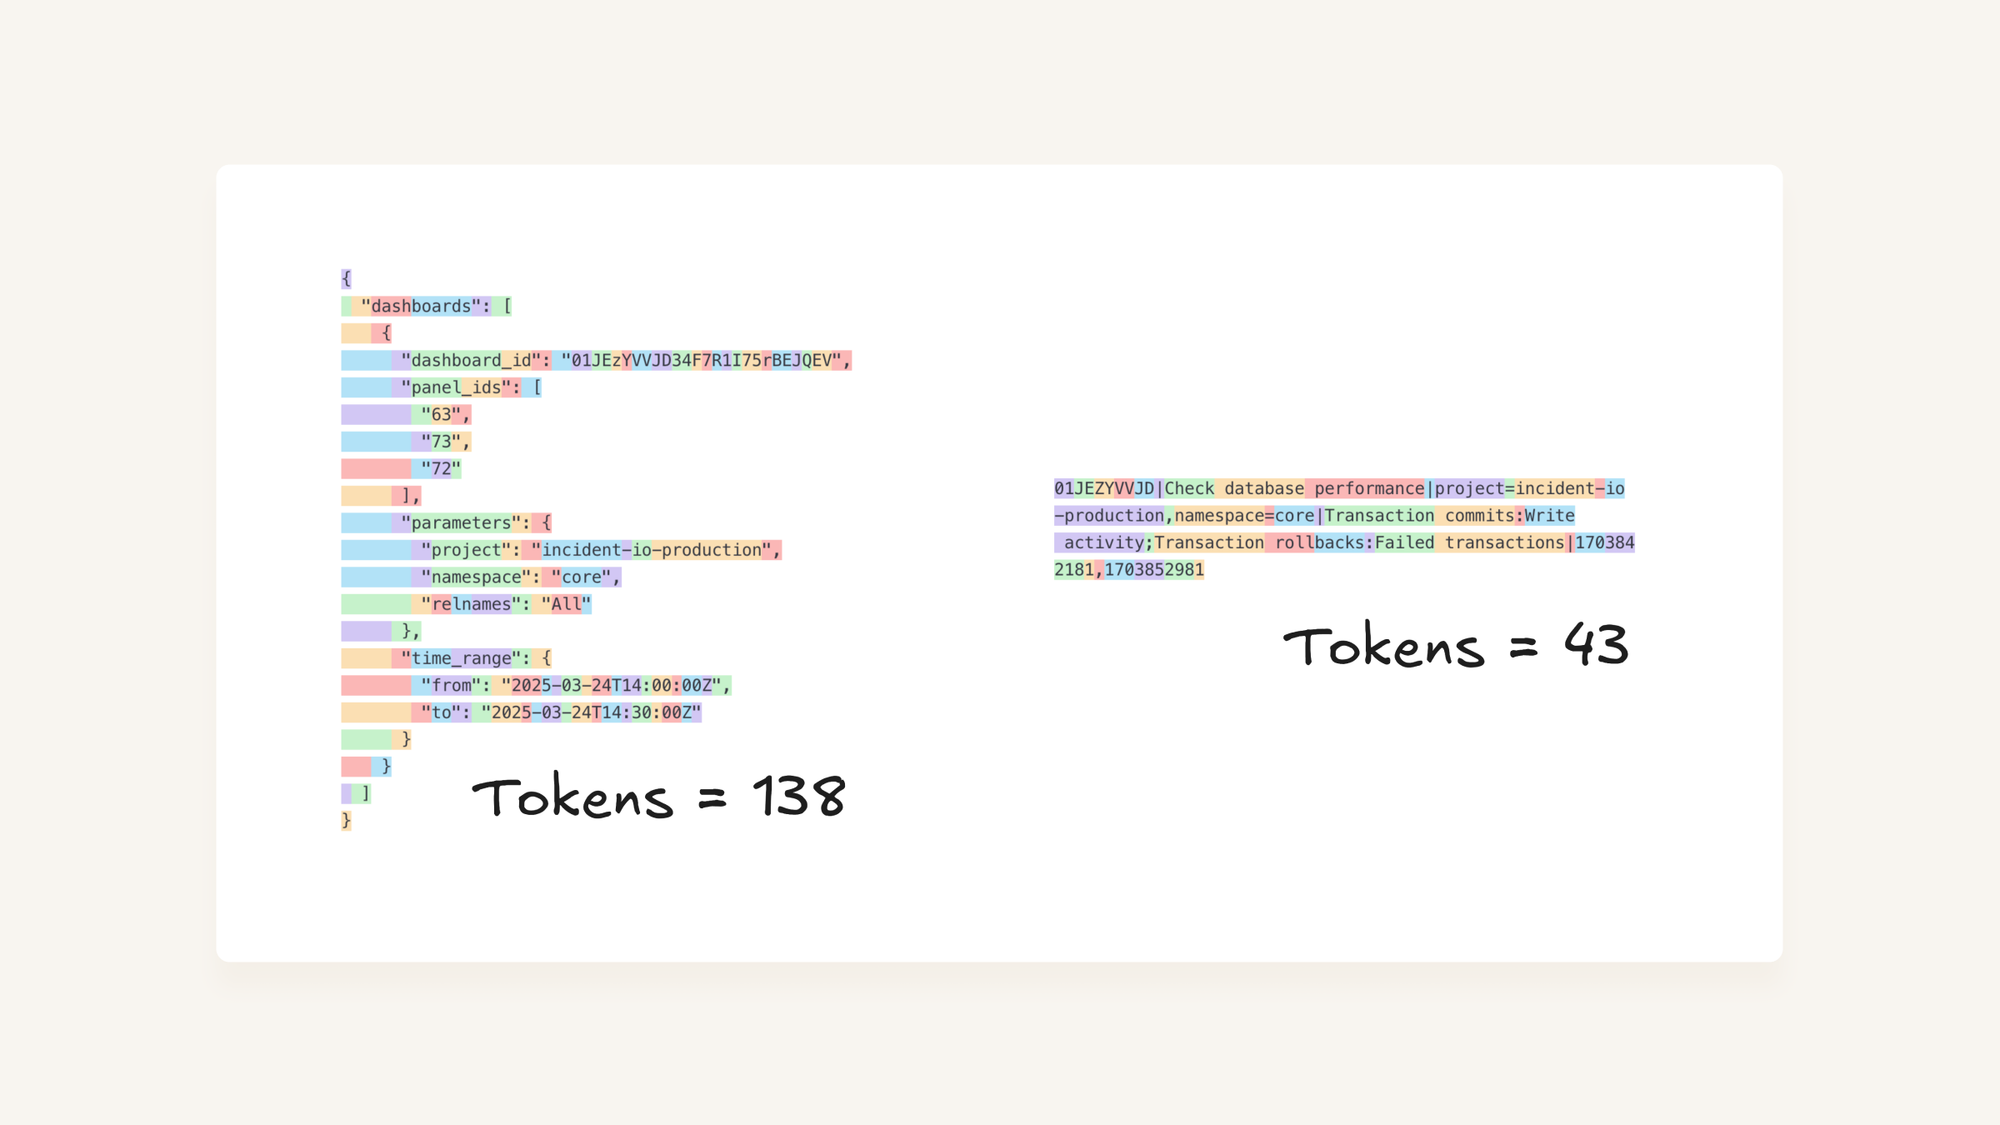
On the left is the original JSON dashboard definition, while on the right is a custom format that we serialise from the same data, with a docstring that we provide to the LLM that helps understand it.
When applied across all the dashboards we plan against, this took our prompt from 15k to 2k input tokens, a >80% reduction in input token usage.
Which, drum roll please… made latency go from 7s to 5.7s, a 20% latency improvement.
Yeah but, what’s the limit here? (5.7s)
A quick recap:
- Reducing output tokens by ~50% led to a ~40% latency improvement, which follows the rule-of-thumb of latency being approximately proportional to output.
- Reducing input tokens by ~80% led to a ~20% latency improvement, demonstrating that input tokens do matter, but far less than output.
At 5.7s we’re already happy, but if you’ve got this far you probably realise there’s a step we are yet to take.
Compression worked wonders for our prompt inputs. What if we apply the same type of compression we made for the dashboard definitions to the output format?
We saw that JSON is inefficient for tokenising, so can we find a better format to avoid paying the cost where it matters most, in our output tokens?
The answer is yes, absolutely!
If we’re happy dropping JSON and teaching the LLM (through its system prompt) how to output an extremely compact format for each dashboard we have planned, we can squeeze a final but significant amount of latency out of the system.
Moving to this style does two things:
- It reduces the tokens by implicitly assuming fields through structure, this is strictly reducing the output tokens which we know were costing us latency.
- It also changes from JSON format implemented by OpenAI’s structured-data output to a free-structured text, which may reduce an overhead of applying JSON schemas to output tokens that might also have cost us latency.
In terms of the final result, we go from 5.7s to reliably <2.3s. That’s a 60% reduction in latency for a 70% reduction in output tokens, not bad.
Tokens go brrr!
Guidance written by providers and LLM experts is great. Rule-of-thumbs for improving performance are also useful, but it’s hard to internalise them until you see the effects for yourself.
Working through this example and code-golfing our way to maximum performance was an amazing way to build intuition around relative importance of input and output tokens when it comes to a real-world use case. It definitely helped the lessons stick for me, at least!
While we refrained from implementing the output token compression in production, it’s great to know there is a way to super-charge prompts that’s relatively generalisable. In fact, we’ve considered implemented a “go-fast” mode on our prompts where we add custom formatting instructions to system prompts that opt-out of JSON formatting, and have our framework parse the response back into Go structs as if it had been in JSON all along.
That’s possible because converting between JSON and more compact formats is computationally straightfoward, though we’ve held-off due to concerns about models being very familiar with JSON as an output format and not wanting to hurt performance in more subtle ways, even if we can technically parse what it outputs without an issue.
It does make me wonder if models will eventually pretrain on more compact formats than JSON/YAML, though, if that can lead to faster response times by default in future. My guess is that working on faster inference is a more direct solution, but who knows what providers are up to behind the scenes!
For now, these are a collection of tricks you can use as model consumers to improve your prompt performance. And if that still isn’t enough, you can always get inventive with tricks like “Speculatively executing tool calls” to tease out a final speed boost to make your app feel super-snappy.
More articles

Weaving AI into the fabric of incident.io
How incident.io became an AI-native company — building reliable AI for reliability itself, and transforming how teams manage and resolve incidents.
 Pete Hamilton
The timeline to fully automated incident response
AI is rapidly transforming incident response, automating manual tasks, and helping engineers tackle incidents faster and more effectively. We're building the future of incident management, starting with tools like Scribe for real-time summaries and Investigations to pinpoint root causes instantly. Here's a deep dive into our vision.
 Ed Dean
Avoiding the ironies of automation
Incidents happen when the normal playbook fails—so why would we let AI run them solo? Inspired by Bainbridge’s Ironies of automation, this post unpacks how AI can go wrong in high-stakes situations, and shares the principles guiding our approach to building tools that make humans sharper, not sidelined.
 Chris Evans
Join our team – we’re hiring!
Join the ambitious team helping companies move fast when they break things.
See open roles