Product metrics @ incident.io, a year (and a half) in
September 28, 2022 — 4 min read

We’ve been celebrating a few big milestones 🎉 at incident.io in the last few months, namely:
- Celebrating the first year anniversary of our first 2 employees, Lawrence and Lisa
- Moving into our 4th London office in the past 12 months
- Raising a $34M series A and opening up our first international office in the US
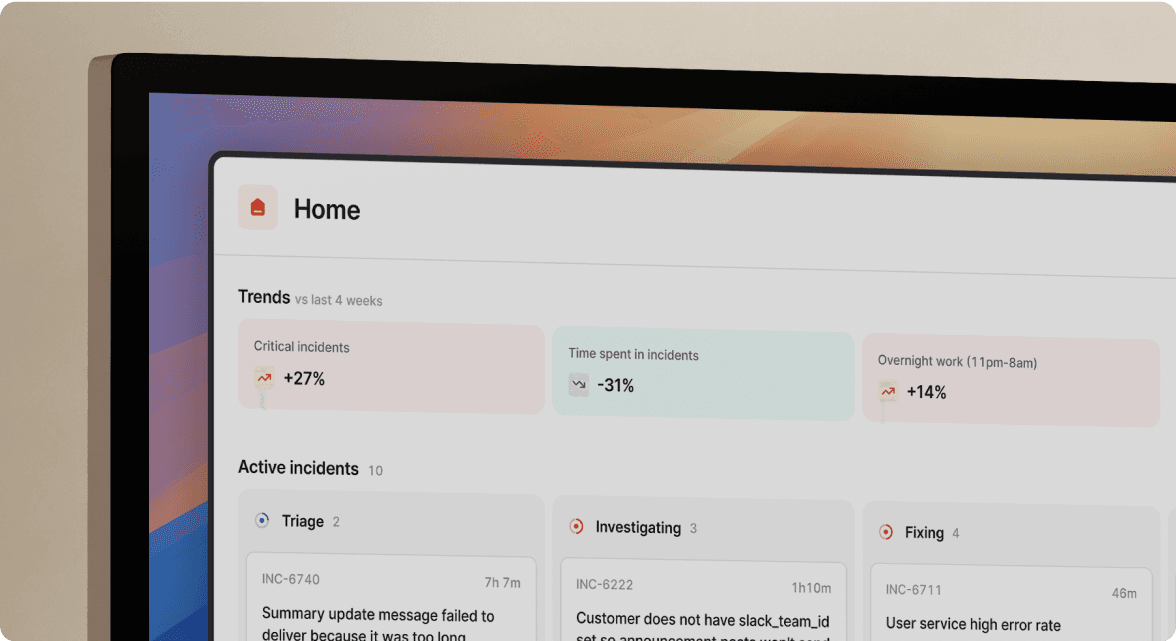
We were recently discussing product metrics (as you do for fun on a Friday afternoon 🤓) , and Lawrence was very surprised with a particular stat around the number of workflows that have been run using incident.io:
When I joined we had no such thing as workflows. I guess I’m frozen in time when it comes to product stats, and I probably need to update my mental model.
This piqued our curiosity, so in order to uncover some of these stats (whilst helping Lawrence to update his mental model 🧠), we got to work, and uncovered some insightful metrics that highlight just how much our product has scaled in the past year.
~18,000 incidents have been declared
100s of organizations have used us, and we’ve helped to deal with incidents ranging from service outages down to simple bugs. Our largest incident had 135 users join the incident channel, whilst the incident with the largest number of action items had a massive 65 action items!
Workflows

Since we released this feature in December of 2021, we’ve had ~65% of customers creating workflows. With workflows, our customers have automated:
- 21,539 tasks
- 3,693 slack messages
- 2,035 emails
- 2,819 follow-ups (dealt with after the incident)
- 1,490 actions (dealt with during the incident)
The individual workflow with the most number of runs so far stands at an impressive 1,147 runs, whilst the one with the most distinct steps has 11 steps overall. Our most commonly used workflow is inviting someone to an incident channel, which our customers have set up in 157 different workflows and has seen a total of 3,539 runs. That’s a lot of manual clicks saved!
On-call

Our product works with multiple pager services, which means we have some interesting insights into who is being paged and when. We first looked at the number of times an individual was paged, and then narrowed it down to users who were paged from midnight to 6 am. Amazingly, the same person popped up at the top of our list.
After being paged 33 times in a single week (and in that same week 11 times between midnight and 6am), we think this person is owed some recognition ❤️ — we’ll reach out to them to get them some incident.io swag ASAP! There’s also someone who’s been on-call every day since May - time for a holiday maybe 😅?
Interestingly enough, we found that getting paged during sleep hours is quite common - as we uncovered in our on-call survey earlier this year, 12% of our survey respondents cited lack of sleep as the most common challenge they faced - overall over 1,100 pages were sent between midnight and 6am since the start of May.
Incident leads

One thing we’ve commonly observed with our product is that a single incident will need a different lead depending on what the issue is. We looked at the single incident with the most number of leads, and found one incident had a total of 32 different leads over the lifespan of the incident 🏓
We’ve had a mighty 4,035 different people becoming incident leads since launch. One individual has taken the lead in resolving 153 incidents, we think of them as a mighty incident superhero 💪
We’re proud of the scale incident.io is enabling, and cannot wait to see how these numbers look in a year. Want to geek out with us over metrics? - send us a note and we’ll update this article or release another one with more product metrics over time!

Ed Dean
Product Manager
See related articles

Your genie is vanishing: introducing the Opsgenie rescue program
Today, we're launching the Opsgenie Rescue Program to make that landing soft: simplified migration and free overlap so you never pay two vendors at once.
 Tom Wentworth
July 9, 2026

De-risking a PagerDuty migration: the objections we hear most, and how to clear them
Often, switching on-call platforms isn't a technical challenge but a human one. In this post, we break down the seven objections engineering teams raise most often when considering a PagerDuty migration, and share exactly how to address each one.
 Eryn Carman
June 9, 2026

Customers over control: how we measure On-call reliability
Instead of thinking about reliability as an exercise in figuring out what we can control, and ignoring anything beyond that, we think about what we'll be really proud to offer to customers.
 Mike Fisher
May 28, 2026
So good, you’ll break things on purpose
Ready for modern incident management? Book a call with one of our experts today.
We’d love to talk to you about
- All-in-one incident management
- Our unmatched speed of deployment
- Why we’re loved by users and easily adopted
- How we work for the whole organization

