Debugging Go compiler performance in a large codebase
January 15, 2024 — 7 min read

As we’ve talked about before, our app is a monolith: all our backend code lives together and gets compiled into a single binary. One of the reasons I prefer monolithic architectures is that they make it much easier to focus on shipping features without having to spend much time thinking about where code should live and how to get all the data you need together quickly.
However, I’m not going to claim there aren’t disadvantages too. One of those is compile times. Because all the backend code needs to be built into a single artefact, the time it takes to do that inevitably increases as the amount of code to compile grows.
That’s bad for shipping quickly: a slower build means it takes longer to get code from “pull request merged” to “running for customers”. It’s also bad for developer experience: time spent waiting for the compiler isn’t productive time, and it can break your flow.
While faster MacBooks can make a big difference, we can also apply some performance-optimizing tools that come with Golang to figure out where the bottlenecks are and remove them!
Visualizing the build process
The first thing to note is that the Go compiler caches previously compiled code, so to get a clearer picture of the worst-case scenario, I cleared that cache before each run, using go cache -clean.
Looking at the docs, there are a few interesting-looking flags you can pass to go build:
-debug-actiongraph- this tells you what the compiler is doing at different points, and can be inspected with https://github.com/icio/actiongraph.-debug-trace- this produces a trace, which can be visualized in a tool like Perfetto
I found the trace view felt more familiar: at incident.io we debug things by reading traces all the time, and the Perfetto UI is familiar if you’ve had to optimize JavaScript performance with the Chrome DevTools before.
So, with a clean cache, I ran go build ./cmd/app/ -debug-trace=tmp/trace.json, and dropped that into Perfetto:
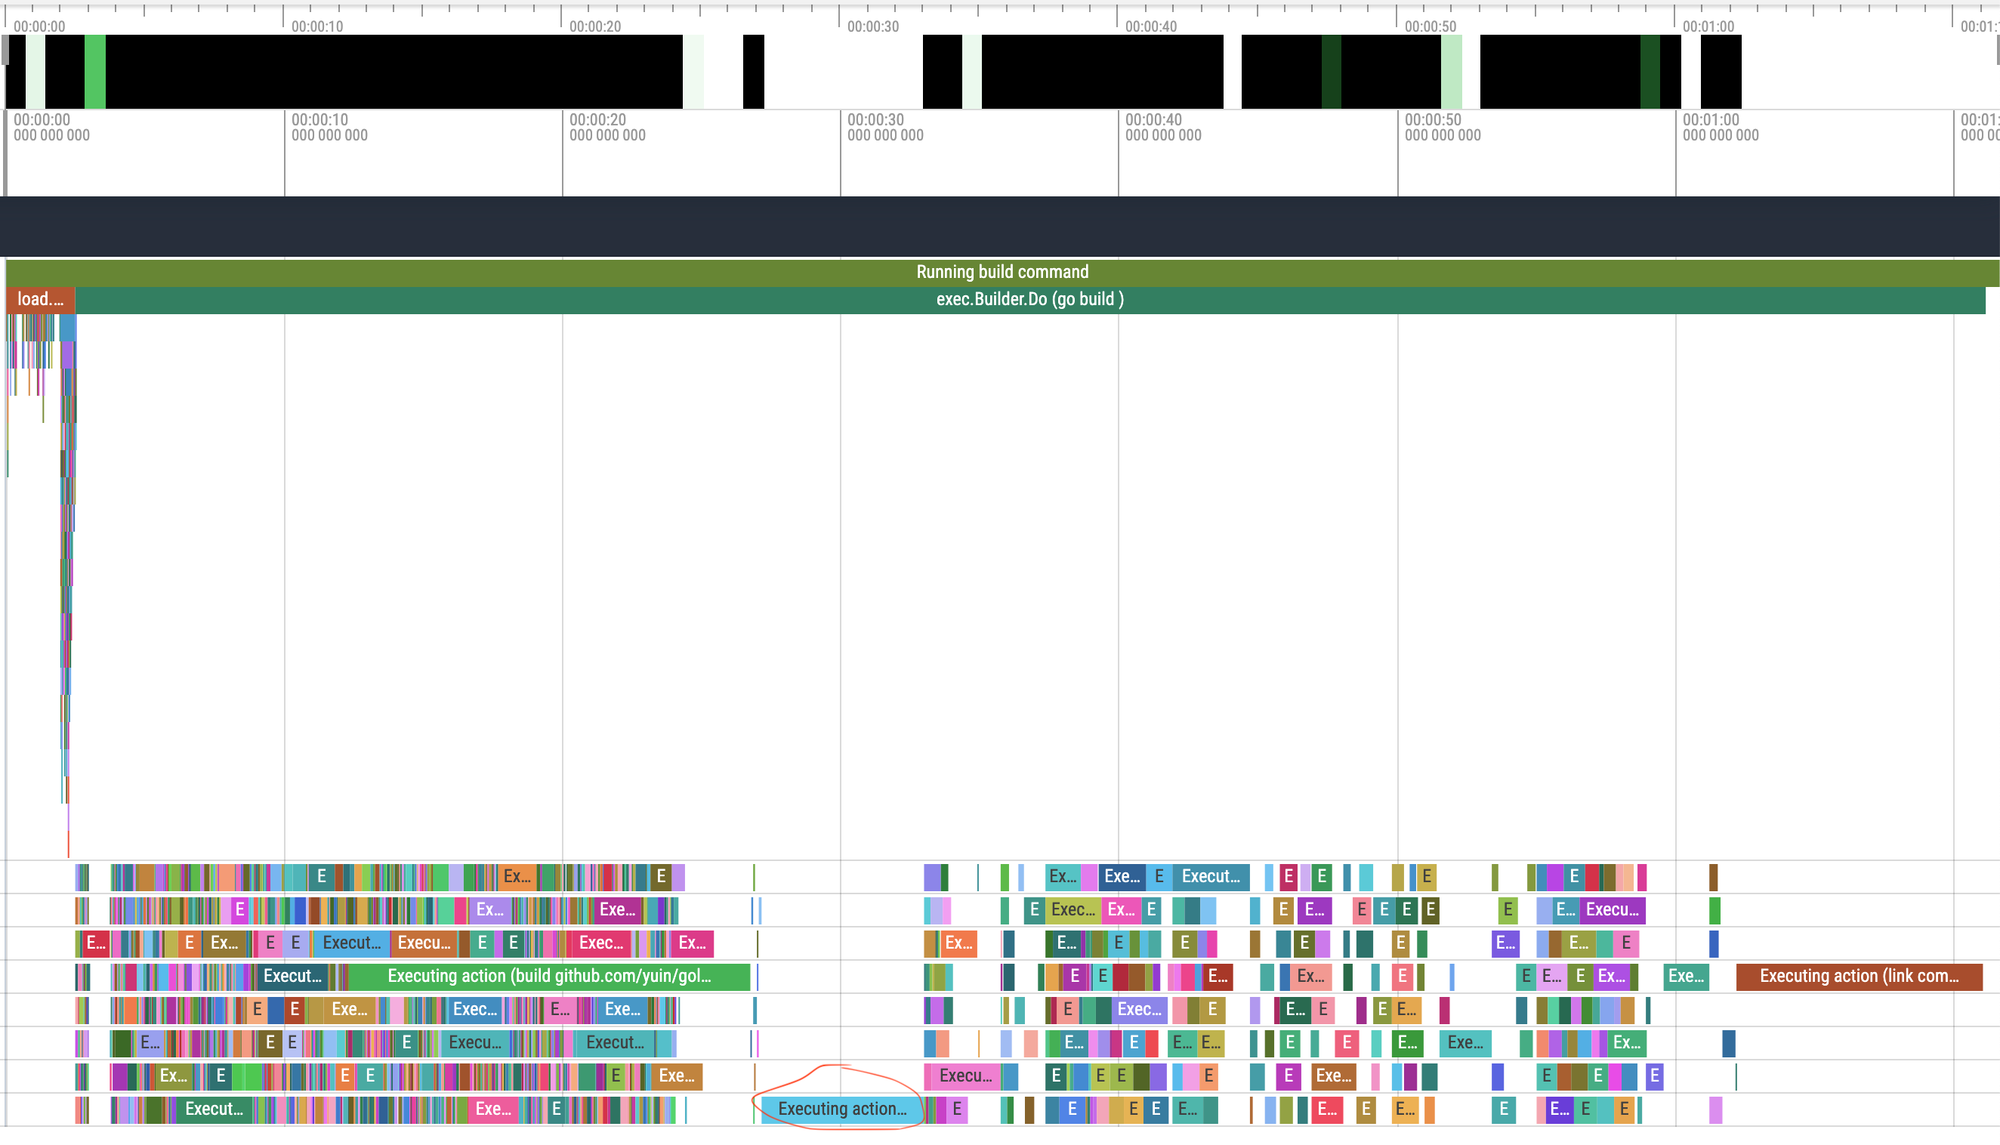
Well, that is pretty, but what does it tell us? Broadly there are three phases:
- Planning: up at the top-left, there are a bunch of short spans which are the compiler figuring out which packages import which other packages, and planning out the build. This is pretty quick!
- Next, there’s a really dense set of spans: this is almost entirely compiling external dependencies. This uses all 8 cores and isn’t all that interesting to us: these packages don’t change much and therefore the build cache should be very effective at avoiding recompiling them.
- At about 25s in, we finally start compiling our own code. This code has a lot more dependencies between packages, which creates those gaps where every package waiting to be compiled imports something that is currently being compiled, and so has to wait.
At this point, there’s only really one path to making this faster: eliminating as much of the space in the trace where only one or two cores are doing any work.
The first thing to tackle is the turquoise span I’ve circled. That’s a package called ./pkg/domain, which defines a structure for each table in our database. Things like:
type Incident struct {
  ID string
  Name string
  ...
}
It makes sense that a lot of our code will import that package: if you’re using the database, you need to! It also makes sense that it’s a relatively big package, since we have around 250 tables. Once you add in the builders we generate, that gets up to around 800 files, containing almost 100k lines of code.
To speed things up there were two strategies I tried:
Start sooner, finish sooner
The first option I tried at this point was removing dependencies from pkg/domain, so the compiler could get started on building it sooner.
We were already using a great little linter called depguard to set rules that help us avoid import cycles. I started off setting an ultra-strict rule, saying pkg/domain cannot import anything except the standard library:

This produced a long list of violations! Working through those one-by-one let me check each of the packages we were importing and either add them to the allow list, or figure out how to break that dependency.
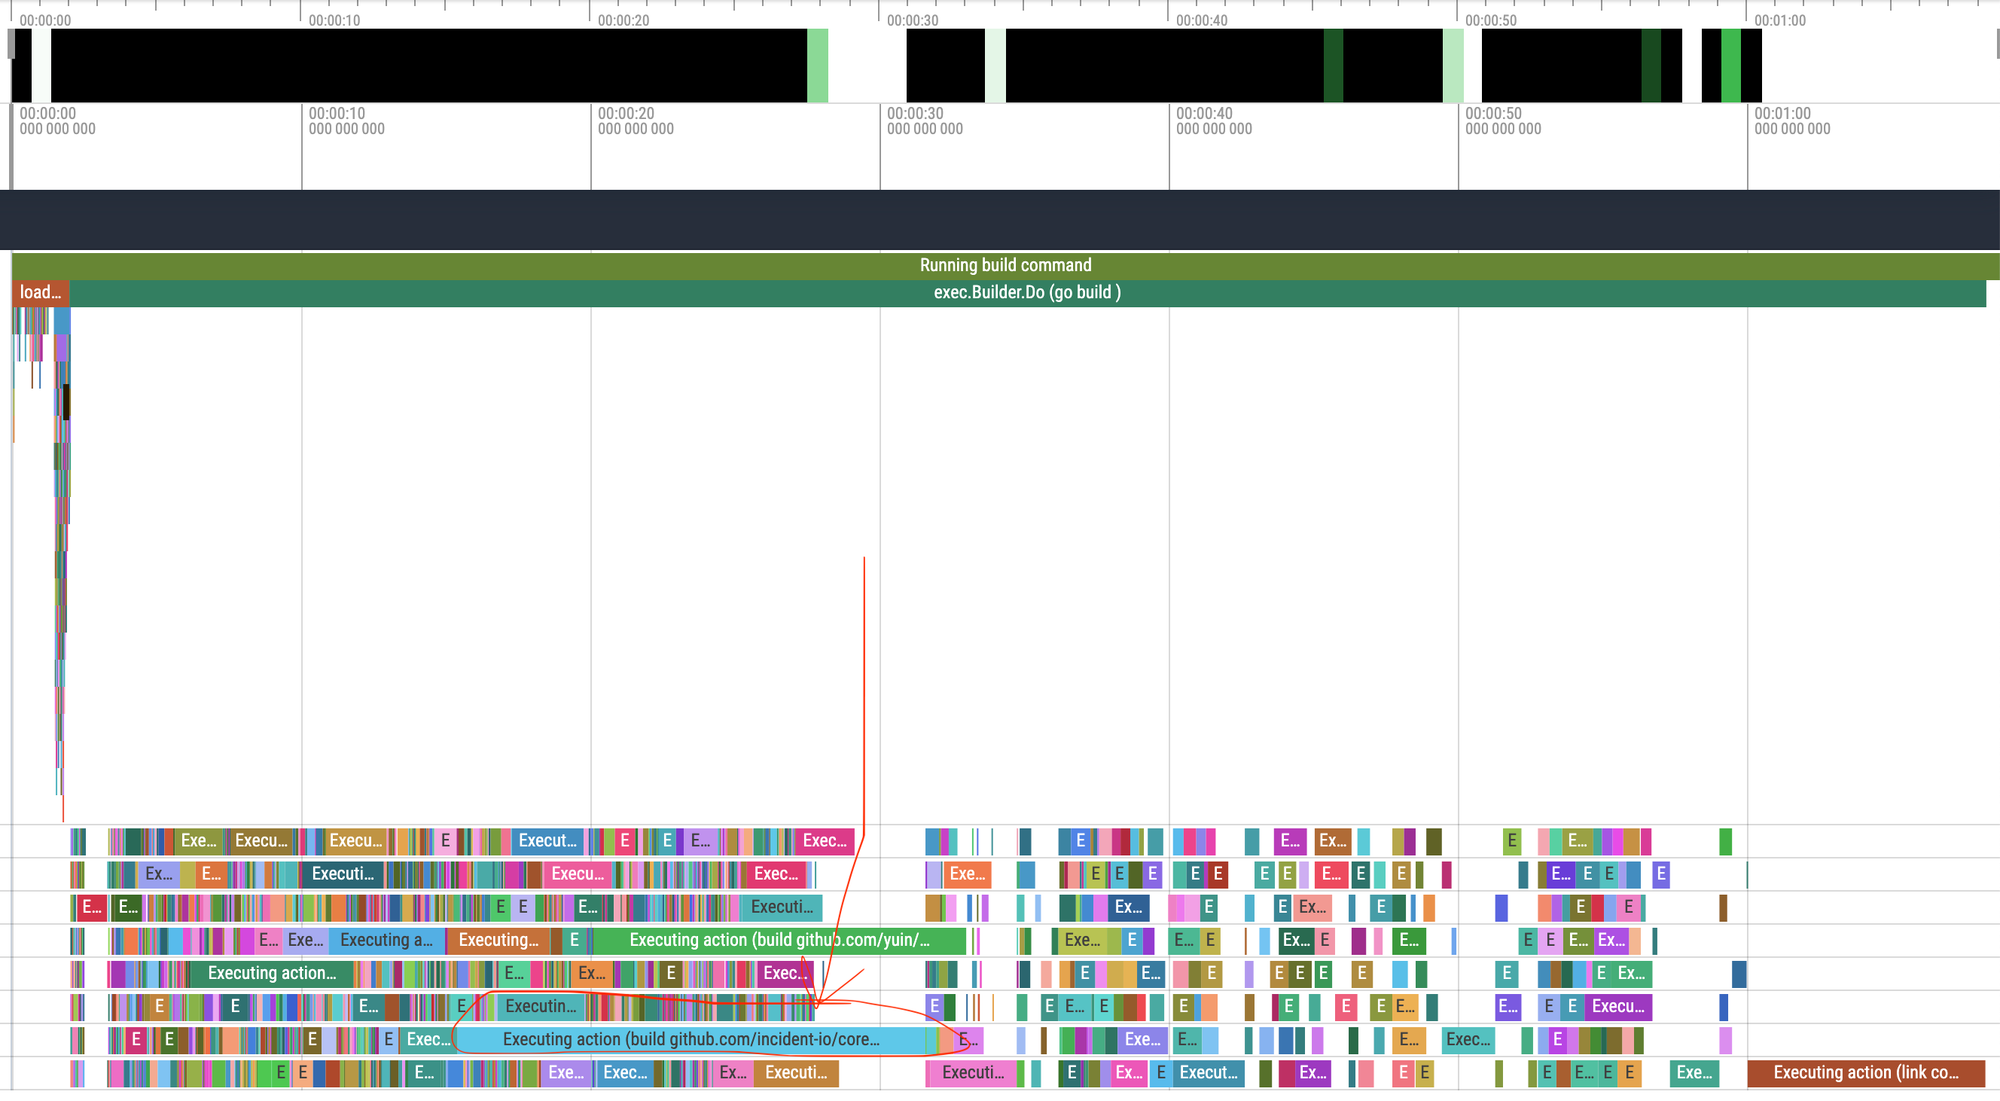
After breaking each dependency I cleared the cache and did a fresh build to see if the trace had really changed much. The biggest improvement was removing the dependency on yuin/goldmark, a markdown parsing library, which allowed these two large packages to be compiled in parallel, and got pkg/domain started at around 15s in, rather than 25s!
Break it up
That helped a lot with the worst case compile without anything cached. Luckily, that’s not all that common: a more frequent situation is that someone has changed a file inside pkg/domain. In that case, the compiler will recompile that package plus anything that imports it, which here means pretty much the whole app! A trace of that looks something like this:
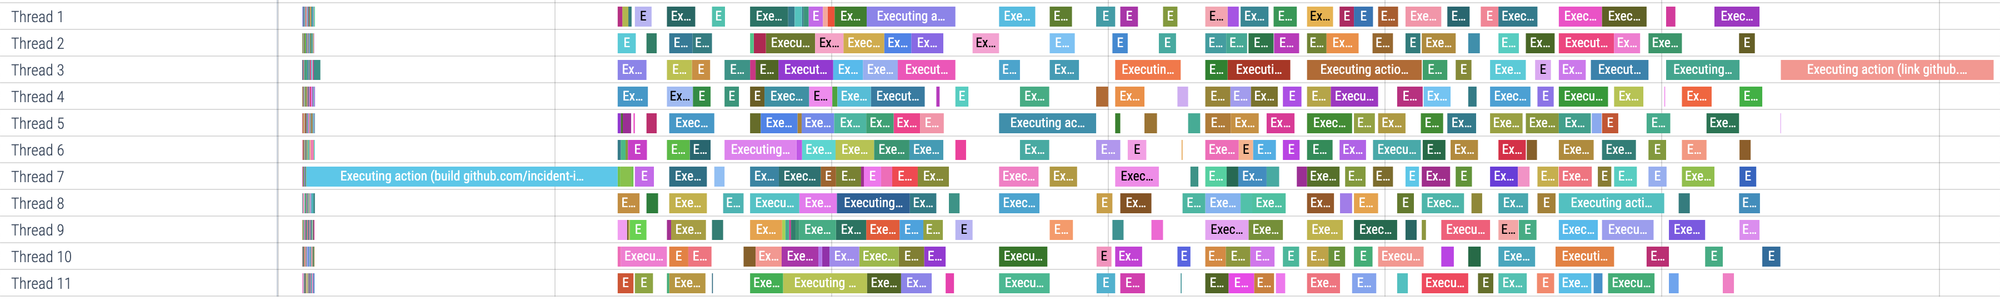
Look at all those sad, bored CPUs not doing anything while we’re building pkg/domain!
The only solution here is to make this package smaller. At first that seemed like a pretty complex task: there are lots of bidirectional relationships between different structs in this code for good reason! For example, we have code like this:
// in incident.go
type Incident struct {
  ...
  IncidentUpdates []*IncidentUpdate
}

// in incident_update.go
type IncidentUpdate struct {
  ...
  Incident *Incident
}
This lets us write code that loads both an incident with all its updates, or an update with the incident it belongs to. Splitting these across two packages creates an import cycle.
That’s just one example - splitting this package up seemed like a recipe for nasty import cycles and unhappy engineers.
Luckily, there was another axis to split this code along: app code vs test code. We generate type-safe gomega matchers for each of these domain types, to make writing tests like this really simple:
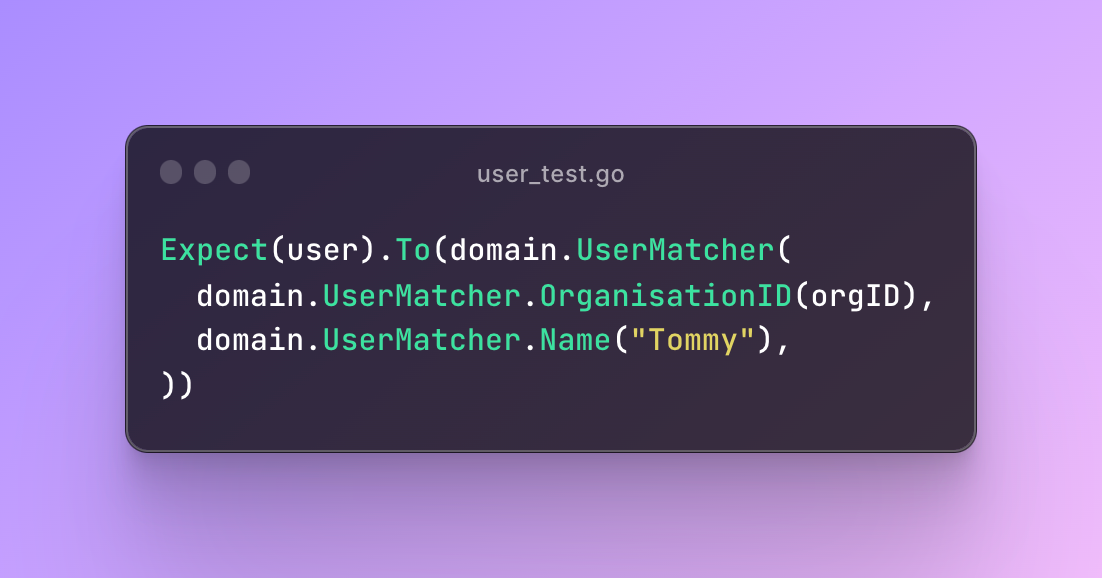
That’s a big chunk of code that could live in a separate package, that will only be imported by tests. Moving those out into pkg/domain/matchers reduced the time to compile pkg/domain by about 30%, which adds up pretty quickly when that package get rebuilt 10-20 times a day across the team.
That same example now looks like this:

What did I learn?
Developer tools like compilers can feel strange and scary if (like me) you’ve never really taken a look at what they’re doing. When you find something annoying about them, like a slow build or a dodgy error message it’s all just more code that you can use your normal skills and tools to work on.
Your teammates will appreciate it.

Isaac Seymour
Product Engineer
See related articles

Making code-generation in Go more powerful with generics
Go 1.18 added generics to the language a few months ago. Here’s how we’ve combined generics with code generation to make our code safer and easier to read and write.
 Isaac Seymour
October 20, 2022

Engineering nits: Generating code faster
As our app grew, our codegen got slower and slower. Here's how we made it 97% faster.
Isaac SeymourDecember 11, 2023

Building a great developer experience at a startup
We’ve invested in our developer experience to help our team ship great a product at pace.
 Lisa Karlin Curtis
October 4, 2022
So good, you’ll break things on purpose
Ready for modern incident management? Book a call with one of our experts today.
We’d love to talk to you about
- All-in-one incident management
- Our unmatched speed of deployment
- Why we’re loved by users and easily adopted
- How we work for the whole organization


