Datadog alert routing for on-call: the complete configuration guide
August 5, 2026 — 22 min read
TL;DR: Configuring Datadog alert routing for on-call comes down to separating detection from coordination. This guide serves two readers: the SRE configuring monitors, tags, and escalation policies today, and the engineering team deciding how to migrate off Opsgenie before the April 2027 deadline. A Slack-native platform like incident.io catches webhooks, pages the right on-call engineer, auto-creates a dedicated incident channel, and starts capturing a timeline, all without anyone touching a second tool. With Opsgenie sunsetting in 2027, a structured parallel-run migration now is far safer than a rushed cutover later.
When a P0 alert fires, teams often spend significant time assembling the right people across Slack, Jira, and Datadog before anyone touches the actual problem. The coordination overhead stems from treating detection and coordination as the same problem, running them in the same tool, which creates a fragile tangle of integrations that breaks precisely when you need it most.
This guide gives you a single authoritative reference for routing Datadog alerts into a reliable, Slack-native on-call workflow, from monitor creation through escalation to post-mortem, and a safe path off Opsgenie before the 2027 deadline.
Understanding Datadog's alert routing layers
Separating monitors from notifications from routing helps prevent common misconfiguration mistakes that cause paging storms.
Monitors vs. notifications vs. routing
These are three distinct layers, and conflating them is where most alert fatigue originates.
- Monitors: Evaluate conditions against metrics, logs, or traces. They answer "is something wrong?"
- Notifications: Carry the alert payload to a destination. They answer "who or what gets told?"
- Routing: Determines which team, schedule, or channel receives the notification. It answers "which on-call engineer handles this specific service?"
Datadog webhook integrations handle the notification layer by sending alerts to a target endpoint when a monitor changes state. Routing logic lives either in the monitor message body (via @webhook mentions) or in the receiving platform's escalation policies.
The alert lifecycle in Datadog
Datadog monitors move through states including OK, WARN, ALERT, and NO DATA. A well-configured monitor typically pages on-call when it reaches ALERT, not WARN. Alert fatigue often traces back to teams wiring their paging channel to WARN thresholds that represent normal operational noise.
Common routing anti-patterns
Three patterns consistently produce paging storms:
- Routing all monitors to one Slack channel: Engineers quickly tune out the noise.
- Paging the entire team for P2/P3 warnings: The team learns to ignore pages, which means they ignore P0s too.
- No evaluation window: A brief spike can trigger a page when the threshold should require sustained levels over several consecutive minutes.
Creating actionable monitors for on-call
The following patterns cover threshold definition, query construction for Kubernetes environments, and using template variables to give on-call engineers instant context.
Defining alert thresholds that matter
Raw resource utilization (such as CPU at 80%, memory at 70%) may not directly reflect user-facing symptoms. A service can sometimes consume high CPU while delivering acceptable response times, and an alert on that threshold alone can generate noise with no actionable signal.
Set thresholds against Service Level Indicators (SLIs) instead: HTTP 5xx error rates, P99 latency on critical endpoints, and pod restart counts in production deployments are all directly tied to user-facing behavior. If an on-call engineer cannot take a specific action when they receive the page, the threshold is wrong.
Writing monitor queries for Kubernetes microservices
Datadog's Autodiscovery feature monitors containerized applications as they scale across hosts, which makes it well-suited for Kubernetes microservice environments. For a concrete example, an HTTP 5xx error rate monitor on a billing service might filter by env:production and service:billing, comparing error hits against total hits over a trailing window.
Set the evaluation window to prevent transient spikes from triggering a page. Consider adding a notification delay on monitors that track services with rolling deployments, because a deployment restart momentarily spikes error rates before new pods pass health checks.
Selecting template variables for dynamic context
Datadog template variables inject real-time values from tags and metrics directly into the alert payload. For example, you can write: "The CPU for {{host.name}} (IP:{{host.ip}}) reached a critical value of {{value}}."
For microservice environments, useful variables in the monitor message body include {{service.name}}, {{env}}, {{cluster_name}}, and {{value}}. Including these in the webhook payload means the on-call engineer receives the service name, environment, and current metric value in the Slack incident channel before they type a single command.
Configuring notification channels and routing rules
These steps walk through connecting Datadog to your on-call platform, routing alerts by team and severity, and tagging monitors so routing rules stay consistent as services scale.
Setting up integration with on-call tools
To connect Datadog to an external platform, configure a webhook integration and provide the receiving endpoint URL. The incident.io Datadog integration generates this URL automatically: in the incident.io dashboard, go to Alerts in the left navigation bar, create a new alert source using Datadog, and follow the walkthrough, which generates the exact webhook URL to paste into Datadog.
Using @-mentions for team routing
Inside the monitor message body, you trigger routing with @ mentions. For incident.io, the mention typically looks like @webhook-incident-io. For PagerDuty, it is typically @pagerduty-[service-name]. Multiple mentions can route alerts to more than one destination simultaneously, which is exactly how the parallel-run phase of an Opsgenie migration works.
Dynamic routing extends this further. A pattern like @slack-{{service.name}} routes an alert from a service:ad-server tag group directly to the #ad-server Slack channel. One monitor template can fan out across dozens of services without duplicating configuration.
Building tag-based routing patterns
Unified service tagging in Datadog ties telemetry together through three standard tags: env, service, and version. Building on those three, a routing-ready tagging schema for microservices might add:
team:paymentscan route billing and checkout alerts to the payments on-call scheduleenv:productioncan filter production alerts for immediate attention while staging alerts go to lower-priority channelstier:p0-eligiblecan flag services that warrant immediate escalation
Standardizing on Datadog's base env, service, and version tags, and adding team as a supplemental routing tag across every Kubernetes deployment, eliminates per-team inconsistency because routing rules in the receiving platform key off consistent metadata instead of per-monitor configuration. Without this standardization, teams end up with wildly different noise levels and threshold conventions, which is one of the root causes of alert fatigue across engineering organizations.
Selecting priority-based channels
Route by severity using conditional @ mentions in the monitor message:
- P0/P1 monitors:
@webhook-incident-io(can create an incident and page on-call immediately) - P2 monitors:
@slack-[team]-alerts(can post to a low-noise Slack channel without paging) - P3 monitors:
@slack-[team]-info(informational only)
Building escalation policies
The sections below cover how to structure multi-stage escalation chains, set time-based triggers by service criticality, and configure fallback routing so no alert goes unacknowledged.
Multi-stage escalation configuration
A production-grade escalation policy has three stages:
- Primary: The primary on-call engineer receives a push notification and SMS simultaneously.
- Secondary: If the primary doesn't acknowledge within the configured window, the platform pages the on-call engineering lead.
- Tertiary (catch-all): If neither primary nor secondary acknowledges after the full escalation chain
runs, the platform pages the DevOps Lead or Engineering Manager. incident.io's reassign escalations feature lets engineers hand off an active escalation path mid-incident, which is useful when the primary on-call engineer identifies that a different team owns the affected service.
Time-based escalation triggers
Set your primary acknowledgment window based on the severity of the service. Revenue-critical services (checkout, payments, authentication) warrant a shorter escalation window than internal tooling. You can sync schedules with Slack so that @payments-oncall in any Slack message or workflow automatically resolves to whoever is currently on-call, without manual updates.
Fallback routing for unacknowledged alerts
Configure a fallback routing rule that triggers when an alert remains unacknowledged. The fallback can notify a dedicated Slack channel and page the Engineering Manager directly. This prevents the scenario where a misconfigured schedule leaves a critical alert unacknowledged for an entire shift.
Integrating Datadog with PagerDuty, Opsgenie, and incident.io
This is the section that matters most if you are migrating off Opsgenie before the April 2027 sunset.
PagerDuty integration setup
Datadog connects to PagerDuty via integration. In Datadog, go to Integrations, find PagerDuty, and add your PagerDuty service key. The monitor message then uses @pagerduty-[service-name] to trigger PagerDuty alerts.
PagerDuty's alerting rules are well-established, with complex routing logic, noise suppression, and event orchestration. PagerDuty supports Slack and Microsoft Teams integrations that allow responders to acknowledge, escalate, and resolve incidents directly from chat. incident.io pairs directly with that signal: once PagerDuty fires, incident.io auto-creates a dedicated Slack channel, pages the on-call engineer, and starts capturing a timeline, so the entire response lifecycle stays in chat. Many teams run both tools together, using PagerDuty for alert routing and incident.io for coordination.
Opsgenie migration considerations
Atlassian closed Opsgenie to new purchases, with support ending in 2027. That deadline is firm. The risk of waiting is a rushed, forced migration to Jira Service Management, which Atlassian built for service-desk tickets rather than real-time incident response, and remains web-first even for engineering teams already centered on Slack. incident.io integrates with Jira and Confluence, so you keep those workflow benefits without the suboptimal incident experience.
Here is a 3-phase migration checklist to move Datadog alert routing from Opsgenie to incident.io without disrupting your on-call rotation:
Phase 1: Audit
- Catalog every Datadog monitor that routes to Opsgenie.
- Document all existing Opsgenie on-call schedules, escalation policies, and team assignments.
- Consider exporting historical incident data for your compliance record.
Phase 2: Parallel-run
- Map existing Opsgenie schedules to incident.io using incident.io's schedule import feature to pull existing schedules directly rather than rebuilding them manually.
- Add
@webhook-incident-ioto every Datadog monitor message body that currently includes the Opsgenie webhook mention. Do not remove the Opsgenie mention yet. - Both platforms now receive every alert simultaneously.
- Run this configuration for one to two weeks, verifying that alerts route correctly, escalation paths trigger as expected, and no alerts are dropped.
- Test alerts in Datadog to confirm they appear in the incident.io Alerts tab.
Phase 3: Cutover
- Remove the Opsgenie webhook mention from all monitor message bodies.
- Move on-call engineers to respond exclusively in incident.io.
- Keep Opsgenie in read-only mode for 30 days as a fallback audit trail.
- Deprecate the Opsgenie routing rules and begin using incident.io's on-call schedules as the system of record.
incident.io Slack-native routing
When a Datadog alert fires and hits the incident.io webhook, the platform automatically creates a dedicated Slack channel, pages the scheduled on-call engineer, and starts capturing a real-time timeline. The on-call engineer can manage the response with /inc assign and /inc resolve commands directly in the incident channel without switching to a web UI.
Investigations then analyzes telemetry, code changes, and past incidents to surface likely root causes and can open a fix PR directly in Slack. Investigations automates up to 80% of incident response, which means the on-call engineer spends their first minutes reading a structured hypothesis rather than manually correlating Datadog graphs with recent deploys. Scribe, incident.io's AI note-taking feature, transcribes the incident call in real time and captures key decisions, so the post-mortem auto-drafts from the captured timeline rather than reconstructed Slack scroll-back.
The Fin case study shows this in practice. Fin migrated hundreds of engineers off PagerDuty and Atlassian Status Page onto incident.io and reported faster MTTR with less cognitive overhead.
"Our engineers immediately preferred incident.io over PagerDuty, and adoption across the broader company quickly followed." - Mark G., Technical Program Manager, Fin
If you are evaluating incident.io and PagerDuty as Opsgenie alternatives, the incident.io alternatives comparison fact-checks PagerDuty's own comparison table side by side. The rest of this guide stays focused on configuration.
Reducing alert noise
Alert noise is a configuration problem, not a volume problem. The patterns below address it at the source rather than through suppression.
Composite monitors and alert grouping
Datadog composite monitors let you chain multiple monitors into a single composite condition using logical operators to reduce false positives. A practical example: trigger a P1 page only when service-error-rate-high AND pod-restart-count-elevated are both in ALERT state. Either signal alone may be noise. Both together indicate a genuine service failure.
Group alerts by service or cluster using the monitor's multi-alert configuration so one page fires for "billing service degraded across 3 pods" rather than three separate pages for each pod. The alert payload includes the count of affected instances, giving the on-call engineer immediate scope without manual investigation.
The incident.io alert deduplication feature complements composite monitors on the receiving end by preventing duplicate alerts from generating separate notifications when the same underlying issue fires multiple times.
Anomaly detection vs. static thresholds
Static thresholds work well for metrics with predictable baselines (HTTP error rate, pod crash loops). Use Datadog's machine learning-based anomaly detection instead when:
- Traffic volume varies significantly by time of day or day of week
- A baseline is still being established for a new service
- The metric is a rate that scales with request volume
Anomaly detection monitors flag deviations from historical patterns rather than absolute values, which catches issues on low-traffic services that static thresholds miss and reduces false positives on high-traffic services during expected traffic spikes. The incident.io on-call improvements video covers how to structure muting policies inside a modern on-call workflow for planned maintenance windows.
Recovery notifications and auto-resolve
Configure monitors to send a recovery notification when a service returns to OK state. In incident.io, a recovery webhook can auto-resolve the alert if the service recovers within a configurable window, preventing the pattern where an engineer acknowledges a page, the service self-heals, and the incident channel sits open and unresolved for hours.
The alert deduplication documentation explains how deduplication keys work: if an alert with key x fires while a prior alert with key x is still active, the platform suppresses the duplicate. This keeps the incident queue clean during deployment-related noise spikes. The incident.io product update video covers how often alerts coalesce into groups, which illustrates exactly why auto-resolve logic matters at scale.
"Using incident.io has made my life so much easier... the CSM/product-eng team solve issues quickly, and in a way that makes the product easier/better with each iteration." - Patrick B. on G2
Testing and validating your routing configuration
Before cutting over from Opsgenie, validate your Datadog routing configuration in three stages:
- Trigger a test alert using Datadog's Test Monitor feature and verify the webhook fires, appears in incident.io's Alerts tab, creates an incident, routes to the correct team, and pages the on-call engineer via push notification and SMS.
- Simulate an unacknowledged alert by triggering a test and not acknowledging it. After the primary escalation window passes, confirm the secondary on-call contact receives a page. Document this test as evidence for your security review.
- Track post-cutover metrics: alert delivery success rate (target 100%, per incident.io's stated uptime SLA for Alerts), false positive rate by service, and whether post-mortems publish within 24 hours. A rising false positive rate in the first two weeks typically means legacy Opsgenie policies were suppressing low-signal monitors that now fire unfiltered. Address these by adding evaluation windows or promoting the monitor to a composite condition, not by muting the alert permanently.
The on-call mysteries research report gives industry benchmarks for on-call rotation health, which helps you calibrate whether your post-migration alert volume is within normal range or signals a configuration gap.
A correctly configured routing stack, monitors keyed to SLIs, tags that drive consistent escalation, and a parallel-run cutover, turns the Opsgenie deadline from a forced scramble into a controlled migration that reduces your MTTR from day one.
Book a demo of incident.io to see a live Datadog webhook configuration and a full incident declared in Slack with real alert context: incident.io/demo. If you are mid-migration from Opsgenie, the Opsgenie migration guide includes a parallel-run checklist for teams migrating off Opsgenie.
Key terms glossary
Alert deduplication: The process of preventing duplicate alerts from generating separate notifications when the same underlying issue fires multiple times. Configured in incident.io's Alerts settings using deduplication keys.
Composite monitor: A Datadog monitor that combines two or more existing monitors using logical operators. Fires only when the monitor meets multiple conditions simultaneously, reducing false positives.
Escalation policy: A multi-stage notification sequence that pages a secondary responder when the primary on-call engineer does not acknowledge within a defined window.
Investigations: incident.io's product that analyzes telemetry, code changes, and past incidents to surface likely root causes and draft fix PRs, automating up to 80% of incident response.
SLI (Service Level Indicator): A user-facing metric used as the basis for alert thresholds, such as HTTP 5xx error rate or P99 latency. Preferred over raw resource utilization metrics for on-call monitors.
Scribe: incident.io's AI note-taking feature that transcribes incident calls in real time and captures key decisions, enabling post-mortems to auto-draft from the captured timeline rather than reconstructed Slack scroll-back.
Timeline capture: incident.io's automatic real-time record of every status update, role assignment, and decision made during an incident, used to auto-draft the post-mortem.
Unified service tagging: Datadog's standard three-tag schema (env, service, version) that ties metrics, traces, and logs together and enables metadata-based alert routing.
FAQs

Tom Wentworth
Chief Marketing Officer
See related articles
Introducing Investigations, powered by Nexus.
Today we're launching Investigations: agentic root cause analysis that starts the moment you're paged, figures out what broke and why, and works with your team through to resolution. Here's what we built, what's powering it, and why it took some time to get right.

August 5, 2026
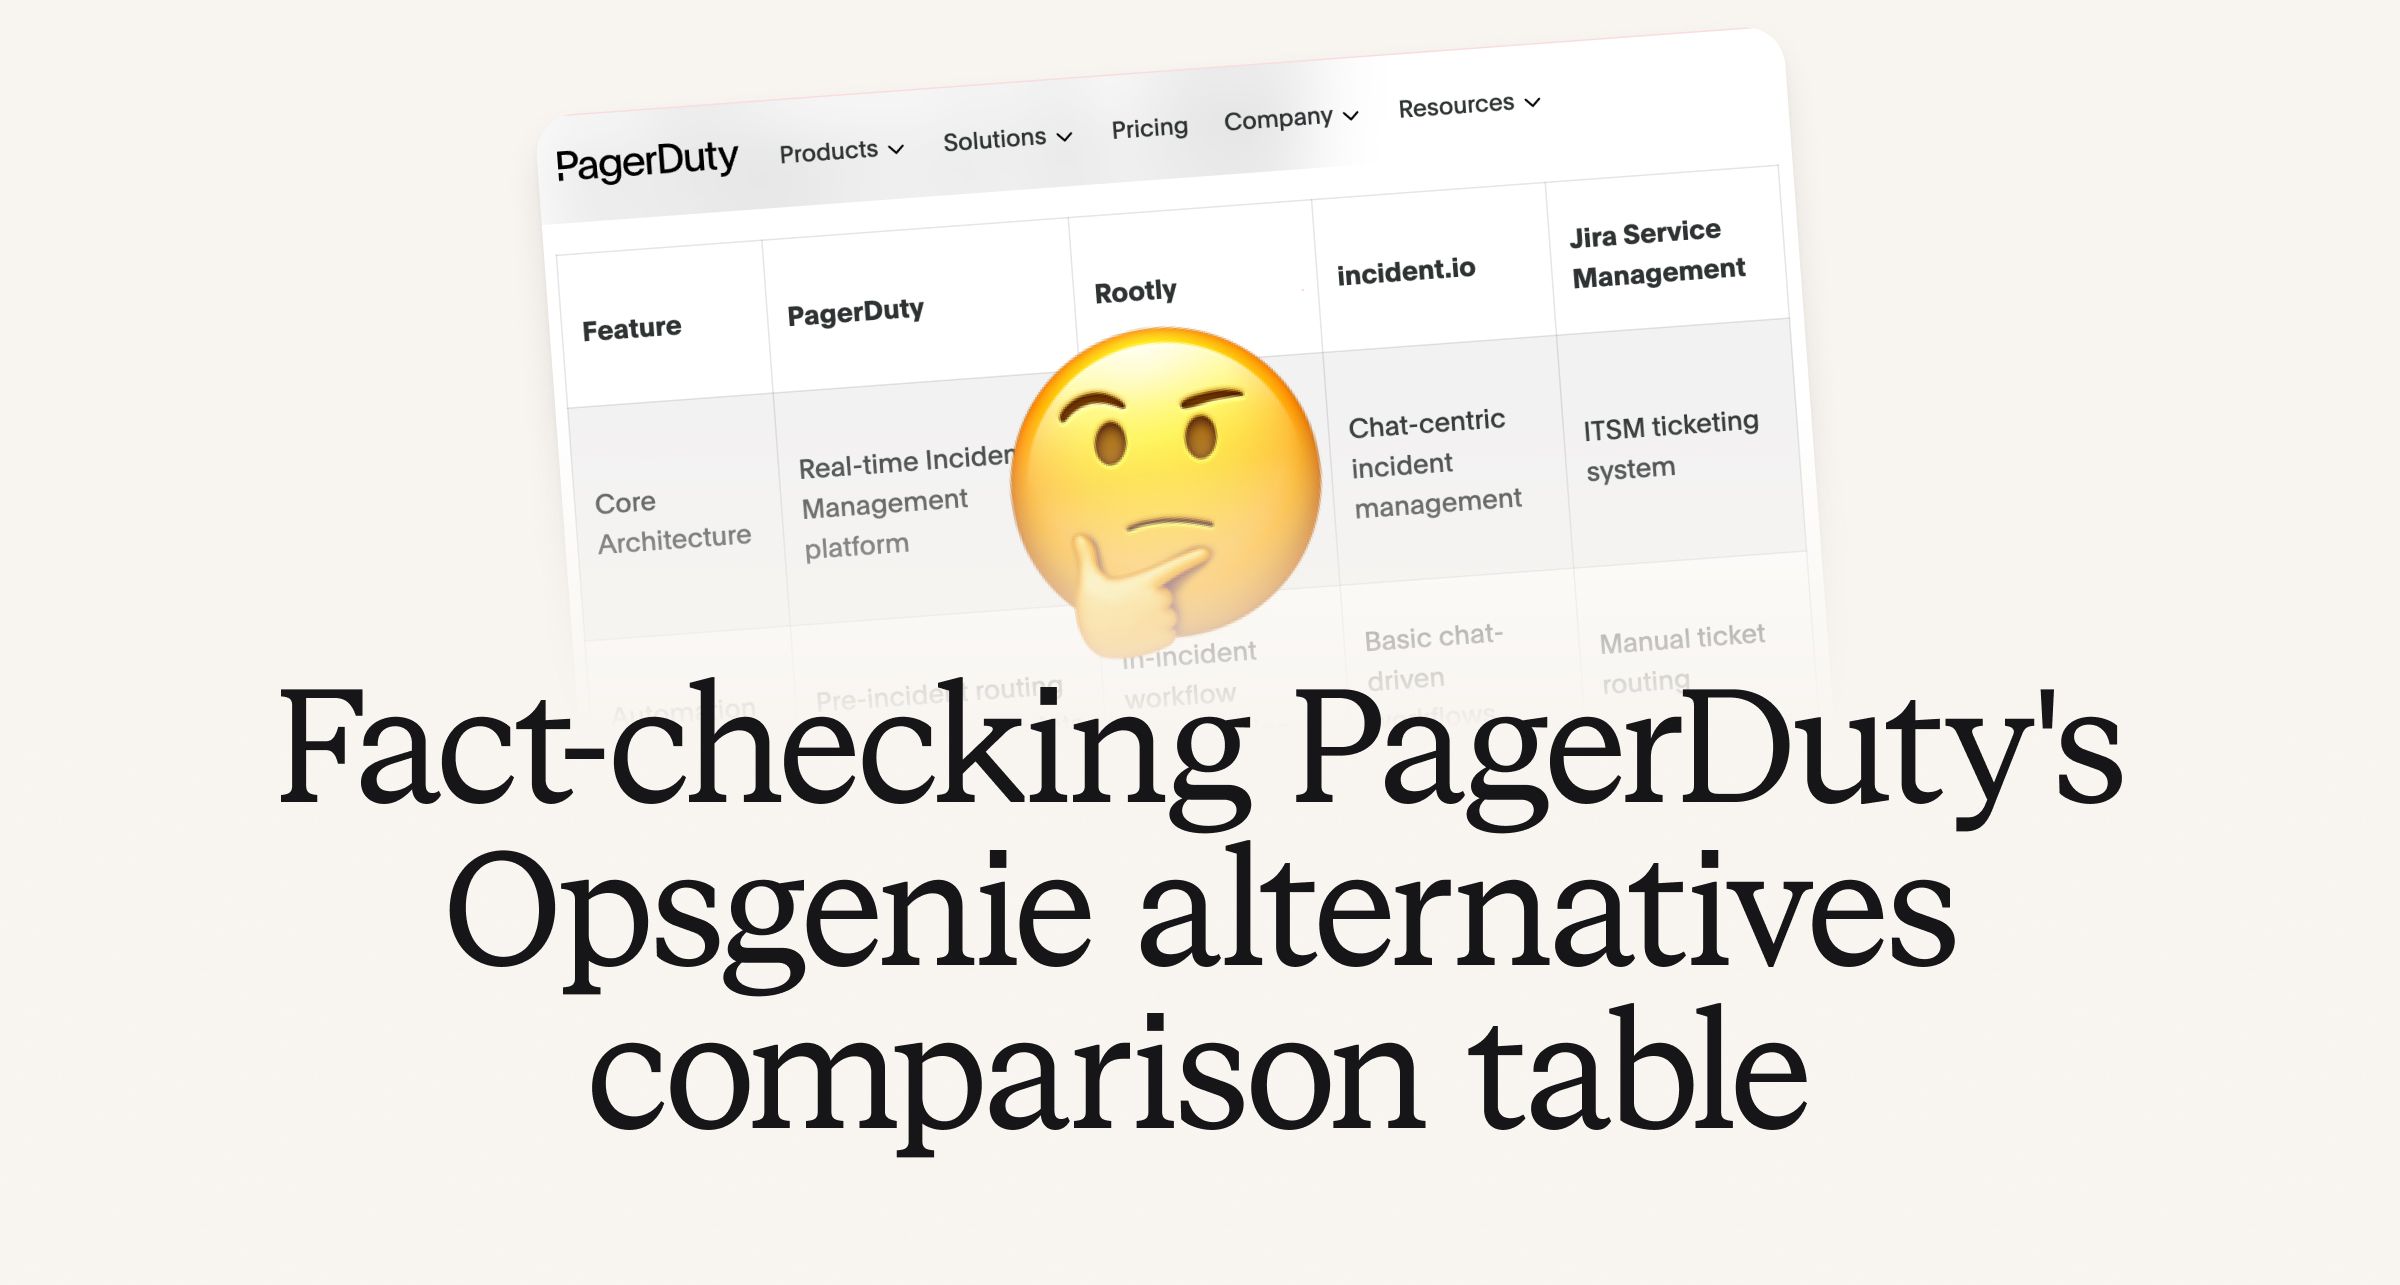
Fact-checking PagerDuty's Opsgenie alternatives comparison table
PagerDuty published a new comparison table about incident.io. Once again, it describes a product we don't recognize. So once again, we're correcting the record, row by row, with receipts.

July 28, 2026
Your genie is vanishing: introducing the Opsgenie rescue program
Today, we're launching the Opsgenie Rescue Program to make that landing soft: simplified migration and free overlap so you never pay two vendors at once.
July 9, 2026
So good, you’ll break things on purpose
Ready for modern incident management? Book a call with one of our experts today.
We’d love to talk to you about
- All-in-one incident management
- Our unmatched speed of deployment
- Why we’re loved by users and easily adopted
- How we work for the whole organization