Insights panel-level filtering
December 3, 2024

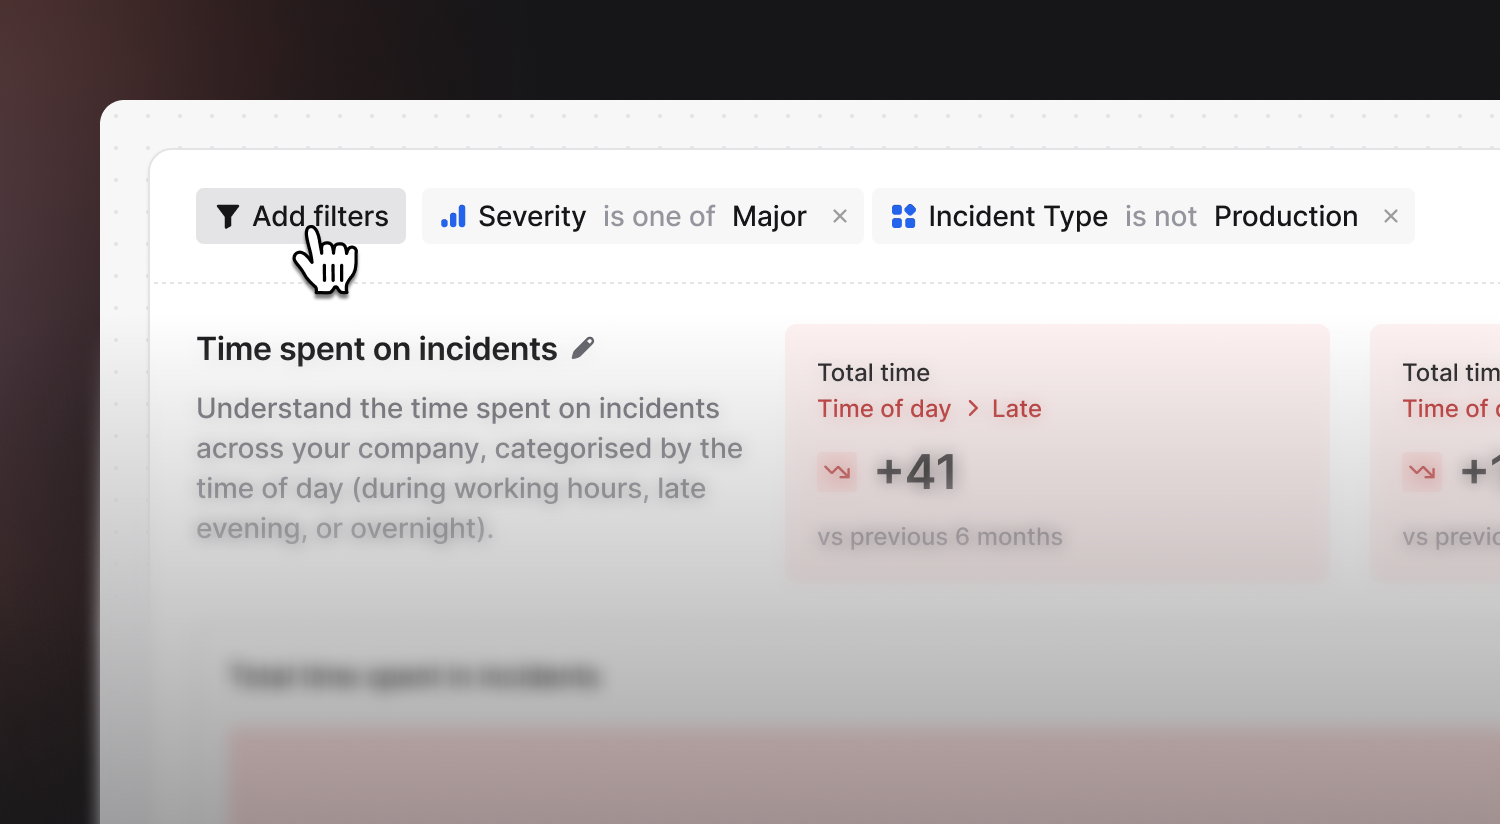
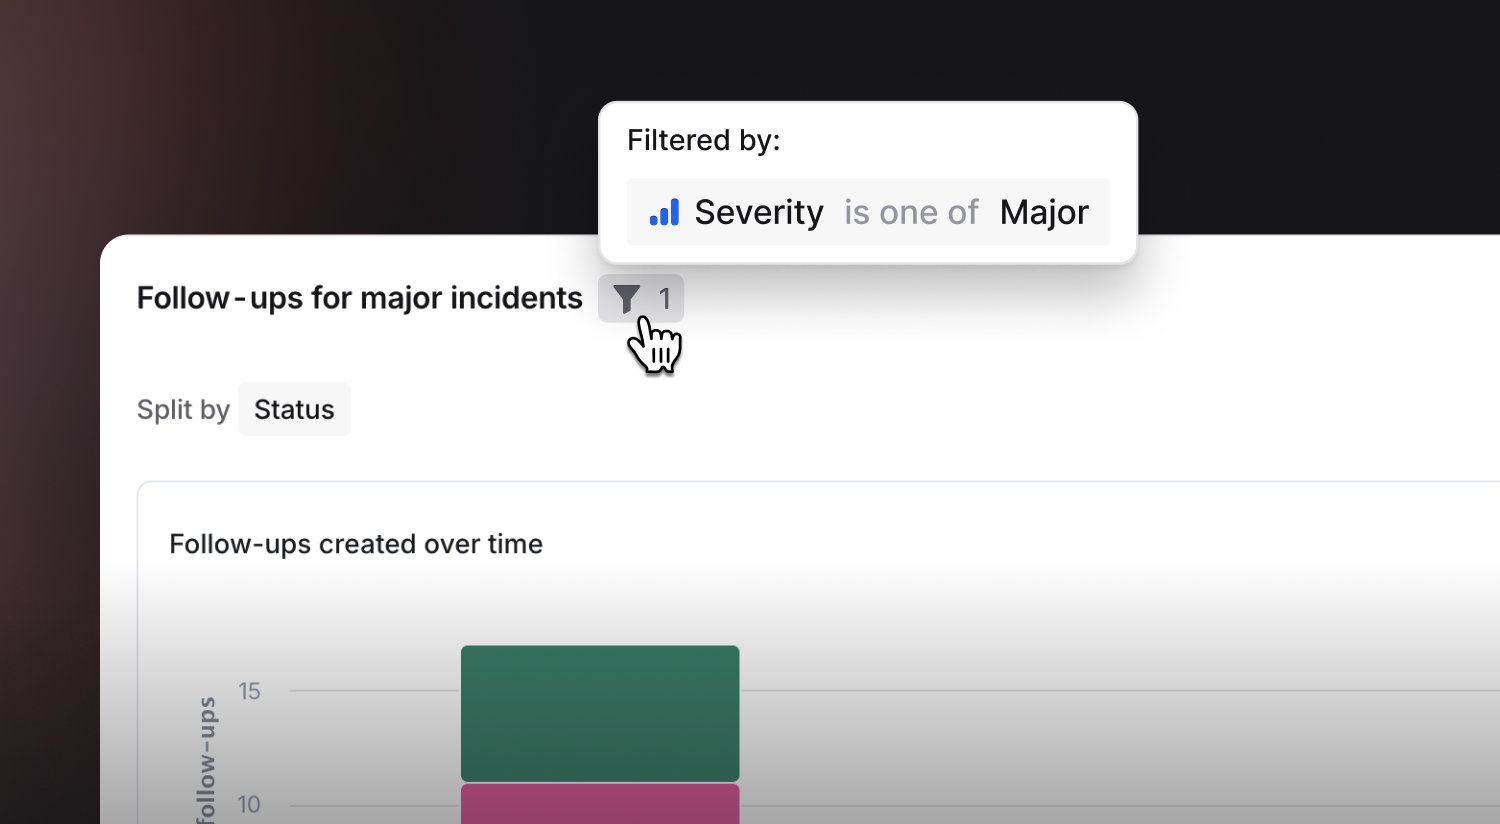
When we shipped Custom dashboards, we provided the ability to configure filters for the whole dashboard that would be applied to every panel. We’ve now expanded on that functionality with the ability to add filters that apply to only one panel.

This new feature opens up the ability to build a custom dashboard that displays the same chart multiple times but filters differently each time. For example, you can now build a custom dashboard that breaks down follow-up creation by status and shows a panel each for major and minor incidents.

Combined with the recently launched scheduled insights reports, it's now even easier to set up the custom dashboard that you want and have it automatically sent via email.
🚀 What else we’ve shipped
New
- Time spent in calls is now included in 'Workload' calculations within Insights
Improvements
- Fixes the scrolling of the empty state of the alerts page
- Now if you type
/incinto an incident channel, and then search forpagein the available commands, you'll be shown theescalatecommand
Bug fixes
- Fixes an issue where the alert timeline wouldn't tell you which user created an incident in some edge cases
- Fixes an issue where a single user might be shown multiple times in an escalation roll-up message if they'd be paged on multiple levels
- Fixes an issue where you might receive duplicate confirmation SMS messages about an acknowledgment being received
- Fixed an issue that caused certain insights panels to error when they were added to a custom dashboard
- Fixed an issue when syncing schedules to Slack groups when using Slack Enterprise Grid
- Fixed an issue with the "On call next" feature on the list schedules view
So good, you’ll break things on purpose
Ready for modern incident management? Book a call with one of our experts today.

We’d love to talk to you about
- All-in-one incident management
- Our unmatched speed of deployment
- Why we’re loved by users and easily adopted
- How we work for the whole organization


