Scheduled insights reports
October 29, 2024

A few weeks ago, we released custom dashboards that allow you to take insights from a core dashboard, customize them with filters, variables, and time ranges, and save them for easy viewing.
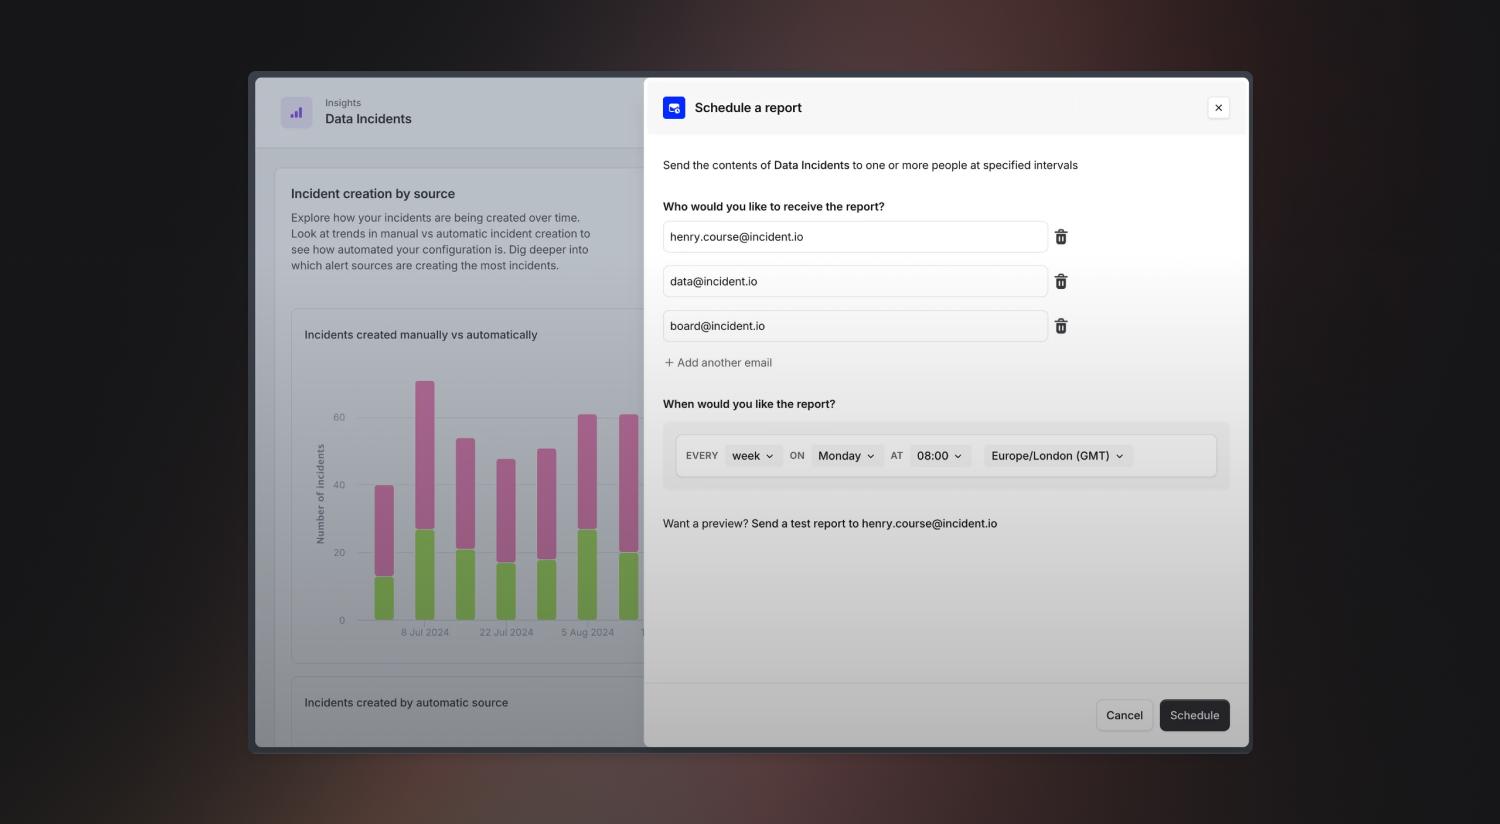
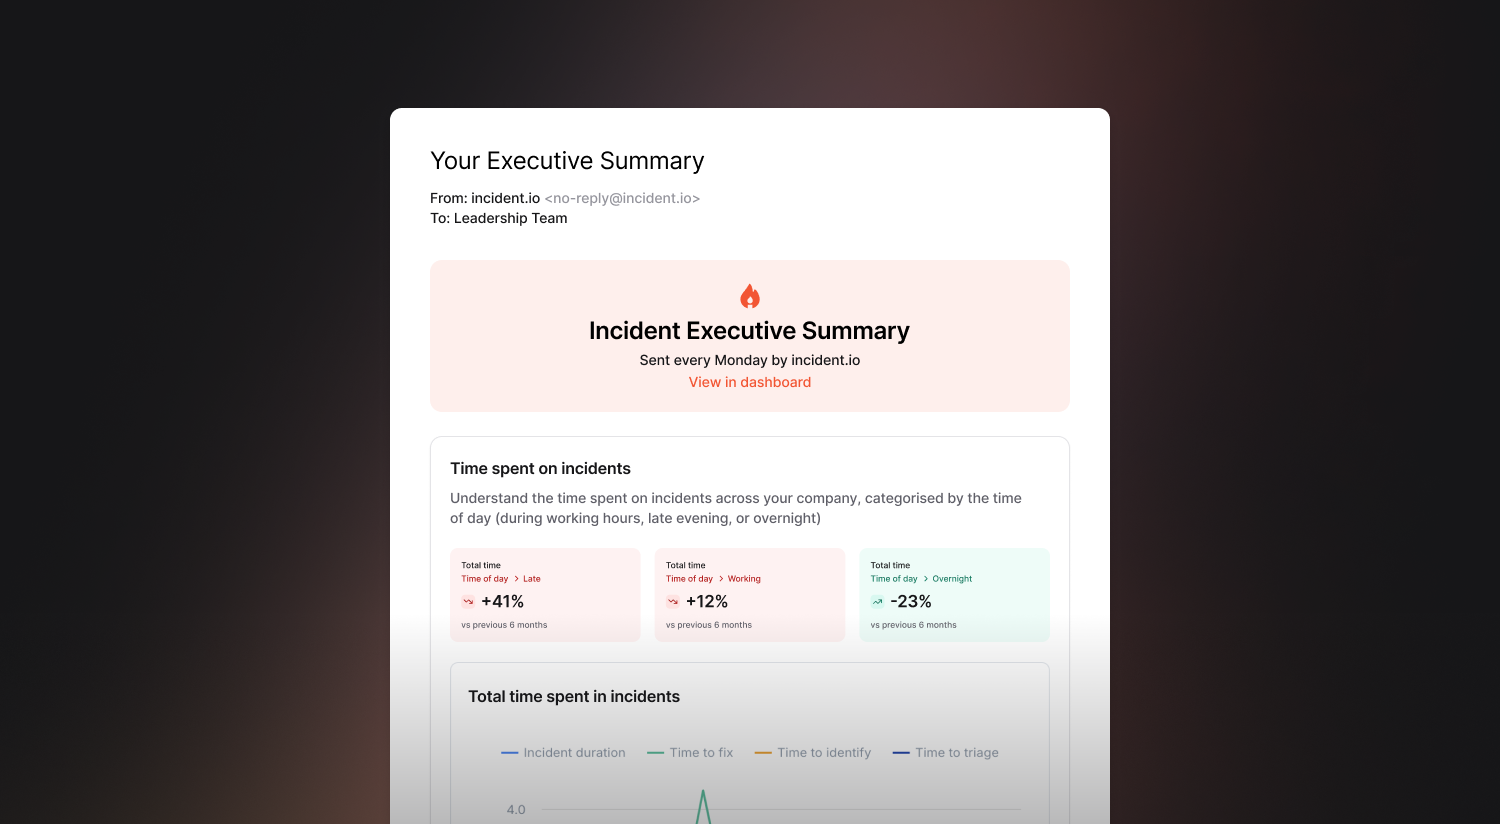
Today we're releasing scheduled insights reports that allow you to get the data in your custom dashboards delivered to your inbox on a regular schedule, in an accessible, easy-to-share format.

You can send any of your custom dashboards to as many people as you like, to email addresses inside or outside your organization.

With scheduled reports, you can create a monthly executive summary to send MTTX metrics to the C-suite or see how much time your team is spending on incidents in your inbox every week. This helps you stay on top of alert noise, track team productivity, and see how your incident response processes are improving.

Just navigate to a custom dashboard and click the Schedule button to try it out. Slack and Teams support will be coming soon.
🚀 What else we’ve shipped
New
- You can now use rich text in resolved messages as part of status page workflow steps
Improvements
- Status page alerting thresholds will capture outages in single regions
- The internal status page drop-down is now ordered alphabetically
- Cover request notification messages have been improved
- We've given the escalation path editor a lick of paint
Bug fixes
- We’ll now show trend tiles for all severities on the insights “At a glance” dashboard
- We won’t show the Opsgenie escalate workflow step as successfully run if no one was paged
- The priority of exported follow-ups can now always be changed
- If you have a custom name for debrief meetings, this will now be applied when configuring workflow conditions
- Fixed an issue where a schedule could show multiple times on an Escalation Path in the Catalog if it was used multiple times in the Escalation Path itself
So good, you’ll break things on purpose
Ready for modern incident management? Book a call with one of our experts today.

We’d love to talk to you about
- All-in-one incident management
- Our unmatched speed of deployment
- Why we’re loved by users and easily adopted
- How we work for the whole organization


