Who's on call? How Claude helped us calculate this 2,500x faster
April 28, 2026 — 20 min read

Schedules are a core part of any on-call system. In ours, they define who to page and when. But people use them in lots of other ways too: checking their next shift, asking for cover while at the gym, keeping a Slack user group up to date, or updating a Linear triage responsibility. For many of our customers, they’re one of the main ways they interact with our product, and as they’re such a foundational part of On-call, it’s very important they work well.
When you set up a schedule, you pick the people, set the shift length, and choose the point we start calculating from. When you view a schedule, we load that config and step through the rotation until we’ve built the time window you asked for.
Most of the time this takes just microseconds. But in a few cases, it can burn a lot of CPU figuring out who’s on call and when. Earlier this year, we sped up our schedule rendering engine. In a few hours, we made it thousands of times faster. Some of that came from analysing flame graphs, but the biggest wins came from Claude Opus 4.6 with just a couple of prompts (which I’ve included in full below).
How does rendering a schedule actually work?
When you view a schedule, there’s a lot of work going on behind the scenes.
You might think we load a fully materialised set of schedule entries from the database, but we actually use a hybrid approach. We pull historical information from the database, and calculate future entries in real time. Doing this on the fly means we don’t have to keep an ever-changing set of future schedule entries in sync, which would add plenty of complexity. For example, how far into the future should we calculate? How often can those entries change? Every override or schedule configuration change could cause a lot of churn in the database.
So instead, we pull historical entries from the database and combine them with expected entries as we project into the future. Internally, this lives in a schedule/render.go method. You give it a schedule ID and a time window. It returns a “final” schedule for that window, the overrides, and the underlying “scheduled” users who would be on call without overrides.
The basic flow
The renderer is comprised of four main steps:
- Fetch historic schedule entries from the database - if the time window includes the past, we show what really happened instead of rebuilding from config. You wouldn’t want to edit a schedule and then lose the ability to see who was on call last week, especially if you rely on that for compensating people for their time on-call.
- Calculate who’s scheduled to be on call during the time window - if the window includes the future, we calculate who will be on call and when. We iterate forward from
handover_start_at, using your shift durations, and apply any working-hour restriction you may have. For example, you might only want on-call Monday to Friday between 9 and 5pm, and rotate each week. - Apply overrides - we load overrides from the database and work out which rotation and layer they apply to. For example, I might be shadowing someone else on-call. We keep a shadow rotation with no-one on it by default, but I’ve overridden myself to be on overnight. This is where we’d apply that override.
- Tidy the results - we combine schedule entries and overrides, then apply optional flags like “merging entries” and “truncating the time window”. These flatten back-to-back shifts for the same user and trim entries that go outside the window.
All of this logic is around 1.5k lines of Go code. The tests are around 5k lines, even though we have utilities that let us describe lots of configuration test cases succinctly. So what’s so complex and problematic performance-wise? Most of the complexity is in calculating who's scheduled to be on call.
Let’s take an example schedule configuration:
{
	"users": ["rory", "lawrence", "leo"],
	"handovers": [{ "interval": 1, "duration": "hour" }],
	"handover_start_at": "2000-01-01T00:00:00Z"
}
If we wanted to find out who’s on call now, we’d iterate through every hour since the 1st of January 2000 and allocate each hour to the next relevant user. Today, that’s 230,610 iterations just to walk the handovers. You may be thinking there’s surely some multiplication that would make this simpler?
currentlyOnCall := users[int((now.Sub(handoverStartAt)/handoverLen)%time.Duration(len(users)))]You’d be correct, but that only works in very simple cases. For example, what if you have working hours, where you can define “rotate each week, and only during working hours”:
{
	"users": ["rory", "lawrence", "leo"],
	"handovers": [{ "interval": 1, "duration": "day" }],
	"handover_start_at": "2000-01-01T00:00:00Z",
	"working_intervals": [
		{ "weekday": "monday", "start_time": "09:00", "end_time": "09:00" },
		{ "weekday": "tuesday", "start_time": "09:00", "end_time": "09:00" },
		{ "weekday": "wednesday", "start_time": "09:00", "end_time": "09:00" },
		{ "weekday": "thursday", "start_time": "09:00", "end_time": "09:00" },
		{ "weekday": "friday", "start_time": "09:00", "end_time": "09:00" }
	]
}
Working hours
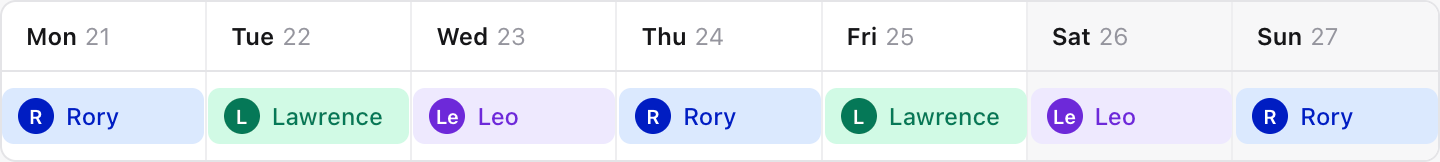
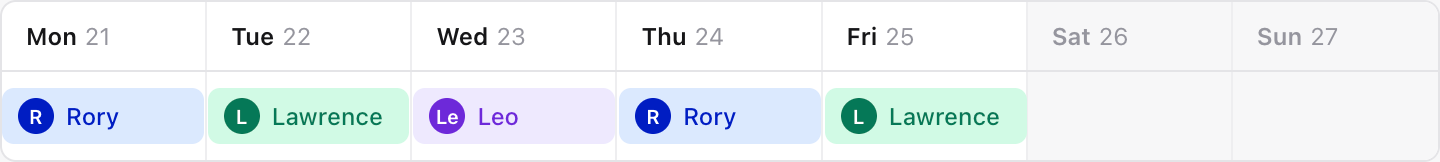
In this example, we rotate daily during the working days of the week. That means we can no longer just multiply our way into the future, because you’d end up with something like:
Monday: Rory
Tuesday: Lawrence
Wednesday: Leo
Thursday: Rory
Friday: Lawrence
Saturday: Leo     // hmm
Sunday: Rory      // hmm
Monday: Lawrence!
Now poor Lawrence is on call both Friday and Monday, rather than us skipping the weekend and correctly deferring Leo’s next shift until Monday.
Fair scheduling
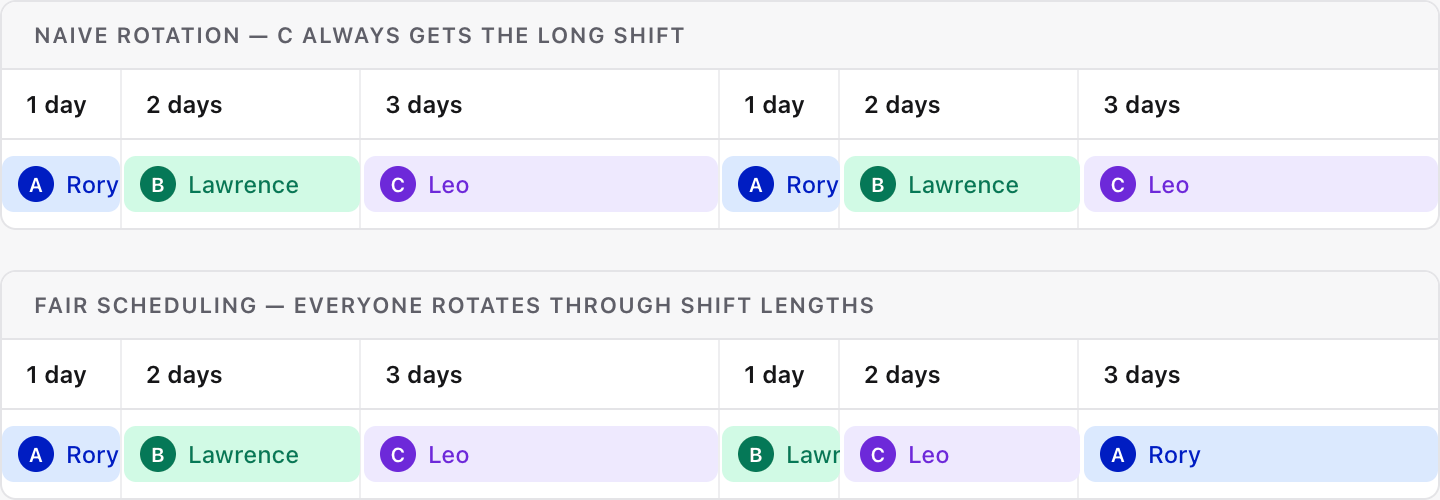
We’ve got a similar issue with what we call “fair scheduling”. You might have a schedule where you rotate people A,B,C round shifts of varied length - [1 day, 2 days, 3 days]. If you simply iterated each person around each shift, you’d end up with person C always on the 3-day shift, and person A always on the 1-day shift. With fair scheduling, as we cycle through the shifts, we also cycle through the users. So person A would do a 3 day, then a 2 day, and then a 1 day shift.
So, as you might imagine, there’s a lot of careful logic to get right here, and I’ve not even mentioned your typical date-time gotchas like daylight savings time. Each of these adds a layer of complexity, and together they make the renderer one of the more intricate bits of our codebase.
So what’s so slow then?
Given the complexity of schedule rendering, we’ve kept the code as simple as possible. But schedules still had us deep in traces and CPU flame graphs, scrutinising each line of code. Through that, we made a number of useful (and sometimes incredibly simple) fixes.
A date in 2092
We first saw high CPU alerts on our web pods a couple of years ago, after an on-call page. Someone had been mid-editing a timestamp in our override form and had temporarily entered a date of 2092. We were rendering many years of schedules and putting unnecessary strain on our pods.
At that point, we didn't have automatic sampling of CPU profiles, and we don't by default capture this type of work in our traces, which made debugging it harder than it should have been. We ended up manually profiling our pods through kubectl and tracked down the issue: many iterations through our applyWorkingIntervals function. From there, we identified a few problematic requests and added additional validation — fortunately this wasn't a use-case we needed to handle — along with explicit spans into key parts of the process.
We also made the renderer itself context-aware: even though we rarely spawn goroutines ourselves, every incoming HTTP request runs in one by default, and Go doesn't cancel them when the caller gives up, so until then our pods had been burning CPU on requests no one was waiting for anymore. Threading context through the render loop and checking ctx.Done() meant those goroutines stopped when the request did.
Loops within loops
Several months later, we spotted some of our schedule endpoints intermittently taking upwards of a second to respond. Digging into the traces we had now, we could see we were spending a lot of time in a function called SplitEntries.
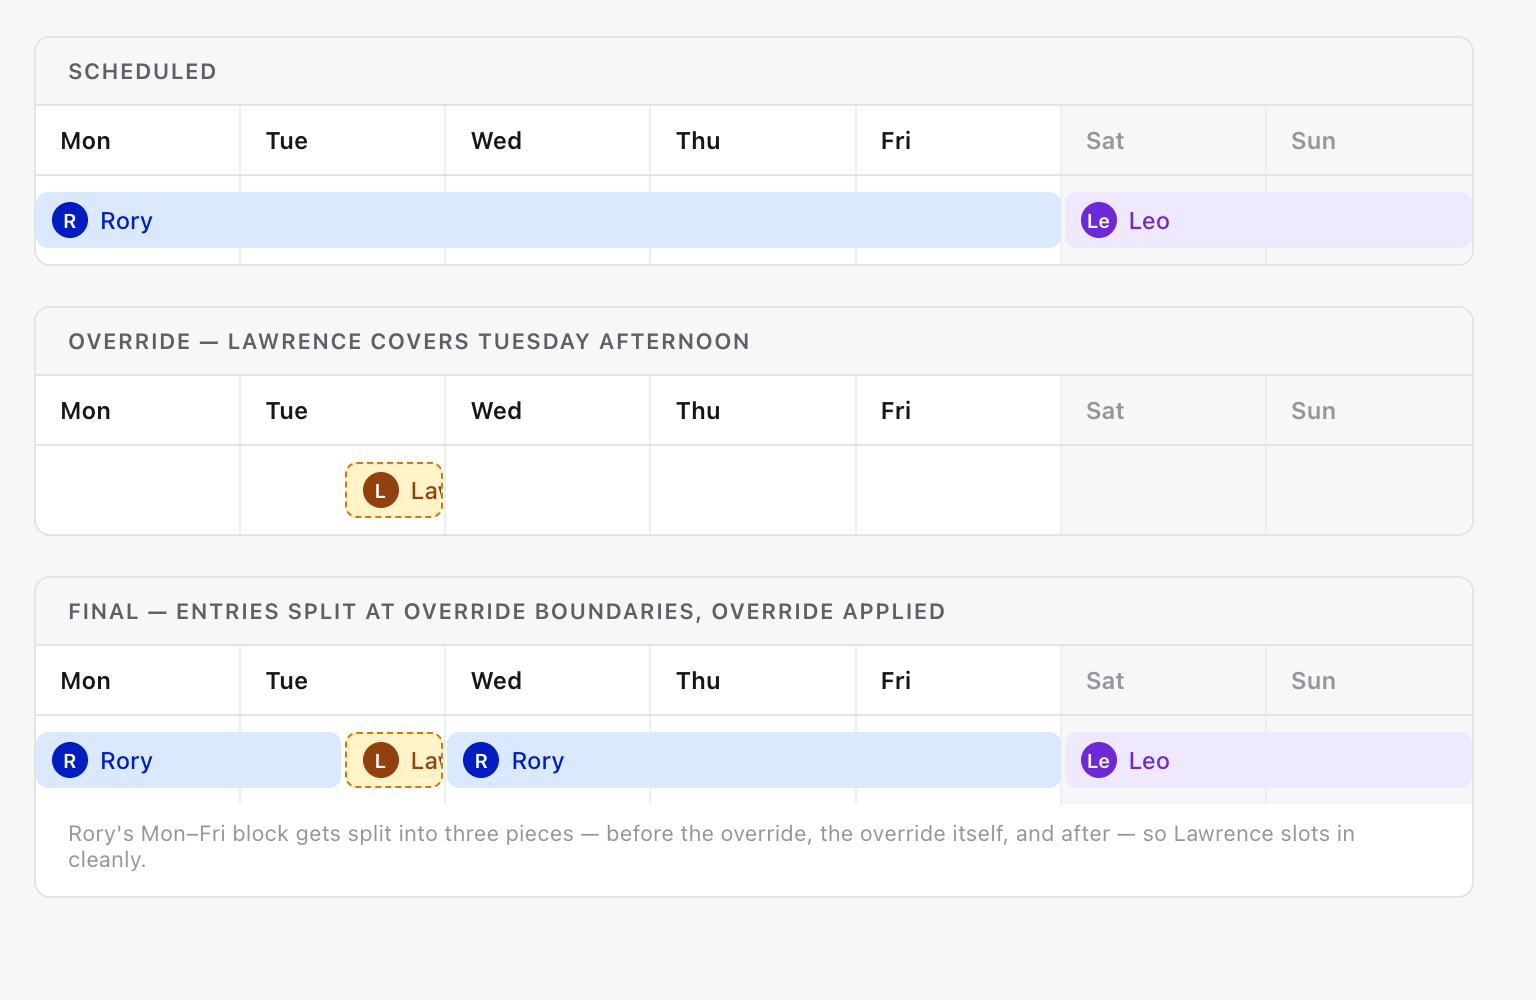
We use this method when applying working intervals and when applying overrides. It takes a list of entries and a timestamp to split those entries at, meaning you get back a list of entries where none overlap your split-marker. When applying overrides, we use it to ensure that all the entries and overrides share boundaries, so it’s easy to iterate over those boundaries and cleanly apply overrides on top.
A simplified version looks like this:
function splitEntriesAt(entries, splitAt):
    result = []
    for each entry in entries:
        if entry starts before splitAt AND entry ends after splitAt:
            # The entry straddles the boundary — cut it in two.
            result.append( copy of entry with endAt   = splitAt )
            result.append( copy of entry with startAt = splitAt )
        else:
            # Entry is entirely before, entirely after, or exactly on
            # the boundary — leave it alone.
            result.append(entry)
    return result
The problem is that we call this many times, sometimes inside loops for every working interval or every override you’ve defined in a period. When we dug into some of the slow schedule requests, we realised we were sometimes doing hundreds of thousands of iterations here in the worst case.
There was, however, a fairly straightforward fix, which was starting to feel like a coding interview problem. We built a new method that maintained entries in sorted order and used binary search to find the insertion point for each split. Given the same slow-to-render schedule, it improved from 850ms to 100ms.
We rolled it out behind a feature flag and enabled it for ourselves. Within minutes, an audit job we run — which checks every five minutes that the currently shifted users match what the renderer says should be on call — fired. The person on call had changed unexpectedly, so we turned the flag back off.
What we’ve found continually with schedule rendering is that debugging this stuff is hard. Often, we lean towards visually rendering the schedule on screen to help debug situations, because it’s very hard to scan huge blobs of JSON and spot oddities in timestamps (admittedly, AI is much better at this than we are).
In this case, it was a classic Go pointer trap. When creating the sorted collection, the original code used copy() to populate the new slice — but in Go, copying a slice of pointers just copies the pointers, not the structs they point to. So when the collection split an entry (modifying its EndAt to create the "before" half), it was also silently mutating the original entry that the rest of the rendering pipeline was still using.
The fix looked good locally. All tests passed, so it was merged and we tried turning it back on for ourselves. But once again, we saw oddities in our own schedules. The ‘scheduled’ users were changing unexpectedly, and timestamps would drift slightly depending on the time window you looked at. We turned it off again and spent days trying to work out where the bug was.
Scrolling through lines of JSON and comparing timestamps is hard. Worse, time keeps moving while you investigate, which makes reproducing issues maddening. We might see something awry, but replicating it in a test can be very difficult. We’d written many tests for the new code and it all seemed correct, but something about how it interacted with the rest of schedules was causing issues.
We eventually parked this after sinking a considerable amount of time into it. No customer had reported an issue, and we could manage the work fine, but we knew we’d need to revisit it at some point.
Death by a thousand UUID generations
Later that year, while debugging another incident, we were looking through flame graphs and spotted some of the now ‘expected’ work we were doing in schedules - see applyWorkingIntervals below.
We knew that applyWorkingIntervals and SplitEntries were being called many times, and that there were likely options for fixing it. But this time, we ended up looking at how we could make them run faster themselves.
At this point, we had automatic sampling of CPU profiles in Grafana, meaning we also had much better data to go off. In that, we spotted that much of the time spent in these functions was on methods like Weekday.IsSameDay and uuid.NewString.
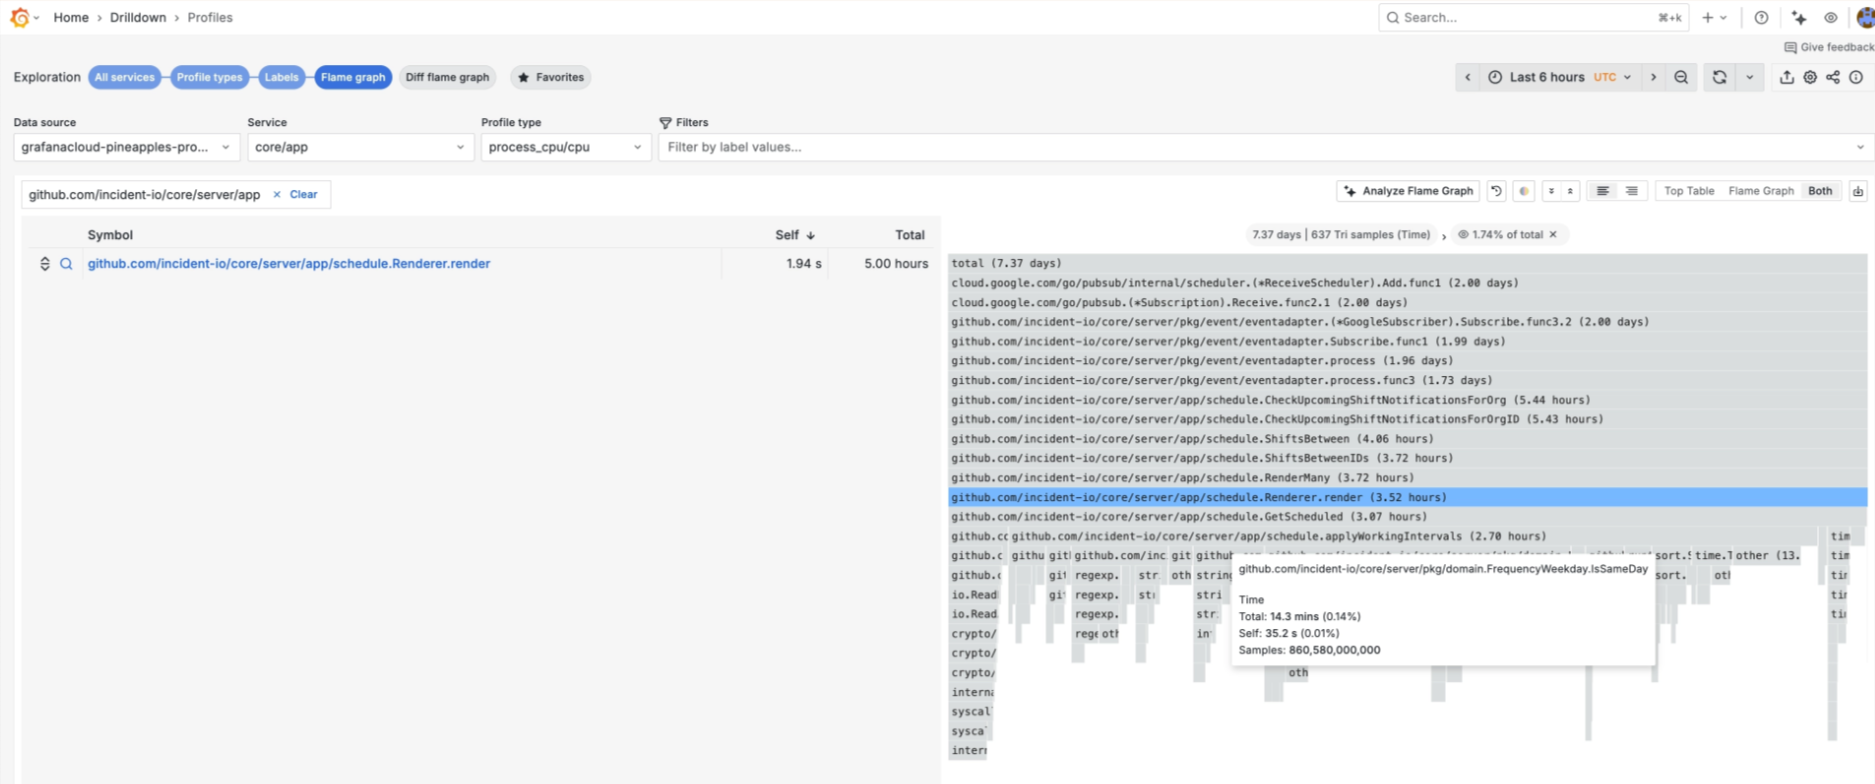
These were awfully simple fixes, and they highlighted that seemingly innocuous lines can be performance bottlenecks when called many, many times.
// Before
func (weekday FrequencyWeekday) IsSameDay(other time.Time) bool {
		return strings.ToLower(other.Weekday().String()) == string(weekday)
}

// After
func (weekday FrequencyWeekday) IsSameDay(other time.Time) bool {
    switch other.Weekday() {
    case time.Monday:
        return weekday == FrequencyWeekdayMonday
    case time.Tuesday:
        return weekday == FrequencyWeekdayTuesday
    // ...
    }
}
Just by removing some string work to compare weekdays (unfortunately Go’s time package had different casing from our FrequencyWeekday), we reduced the CPU usage of applyWorkingIntervals by 10%.
And the uuid case? When we were defining schedule shifts that project into the future, and aren’t stored in our database, we were giving them IDs just like those in the database for… correctness? But we never actually used this value. Removing it dropped another 6%.
Additionally, throughout rendering a schedule, we were doing a seemingly innocuous time.LoadLocation in a few hot code paths, which also took up 6% of the CPU profile. Instead, we now have a simple cached version of that on the schedule and just reuse that inside the iterations.
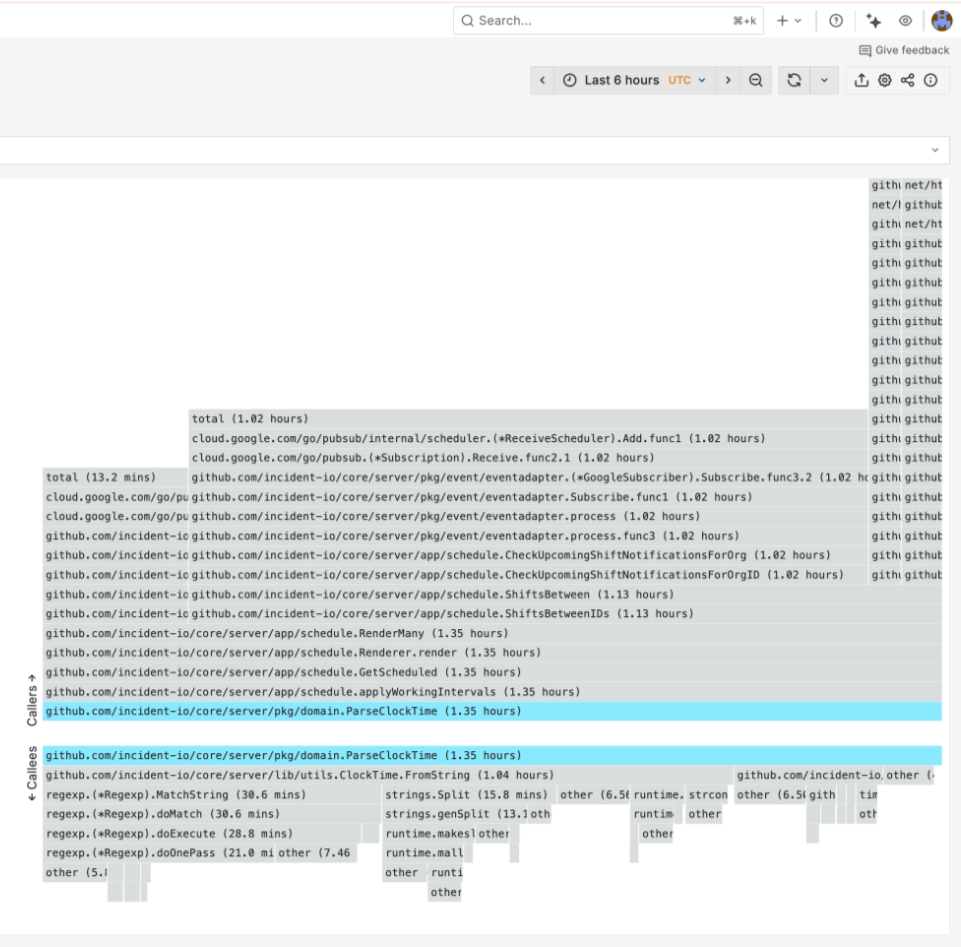
The last issue was that we parsed clock-time strings on every iteration of the working-hours loop. A schedule with five working intervals rendered over two weeks would parse the same "09:00" and "18:00" strings hundreds of times. We added a "hydration" step that parses everything once before rendering starts:
// Before: parsed on every iteration
startAt, _ := ParseClockTime(split, timezone, interval.StartTime)
endAt, _ := ParseClockTime(split, timezone, interval.EndTime)

// After: parsed once upfront, used directly
startAt := interval.StartTime.OnTime(split, timezone)
endAt := interval.EndTime.OnTime(split, timezone)
In total, through a number of small fixes that didn’t change the schedule-rendering algorithm at all, but instead changed some basic initialisations and comparisons, we made rendering about 40% faster. That felt like a win for what was fairly straightforward work once we’d identified it. But still, although this wasn’t something customers had reported, we knew it was running a bit hot for our liking, and that at some point we’d have to tackle the bigger fix.
Claude Opus 4.6
By early 2026, we had years of context on why this was hard, a fairly solid test suite, and some ideas on how to fix things. We’d also been heavily using Claude Code and other AI agents.
One morning on a whim, I pointed Claude at our CPU profiles and asked if there were mathematically smarter ways to work out who's on call without iterating through every handover period. I got it to build a V2 renderer with one rule: every existing test case had to produce identical output to V1. Here’s the prompt I gave it:
Schedule rendering performance has always been kinda slow. I'd love to look at our rendering method, historic fixes, smart ways we can 'fast forward' through time to avoid iterating through every week/hour/day since some handover start at years ago. We tried that before, but realised it's hard because of the way we have asymmetric intervals, but I wonder if there're actually just some equations we could use to build this.
Whatever we do, I think we'd want to build some new renderer that runs in dry run mode if a feature flag is enabled, and if the flag is enabled we run both the old and new one and compare the results, then eventually we switch over.
The core thing you need to think through and work out is how we can fundamentally avoid doing less work by having smarter algorithms to apply working intervals and iterate through rotations.
Within 20 minutes it had built a RenderV2 that we could wire in using a feature flag in dry-run mode, where it’d run both V1 and V2 and log out any unexpected differences, and then a ‘fully on’ mode that’d switch over for real. The intention here being that we’d be able to run it for all our schedules over a number of days and flush out any bugs — something we knew we’d have to do if we’d ended up re-writing render ourselves.
The new renderer was smarter in three parts:
- First, fast-forward time — instead of iterating from the handover start, divide the elapsed duration by the handover interval and jump straight there.
- Second, fast-forward allocation — reconstruct which user should be on call using a cheaper working-hours algorithm. The old approach scaled with the number of entries multiplied by the number of boundary points where overrides and working-hours transitions occur. The new one scales with the number of days in the window multiplied by the number of working-hour intervals.
- Third, render normally from the fast-forwarded position through just the visible window.
The code it produced looked just like code we’d have written ourselves, was very well documented and in places, actually easier to follow than our old iterations. It also built a fully working version of the binary-search SplitEntries that we’d struggled to get working. The issue it found was that in some cases, we were passing overlapping entries into the function. Its new implementation would only call split entries for a single layer of a schedule at a time, meaning this was no longer possible.
Before opening a pull request, I also got it to look at BigQuery and find any permutations of schedules that we might not have well tested in our existing tests.
Can you use the BigQuery CLI to query our schedules table and work out some variances in schedule configs — in particular odd working hours intervals, asymmetric handovers etc — and ensure we test around that too
It queried our production BigQuery data, found what schedule configurations actually exist in the wild, and generated test cases for each variation — 17 new cases, all confirmed to produce identical output between V1 and V2.
Rolling it out
We reviewed and merged the change, then let it run in dry-run mode over the weekend. For the vast majority of schedules, it ran without issue. But for a small handful, we started seeing differences.
Part of our product that we’ve been using internally is an AI-powered investigation tool — AI SRE — that can query logs, traces, and metrics. Claude Code can use it via MCP, so I was able to point Claude at our production telemetry and say, "Find all the V1/V2 mismatch logs and work out what's going on." It would query Loki for the diff warnings, pull the schedule configs from BigQuery, reproduce each mismatch as a local test case, diagnose the root cause, and propose a fix. Then I’d deploy the fix, and we’d go again.
The first thing it found was a discrepancy between V1 and V2 where entries were off by an hour. I got it to pull the diffs, fetch the schedule configs, and build tests to dig in. What it found was that we actually had a bug in our V1 renderer!
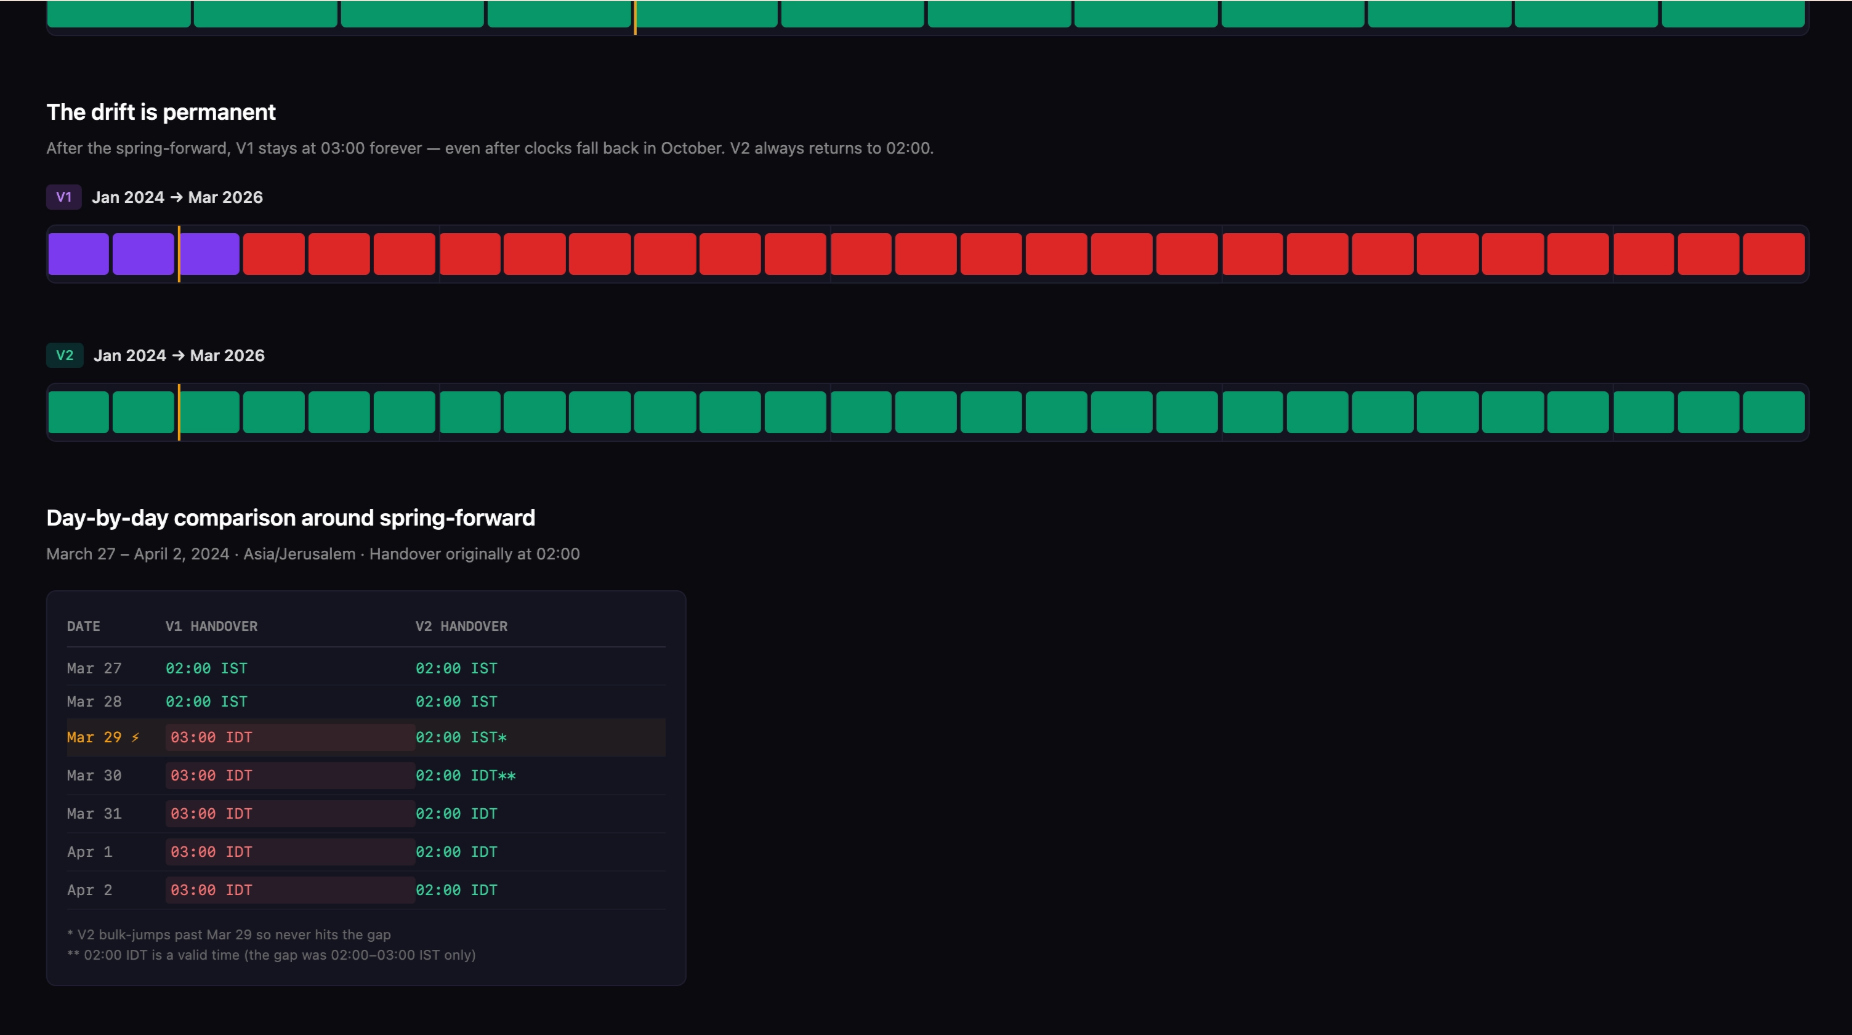
The bug was that if you had a schedule that rotated at, say, 2am every week, and a rotation landed during a daylight-savings-time spring forward, we’d use AddDate(0, 0, 7) in Go and correctly jump to 3am that day (as 2am doesn’t really happen). But we’d never revert back to 2am the following week, so schedules would keep rotating at the wrong time after hitting a DST crossover.
Because our new renderer batched up the jumps forward, it didn’t rely on the previous week’s date addition and instead jumped correctly to 2am. Claude identified the bug, then built a small HTML file to visualise exactly how it occurred. It implemented that fix, alongside a couple of others where V2 was incorrect, and before long we had no warnings being thrown by the dry-run.
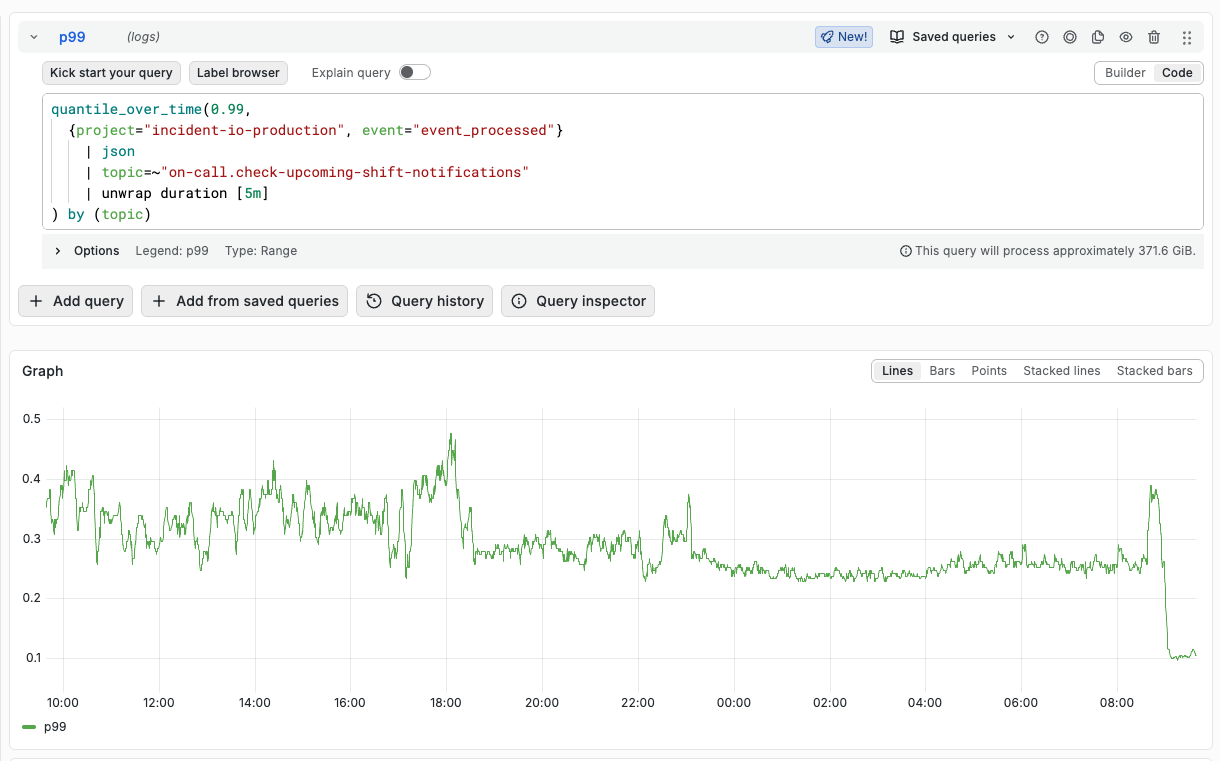
After a week without warnings, we switched fully over to the new renderer, and the numbers were clear: our 99th percentile schedule API response times dropped from 2 seconds to 200ms (including time spent loading schedules, overrides, etc). Running just the render method in tests showed the new renderer was ~2,500 times faster for complex schedules.
If you’re curious to learn more, start a free trial.

Rory Bain
Product Engineer
See related articles

Your genie is vanishing: introducing the Opsgenie rescue program
Today, we're launching the Opsgenie Rescue Program to make that landing soft: simplified migration and free overlap so you never pay two vendors at once.
 Tom Wentworth
July 9, 2026

De-risking a PagerDuty migration: the objections we hear most, and how to clear them
Often, switching on-call platforms isn't a technical challenge but a human one. In this post, we break down the seven objections engineering teams raise most often when considering a PagerDuty migration, and share exactly how to address each one.
 Eryn Carman
June 9, 2026

Customers over control: how we measure On-call reliability
Instead of thinking about reliability as an exercise in figuring out what we can control, and ignoring anything beyond that, we think about what we'll be really proud to offer to customers.
 Mike Fisher
May 28, 2026
So good, you’ll break things on purpose
Ready for modern incident management? Book a call with one of our experts today.
We’d love to talk to you about
- All-in-one incident management
- Our unmatched speed of deployment
- Why we’re loved by users and easily adopted
- How we work for the whole organization

