Service disruption on October 20, 2025
October 22, 2025 — 15 min read

When the internet goes down, our primary job is to help everyone get back up, as fast as possible.
Of the almost half a million incidents we've helped our customers solve, there are some which stand out for both their scale and impact. One of these happened on Monday, October 20, when AWS had a widely covered major outage in their us-east-1 region, from 07:11 to 10:53 UTC.
We’re hosted in multiple regions of Google Cloud and so the majority of our product was unaffected by the outage. However, we do depend on third parties for some aspects of our platform, who themselves are hosted in AWS, or have their own dependencies that are.
As a result, the outage impacted several of our key services, including on-call notifications, SAML authentication, and Scribe, our incident note taker.
Third parties aside, responsibility here unequivocally lies with us and we take that responsibility seriously. In this post, I’ll share more on our response, how and why we were impacted, what we learned, and what we’ve already done about it.
How our platform performed
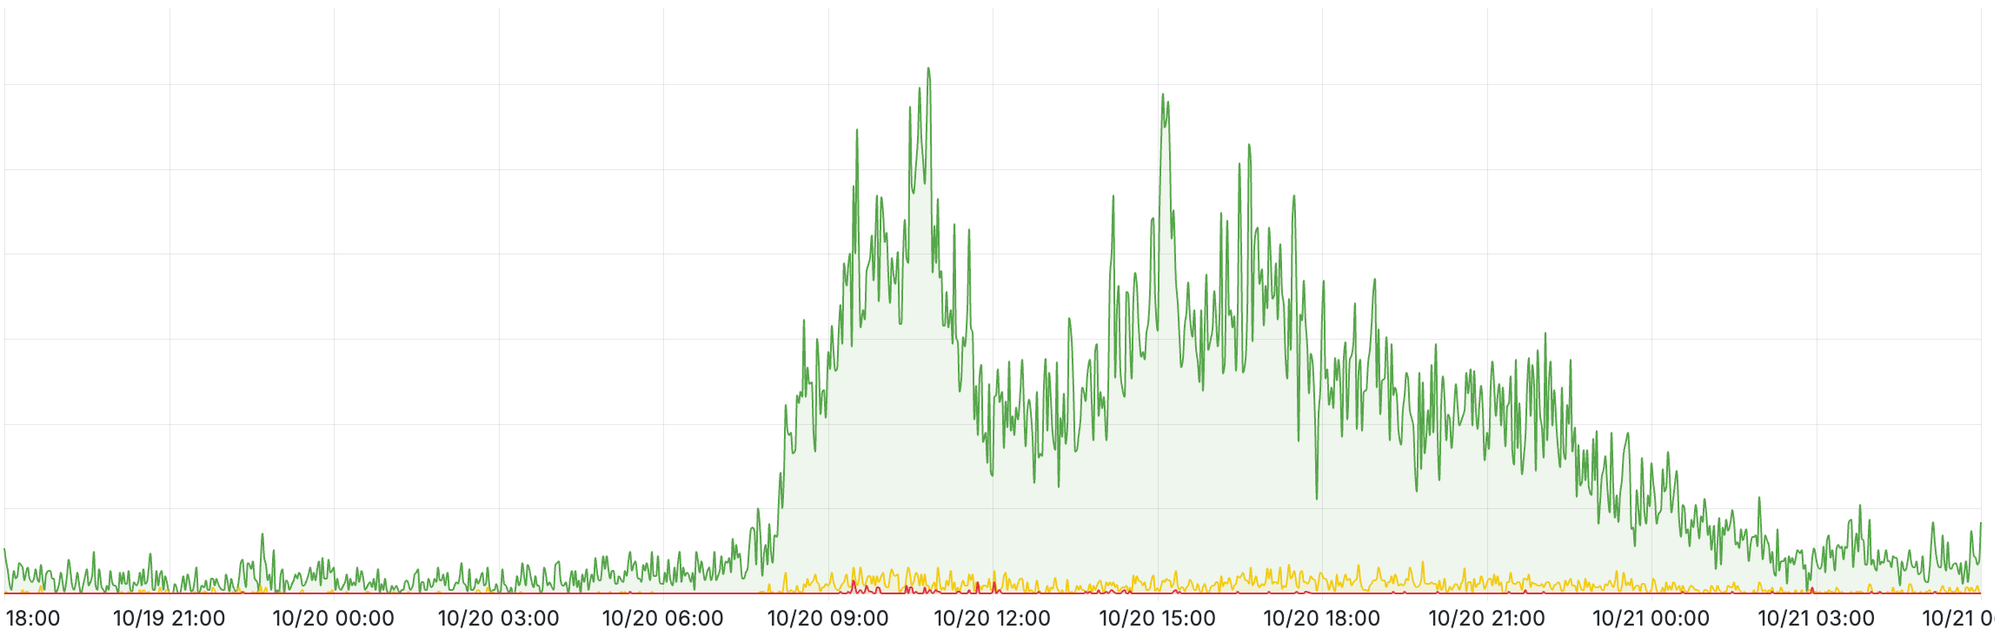
In the 24 hours after AWS first saw issues, 14,000 people collectively spent 12,500 hours (1.5 years!) actively responding to incidents with incident.io. We saw a 4x traffic increase to status pages as everyone fought hard to keep customers informed, peaking at around 4.5 million requests per hour and a significant increase in monitoring alerts, as systems went offline around the world.
We expect scenarios like this, and we intentionally design our platform to tolerate both integration failures and high load. We have controls, fallbacks and multiple providers in the event of failure, to ensure issues with one component or service don’t affect the rest of the platform.
Overall, we held up well, but we still experienced some hard-to-predict behaviour, and ultimately, compounding factors complicated our response efforts and meant we missed the mark in a few places. Let's review each in turn.
Scribe was unable to join incident calls
Our transcription provider was hosted in AWS and as a result, unavailable between 07:34 to 10:07 UTC and then again between 12:40 to 17:37 UTC.
This meant our AI note taker, Scribe, was unable to join new calls during these windows. Otherwise we saw no secondary impact on the platform, and for calls where Scribe was present, transcription worked as expected.
We worked closely with our upstream provider and were able to rework our implementation to dynamically transition workloads to a different AWS region in case of failure.
By 17:36 UTC, it was in place and Scribe was joining calls consistently - we’re now more resilient to similar outages in future.
Authentication was intermittently unavailable
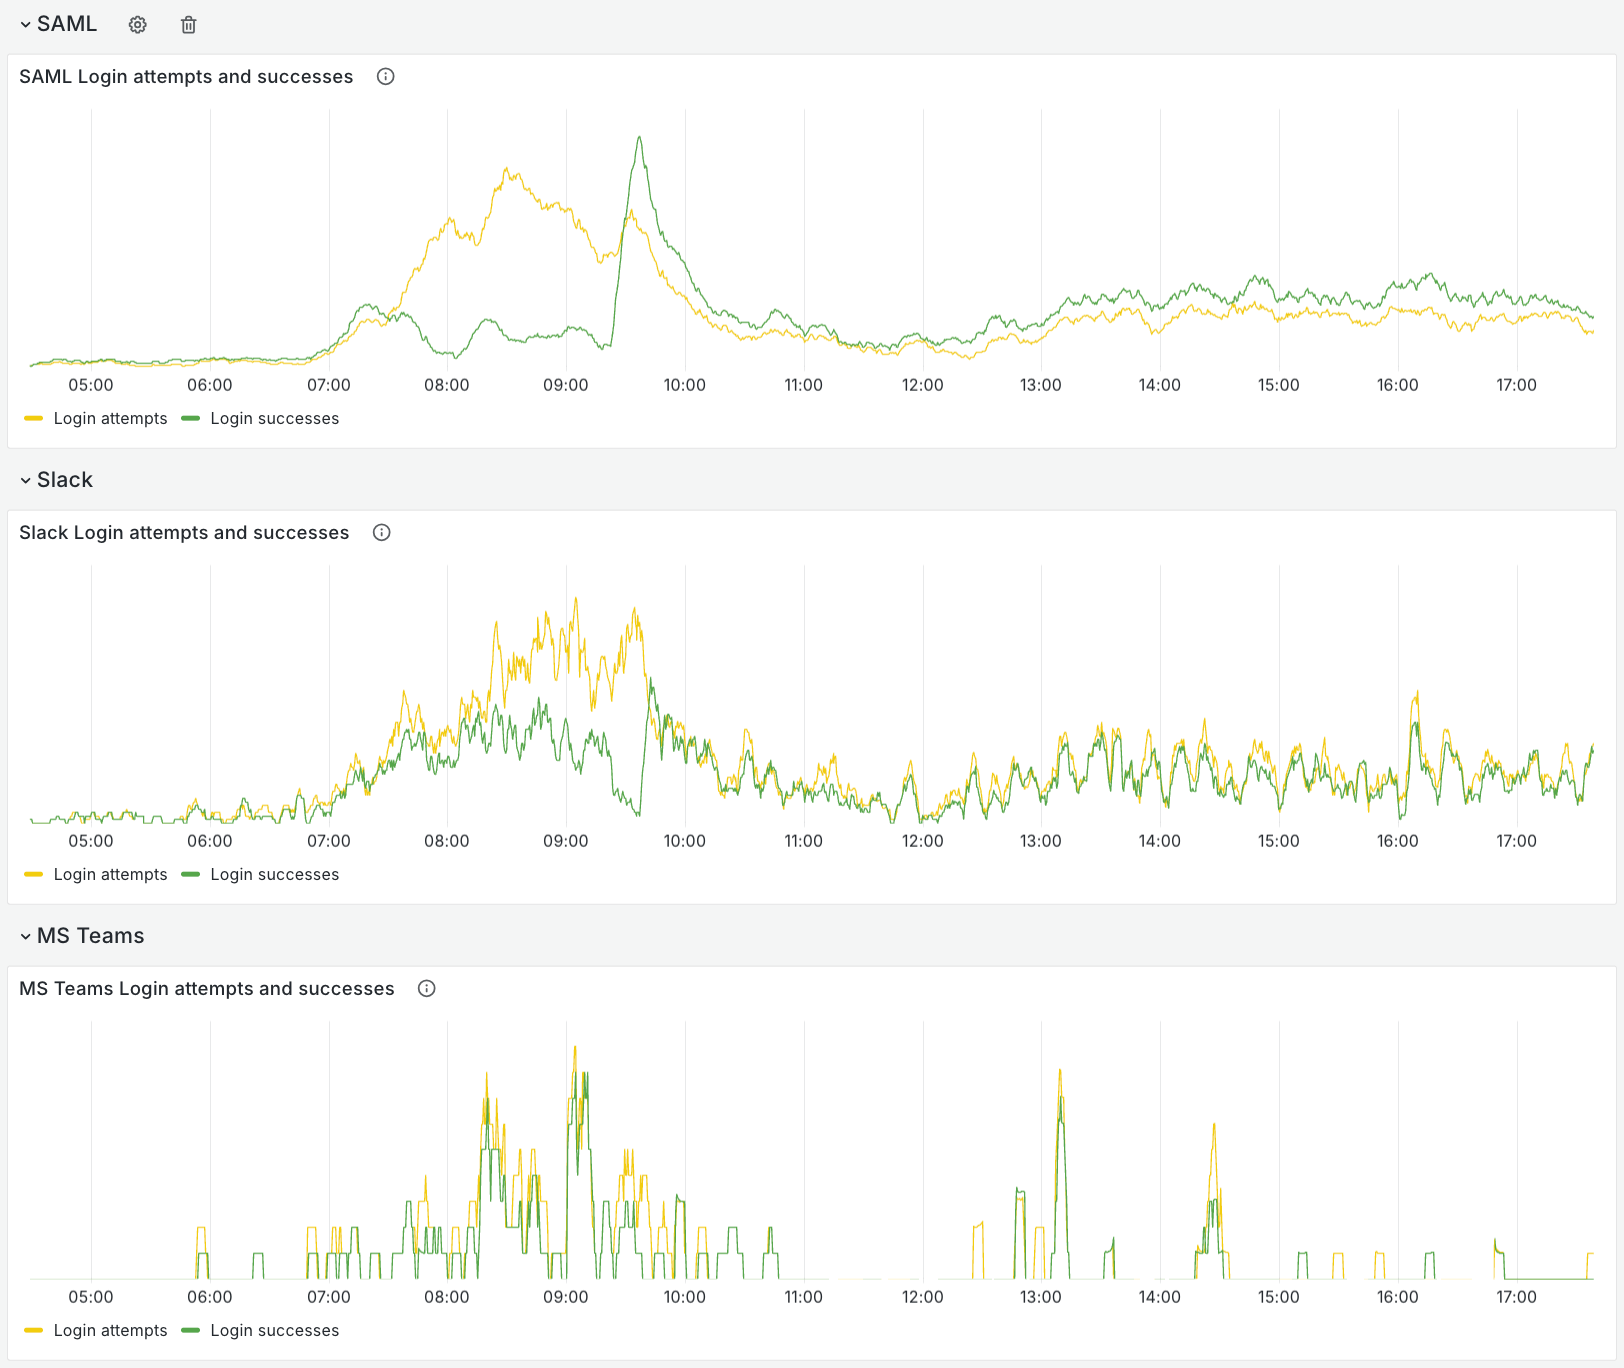
Our SAML authentication provider was also hosted in AWS and significantly degraded between 07:17 and 09:28 UTC.
Whilst we rely on a single SAML provider, we still support multiple authentication methods, so many users were still able to log in using SSO via Slack and Microsoft Teams initially.
Unfortunately, as the outage progressed, Slack’s platform also entered a degraded state, causing intermittent login failures.
Status Pages
One of the infrastructure providers we use for globally distributing our Status Pages also experienced instability for a brief period, and we saw a burst of errors, roughly 4% of our total traffic from 07:54 to 08:19 UTC.
We understand the criticality of status pages and take their availability seriously. Our provider is well known for their global infrastructure, and we take advantage of multiple regions, points of presence, and caching.
We also constantly run blackbox exporters on 9 regions across the globe to monitor availability and latency metrics. Through these, we confirmed errors affecting probes from europe-west3 and australia-southeast1 during the above 25 minute period. Provider metrics confirmed this and also that all other regions were unaffected.
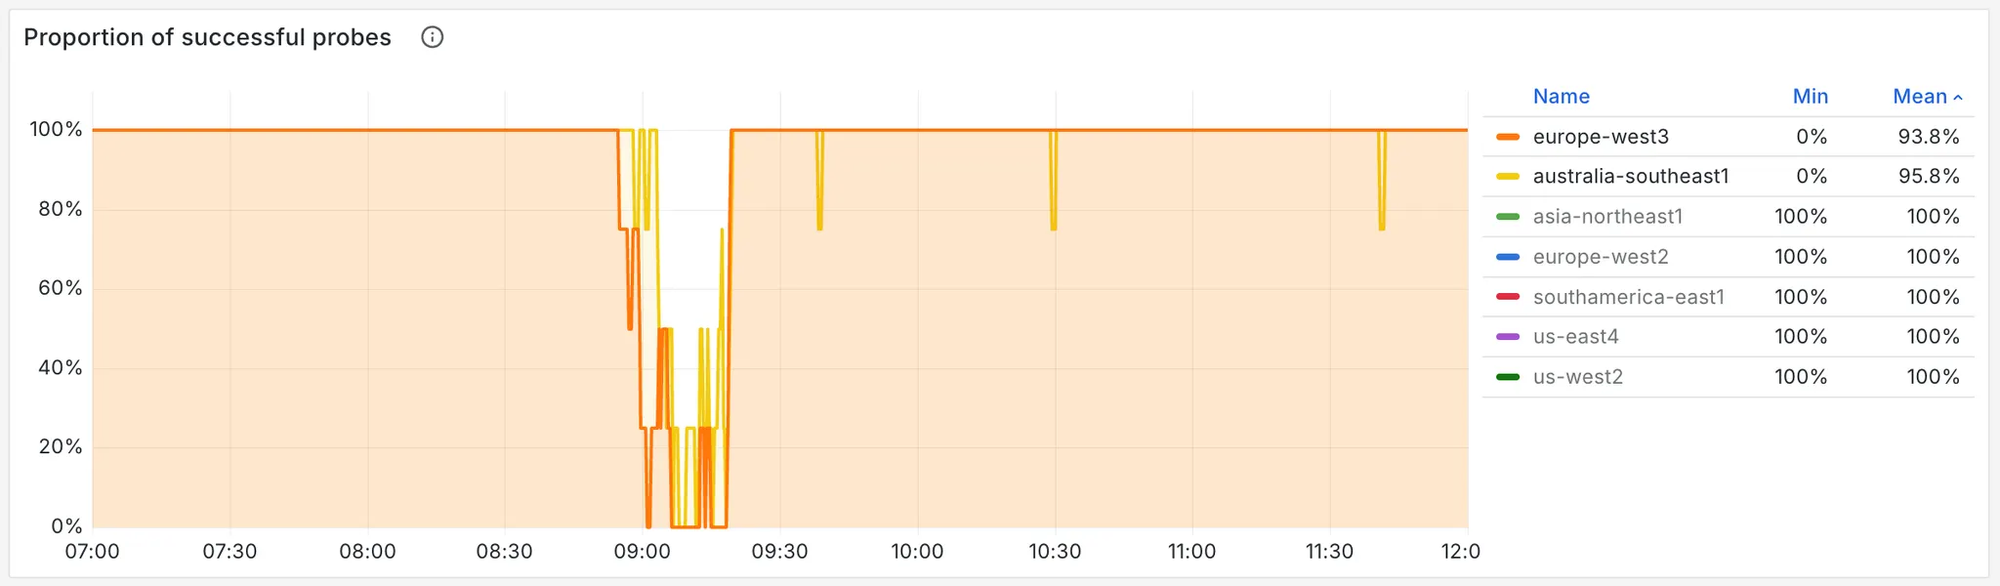
At 08:19 UTC service was fully restored, with no evidence that there was a long tail of failed requests. We’re still working with our provider to understand better why these two regions were so heavily affected vs others, given these regions are non-US based.
On-call notifications were delayed
Our telecom provider had an outage between 07:20 and 09:26 UTC, which delayed on-call notification delivery via SMS messages and phone calls.
Crucially, unexpected dependencies impacted several of our standard incident response options (discussed below) as well as other notification methods including Email, Slack, APNS (Apple Push Notifications) and push notifications on Android - something which shouldn’t have been possible.
Initial response
At 07:21 UTC, one of our on-call engineers was paged due to high error rates sending SMS messages and making phone calls. Shortly after, our provider confirmed the impact via their own status page.
Since on-call notifications are one of the most critical parts of our product, the incident was immediately escalated to the highest severity and the rest of the on-call team were paged to assist.
It was immediately clear the failing telecom requests, combined with our client retry mechanisms were resulting in notification jobs taking up to 30s to process.
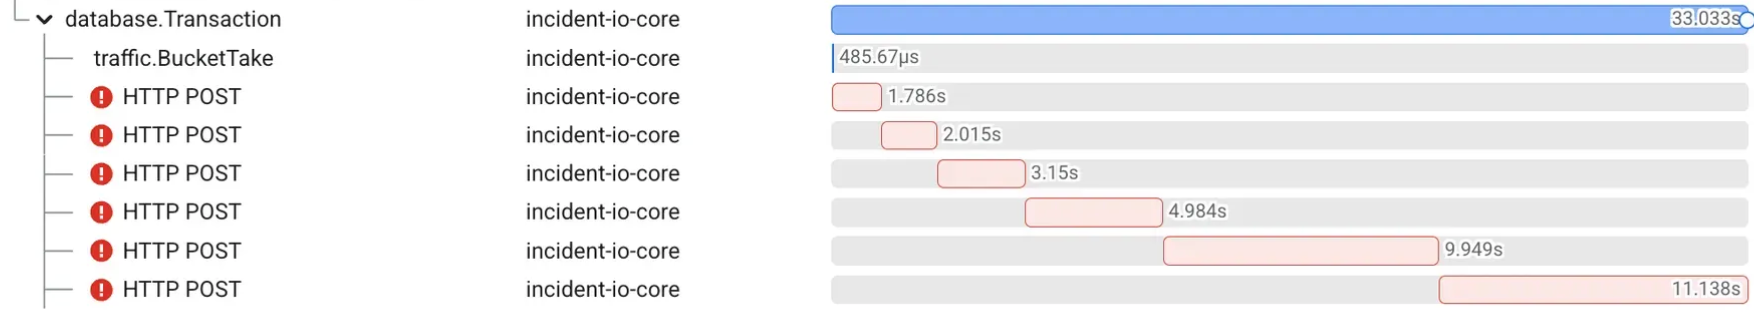
At 60x their normal duration, combined with up to 30x normal load, this was causing the notification queue to gradually increase in length. This impacted more than just SMS and phone notifications as the senders were sharing capacity between notification queues.
Removing SMS and phone notifications from the queue
Within 10 minutes of the first page, we had two PRs ready to merge, one that would temporarily no-op SMS and phone notifications during the outage, and another that would split the queues to ensure different notification types were handled by isolated worker pools.
Making it fast to deploy code changes like this is a cornerstone of our reliability strategy, allowing us to roll forward quickly. Once merged, it takes just 3 minutes for a change to release into production, so we expected a deployment would quickly resolve the issue.
Sadly, this was not the case. Our deployment pipeline failed, with the following error:
golang:1.24.9-alpine:
  failed to resolve source metadata for docker.io/library/golang:1.24.9-alpine:
    unexpected status from HEAD request to https://registry-1.docker.io/v2/library/golang/manifests/1.24.9-alpine:
      500 Internal Server Error
We use Google Container Registry to host our built docker images, which wasn’t impacted by the AWS outage at all, so we were surprised to see failures. We quickly realised however, that the issue actually lay with our base image:

Crucially, this resolved to a Docker registry image, and Docker runs their registry on AWS. Our build system needed access to a base image to unblock code changes, and we started working through a number of options.
First we reconfigured our container build to use mirror.gcr.io so we could fetch the base image from Google’s Docker mirror. This deployment change triggered a restart of our Buildkite containers, which couldn't start: they also needed access to Docker registry images.
We tried disabling auto-scaling and purged newer VMs from our Kubernetes cluster. Our hope was that the new Buildkite pods would be allocated to the old VMs, and be able to use their local image cache instead of going via the Docker registry. However, the daemon still made (failing) HEAD requests to Docker, even for cached images.
We tried to find suitable replacement image from other registries including Google Artifact Registry. Unfortunately we were unable to find an image which was verified (i.e: built by a known and trusted authority), up-to-date (i.e: included recent security fixes) and suitable (i.e: providing all the libraries and tools our build needed).
Ultimately, it wasn’t until Docker Hub partially recovered at 09:45 UTC that we were able to capture a base image and get our deployment pipeline working again.
We've already removed this dependency and reworked our deployment pipeline to be entirely self sufficient and based within GCP.
Scaling our Kubernetes deployments
After realising deployments were broken very early on, we set several other teams to work on taking alternative strategies to clear the backlog.
Given its criticality, we have a Kubernetes deployment tasked exclusively with running our escalation and notification system. The obvious first step was to scale up this deployment, as it would add capacity and allow us to clear the queue faster. So, that’s what we did.

You can see us adding replicas at 07:52 and 08:04 UTC, but due to the large amount of activity from the AWS outage, this system was already under atypical load.
The red shows the time spent by our workers acquiring escalations from our queue, where acquisition had began to represent a substantial amount of the total worker capacity. This acquisition is intended to be essentially ‘free’, and should be showing as no more than ~3% of this chart. During the incident it had crept-up to almost ~50% of available worker capacity.
Looking closer, we realised the burst of escalations combined with notification processing becoming slower had meant we had many escalation rows that we were now fetching and updating frequently. The index Postgres uses to find the next available escalation to work was filling with dead tuples, and as tuple visibility isn’t present in Postgres indexes, it was forced to scan old rows before finding the next escalation candidate.
This meant two things:
- Increasing our capacity to work escalations did not result in a net increase in escalation throughput (in fact, it decreased throughput)
- Acquisition had now become very expensive, so adding workers also increased pressure on our database
We managed to combat acquisition cost by decreasing our autovacuum thresholds and changing our escalation acquisition logic to avoid this type of churn.
These fixes mean we won’t be affected by this problem again, but the deployment pipeline issues meant we only released them to production late in the incident. Thankfully by this time, the earlier deployment fixes had been applied and so notifications had been stable for a while (albeit more expensive to process than they should be).
Redirecting notifications using our internal traffic management tool
Another team focussed their attention on controlling the notification volumes using our custom-built rate-limiter (called traffic). It's designed for exactly this situation, where the app is under pressure, we can’t deploy code, and our normal feature flags may not be operable.
We set the limits for phone and SMS notifications to 0 and waited. Soon after, the CLI had successfully applied the limits, but only to a subset. On investigation, we found that a recent usability improvement resulted in limits only being applied to the top 10 organisations by traffic volumes.
This was unexpected and unfortunately, the deployment pipeline being down as outlined above, meant we were unable to revert the change until our deployment pipeline was back up (at which point, the issue was immediately resolved).
What we learned and next steps
For outages like this, where so many products and services end up having issues at once, there are always a lot of lessons to be learned.
One key theme we’re hearing from many people this week, and is reflected in our own experience, is how easily third party provider risk can run much deeper than you expect, and even with numerous safeguards and playbooks in place, can still make failure modes incredibly tricky to predict.
While we regularly run game-days and pressure test our systems, nothing quite comes close to replicating the unpredictable cascade of infrastructure, upstream and downstream failures that a high profile cloud provider outage of this magnitude generates.
We’ve already taken a lot of lessons from this, and have applied many of them to prevent a situation like this from occurring again. Things we have already done so far include:
- On deployments:
- Removed the implicit dependency on Docker Hub and consolidated all direct and transitive build and deployment dependencies
- On Scribe
- We added full region switching capabilities via the third-party provider to allow us to react better to regional failures. We'll also be looking at making failure modes much clearer.
- On telecoms redundancy
- Ensuring we have multiple providers in different clouds and regions was already on our roadmap and is currently being actively worked on. The timing here was therefore particularly painful, but we'll ensure this gets even more focus in the short term, and is rolled out as soon as possible.
- On escalations:
- We optimised escalation acquisition to reduce table churn (lowering dead tuples) and put more sensitive alerting thresholds in place
- We applied aggressive autovacuum settings to prevent dead tuple build-up
- We split worker capacity for notification sending from the escalation worker system and segmented all notification senders by provider
- We reviewed capacity posture and have pre-emptively scaled several of our deployments to better handle burst traffic for "AWS us-east-1 outage" scale
In addition to the above, we're continue to review our response and systems in more depth and make further improvements over the next few weeks.
We’ve shared this write-up to explain how we were impacted by the outage, and hope some of the lessons we’ve learned can be useful for others.
However, we also know that this write-up and the steps we’ve taken can’t make up for the fact we ultimately could still have done a better job for customers on Monday, and we’re really sorry for the disruption.
If you have any questions, please do reach out to support@incident.io, or directly to me via pete@incident.io.
---
Update: We optimised for getting our original report out quickly. At the time, our investigation into Status Pages was ongoing. Once complete, a section detailing our findings was added on 27/10/25.

Pete Hamilton
Co-Founder & CTO
See related articles

Your genie is vanishing: introducing the Opsgenie rescue program
Today, we're launching the Opsgenie Rescue Program to make that landing soft: simplified migration and free overlap so you never pay two vendors at once.
 Tom Wentworth
July 9, 2026

De-risking a PagerDuty migration: the objections we hear most, and how to clear them
Often, switching on-call platforms isn't a technical challenge but a human one. In this post, we break down the seven objections engineering teams raise most often when considering a PagerDuty migration, and share exactly how to address each one.
 Eryn Carman
June 9, 2026

Customers over control: how we measure On-call reliability
Instead of thinking about reliability as an exercise in figuring out what we can control, and ignoring anything beyond that, we think about what we'll be really proud to offer to customers.
 Mike Fisher
May 28, 2026
So good, you’ll break things on purpose
Ready for modern incident management? Book a call with one of our experts today.
We’d love to talk to you about
- All-in-one incident management
- Our unmatched speed of deployment
- Why we’re loved by users and easily adopted
- How we work for the whole organization

