Use these seven incident response metrics to better understand the efficiency of your response processes
March 20, 2023 — 11 min read

In the world of incident management, learning can be hugely impactful.
But we don’t mean that you should abandon all of your other priorities and focus on learning from incidents over everything else. Remember, at the end of the day, your focus should be on delivering value to customers.
Used strategically, incident response metrics can help teams build an effective incident response lifecycle to decrease risks, optimize response strategies, and strengthen overall system resilience.
In this article, we'll share seven incident response metrics that your organization can focus on to help gain a better understanding of your response processes and highlight any areas of improvement or opportunities for investment.
We'll also share how incident.io’s Insights dashboard can help you glean many of these insights out-of-the-box, with pre-built dashboards showing a host of incident response metrics.
The role of incident response metrics
By tracking and analyzing incident metrics alongside incident management best practices, teams can identify trends, assess their impact on operations, and fine-tune their approach to mitigating threats.
For instance, consider an organization experiencing frequent Distributed Denial of Service (DDoS) attacks. Analyzing the incidents' patterns through detailed reporting may reveal that peak occurrences coincide with high-traffic periods or particular regions.
These insights can allow responders to allocate resources or implement targeted countermeasures during those times proactively.
Leveraging these data-driven insights and incident response automation strengthens your organization's security posture while enabling you to keep improving your response process — ensuring you're always one step ahead of potential incidents.
Seven metrics to level up your insights into incidents
The metrics here can provide a pretty comprehensive picture of how your response processes are tracking. They can serve as a solid foundation for any business looking to optimize its incident reporting, and highlight any problem areas, functions that you may want to invest resources in, and more.
1. Uptime
Uptime, often measured as a percentage, represents the reliability and availability of your systems.
It directly impacts end-user experience and overall productivity. By tracking uptime in conjunction with incident status data, you can better understand how disruptions affect system performance.
For example, suppose your organization's e-commerce platform experiences frequent downtime during peak business hours. You also find multiple incidents involving server overload. Analyzing the correlation between these incidents and reduced uptime can alert you of areas needing improvements or additional security measures.
Maintaining high uptime should be a top goal when addressing all incident types—ensuring not only customer satisfaction but also safeguarding revenue streams by minimizing disruptions in critical services.
A win-win for everyone!
2. Escalation rate
The escalation rate refers to the percentage of incidents that require intervention from higher-level support teams or specialized experts for incident resolution.
A high escalation rate can indicate issues with incident triage, inadequate training, or insufficient resources at the lower support levels.
For instance, if your IT helpdesk consistently escalates security-related issues to your dedicated cybersecurity team rather than resolving them internally, it may signal a need for additional training in basic security protocols.
Organizations should invest in continuous education and upskilling initiatives to optimize response efforts and minimize disruptions caused by escalating incidents unnecessarily. Empower your staff with essential knowledge and free up specialized teams to focus on more complex challenges.
3. Cost per ticket
Cost per ticket is the average expense incurred by an organization for handling individual support desk or helpdesk tickets. They are generated for each reported incident. This metric considers factors such as personnel time, infrastructure costs, and any tools or resources needed to resolve issues. By keeping a close eye on cost per ticket trends, organizations can identify opportunities to optimize their response strategies and allocate resources more efficiently.
For example, if your analysis reveals that certain incidents consistently have higher costs due to lengthy resolution processes or specialized equipment requirements, you may need to reassess your approach to addressing these challenges.
Streamlining processes and investing in preventive measures can reduce the overall impact of future incidents on your budget while also ensuring a faster response time. The bottom line is that it benefits both your customers' experience and business operations.
4. Average incident response time
Average incident response time is the amount of time that passes between reporting an incident and addressing or resolving it. By monitoring the average time taken to respond effectively, you can identify bottlenecks in communication, staffing issues, or areas that require additional resources.
If specific types of incidents consistently have longer response times than others due to inadequate tools or expertise among frontline staff members, this insight highlights opportunities for improvement.
To optimize average incident response time and ensure prompt resolution, prioritize training programs - including developing skilled incident commanders - while investing in tools that streamline team communication channels. Faster resolution leads to greater customer satisfaction and reduced potential damages resulting from prolonged disruptions.
5. Mean time to acknowledge
The mean time to acknowledge (MTTA) is the average time it takes for a support or incident response team to recognize and acknowledge an incident. This metric is crucial because it reflects your organization's ability to promptly initiate the response process, which can significantly impact overall recovery efforts.
MTTA data can identify specific incidents that consistently take longer than others for acknowledgment. Usually, this is due to inadequate monitoring processes or miscommunication between teams.
To optimize MTTA performance, invest in robust monitoring tools and establish clear communication protocols within your teams. By ensuring swift acknowledgment of incidents, you're setting up a strong foundation for timely resolutions while minimizing potential damage caused by delays in addressing critical issues.
6. Mean time to resolution
Mean time to resolution (MTTR) is how long an incident response team takes to fully resolve and close an issue from the moment it's first reported.
You may find specific types of incidents consistently have longer MTTRs due to complex recovery procedures or a lack of expertise among support staff members. Therefore, you need targeted training programs or better resource allocation decisions.
Note that both average response time and MTTR focus on resolution time differently. Average incident response time refers to a simple average—adding up all individual incident response times and dividing by the total number of incidents.
On the other hand, MTTR takes into account not only successful resolutions but also factors like recurring or unresolved issues. MTTR focuses on quantifying overall effectiveness in resolving problems rather than just measuring raw durations.
7. Incidents over time
Incidents over time is a metric that tracks the number of reported incidents within a specific time period, such as days, weeks, or months.
For example, if your data analysis reveals an increasing trend in incidents targeting your organization's web applications during weekends or holidays when staffing levels are lower than usual, you may need to reevaluate resource allocation strategies for those times.
The underlying causes behind the fluctuations in these numbers can inform organizations on how to continually strengthen their defenses and infrastructure.
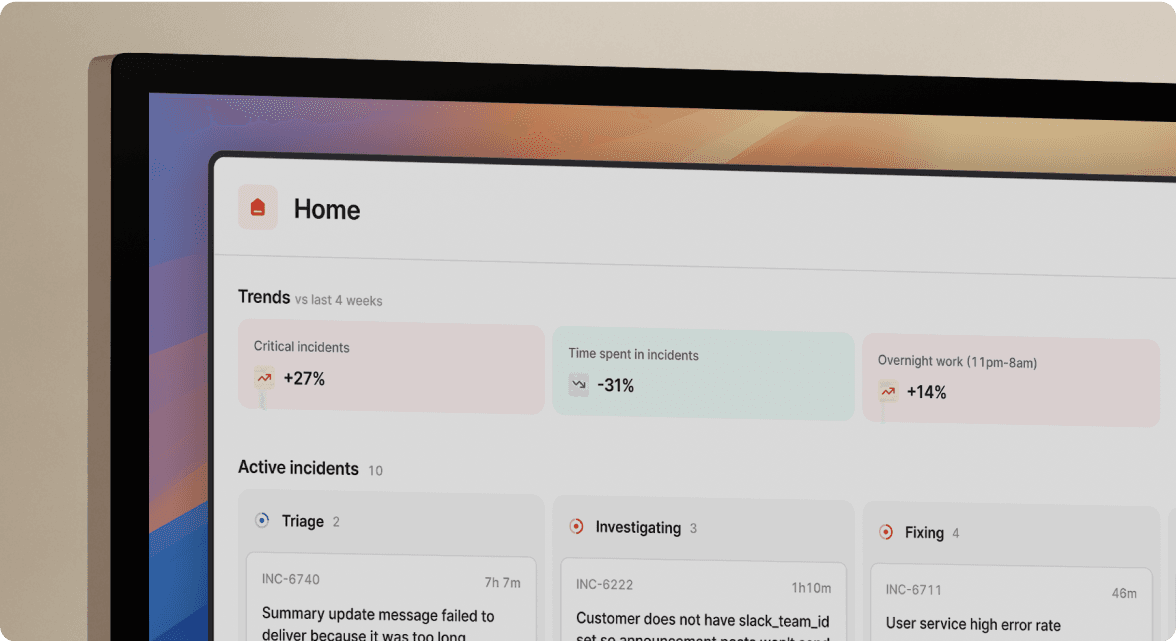
How incident.io’s Insights can take the overhead out of tracking incident response metrics
These seven metrics can help you gain a better understanding of how your incident response processes are performing overall. But how exactly do you go about gathering these metrics?
This is where incident.io’s Insights dashboard comes in.
With it, teams can glean many relevant and insightful incident response metrics, allowing them to make meaningful changes to how they structure their teams, organize on-call rotations, and even the processes they have in place.
The best part about it? Many of these dashboards are pre-built, so you can jump right in and analyze your response metrics without any overhead. Here are just a few of the metrics you can track right out of the box:
- MTTX: Datapoints that can help you answer questions such as, “Is our mean-time-to-respond increasing?” or “Which of our services has the lowest time-to-detection?”
- Seasonality: To help you answer questions such as, “Do our incidents concentrate around certain days of the month?” or “What do we expect incident workload to be around the Christmas holidays?”
- Pager load: A measure of how your team is responding to on-call, helping to answer questions like “What's the trend in the number of times my team is being paged?” or “Are there only a few people who have been woken up out of hours?”
- Readiness: A set of data points that gives you insight into questions like “How many people have recently responded to incidents involving this service and are likely to know how to handle future incidents?” and “Is our responder base growing or shrinking?”
...and more.
If you’re interested in seeing how Insights work and how its metrics can fit seamlessly into your incident response tracking, be sure to contact us to schedule a custom demo.
See related articles

What are DORA metrics and why should you care about them?
Google's DORA metrics can help organizations create better products, build stronger teams, and improve resilience long-term.
 Luis Gonzalez
May 3, 2023

Shipping at speed: Using DORA's Deployment Frequency to measure your ability to deliver customer value
By using DORA's deployment frequency metric, organizations can improve customer impact and product reliability.
Luis GonzalezMay 29, 2023

Development efficiency: Understanding DORA's Mean Lead Time for Changes
By using DORA's Mean Lead Time for Changes metric, organizations can increase their speed of iteration
Luis GonzalezMay 26, 2023
So good, you’ll break things on purpose
Ready for modern incident management? Book a call with one of our experts today.
We’d love to talk to you about
- All-in-one incident management
- Our unmatched speed of deployment
- Why we’re loved by users and easily adopted
- How we work for the whole organization


