Join live: What happens when your AI goes down?
AIOps vs observability: what's the difference?
October 7, 2026 — 16 min read
TL;DR: Observability is the data layer: metrics, logs, and traces that tell you what's happening in your systems. AIOps (artificial intelligence for IT operations) is the intelligence layer that sits on top of that data to automate detection, triage, and response. You need observability first. AIOps doesn't replace your Datadog or Grafana stack. It consumes that data to filter alert noise and automate triage. Our internal benchmarks show Mean Time To Resolution (MTTR) reductions of up to 80%. Start with observability, then add AIOps when alert volume, MTTR, or on-call burnout outpace manual triage.
Datadog costs are climbing, alert volume is growing, and now a vendor is telling you AIOps will fix it. But when you ask whether AIOps replaces the Datadog stack, the answer is vague.
This guide separates the two layers: what observability collects, what AIOps does with that data, and how to tell a real AIOps capability from an LLM wrapper. It also covers what you need in place before AIOps pays off, because pointing it at noisy data makes the noise worse.
Understanding observability basics for SRE workflows
Observability gives you the raw materials for understanding production systems. Without it, you're flying blind during a P0. With it, you have the data you need to answer questions you didn't anticipate when you wrote the code.
Core observability signals
The three pillars of observability refer to metrics, logs, and traces, three types of data outputs that together describe system state. Many practitioners now expand this to the MELT model (metrics, events, logs, and traces) to capture discrete state changes like deploys.
Metrics give you numerical measurements of system performance: CPU usage, response time, error rate. They tell you when something crosses a threshold but not why.
Logs capture system events and errors in plain text, binary, or structured formats with metadata. They provide context for what happened when a metric spiked.
Traces show individual requests flowing through your system, helping you identify bottlenecks, dependencies, and root causes across microservices.
Observability outcomes for SREs
Observability delivers three concrete outcomes for SRE teams:
- Faster root cause identification: When you can correlate a latency spike to a specific trace and then drill into logs from that exact request path, you can actively debug your system using patterns you didn't define in advance. That shortens the path from alert to root cause.
- Better capacity planning: Time-series metrics reveal growth trends and saturation points before they trigger alerts.
- SLO tracking: Service-level objectives (SLOs) require consistent, reliable data about error rates and latency percentiles. Observability platforms provide that foundation.
The limitation: observability tells you what's wrong but doesn't act on it. You still wake your on-call engineer at 3 AM to manually triage the alert, assemble the team, and start a timeline.
Automating incident management with AIOps
AIOps takes the data observability collects and applies machine learning (ML) and automation to reduce the manual work of detecting, triaging, and responding to incidents.
The AI layer in AIOps
AIOps is the use of machine learning and deep learning to process the data that operational tools and infrastructure generate, so teams can detect, diagnose, and resolve system issues in real time.
Alert correlation is one of the two most production-validated AIOps capabilities today, alongside knowledge retrieval. It uses statistical models to group related alerts into incidents, while engineers still do most of the reasoning.
Large language model (LLM) agents raise the ceiling because they can select tools and adjust their plan as new evidence emerges, running follow-up queries instead of waiting for a human to ask. This shift is often called agentic AIOps. Evidence for it is strongest for read-only diagnosis and much thinner for systems that change production on their own.
Tasks AIOps automates
AIOps platforms automate specific, measurable tasks on top of observability signals:
- Reducing noise through deduplication: AIOps uses aggregation, normalization, and event correlation to compress thousands of alerts into a smaller set of actionable incidents.
- Detecting anomalies and correlating events: An analytics engine uses ML and statistical methods to detect anomalies, correlate events, predict capacity problems, and perform root cause analysis.
- Adding context to incidents: Automated enrichment adds runbook links and context like configuration details or Configuration Management Database (CMDB) data, reducing the time spent hunting for relevant information.
Investigations, our AI SRE product, starts investigating the moment you declare an incident. It connects telemetry, code changes, and incident history to surface the root cause. That gets teams from alert to resolution an order of magnitude faster. It never changes your systems on its own. The only change it can make is a pull request (PR) you review and merge.
Comparing AIOps vs observability: the key differences
The two layers do different jobs, which is why you need both and why one doesn't replace the other.
Observability vs AIOps: side by side
The distinction becomes clearer when you compare them across key dimensions:
| Dimension | Observability | AIOps |
|---|---|---|
| Primary function | Visualize and analyze system behavior to understand internal states | Analyze telemetry and automate response |
| Data source | Metrics, logs, traces, events from applications and infrastructure | Consumes observability data via APIs and webhooks |
| Output | Dashboards, queries, raw alerts | Filtered alerts, root cause hypotheses, automated workflows |
| Human role | Interpret dashboards, run queries, manual triage | Review AI recommendations, approve actions, focus on complex problems |
| Example tools | Datadog, Grafana, Prometheus, New Relic, Honeycomb | BigPanda, Dell APEX AIOps. AI SRE: incident.io Investigations |
The table shows why AIOps consumes observability data rather than replacing the observability layer. Observability platforms excel at data collection and storage. AIOps platforms excel at making that data actionable at scale.
Overlap between AIOps and observability
Some observability tools now include AI-powered anomaly detection, so the categories overlap at the edges. The core functions stay distinct, though. You can't do AIOps without observability data.
Feeding your AIOps engine with telemetry data
The quality and structure of your observability data directly determine how effective your AIOps layer can be.
AIOps in a live incident workflow
Data flows from observability tools into AIOps platforms through APIs and webhooks. In practice, a Datadog monitor sends its alert through a webhook to the tool that handles response. Here's how that plays out with Datadog and PagerDuty in a typical incident:
- Observability tool detects anomaly and fires alert: A Datadog monitor crosses a threshold and sends a webhook payload to the AIOps platform with details about the affected service, metric values, and alert metadata.
- AIOps platform receives alert and enriches it: The platform typically enriches the alert with context about the owning team and on-call engineer, reducing the manual lookup work that delays triage.
- AIOps platform pages on-call and suggests root cause: The platform creates an incident channel in Slack, pages the on-call engineer through PagerDuty or its own on-call system, and starts capturing a timeline. It then analyzes past incidents with similar signatures to suggest a likely root cause based on recent deploys or configuration changes.
All of this happens before a human touches a keyboard. The workflow removes most of the 10-15 minutes of manual coordination that often comes before troubleshooting. At Favor, incident setup used to take 20-30 minutes, then we cut it to seconds.
Data quality requirements for AIOps
AIOps platforms need metrics for anomaly detection, logs for root cause analysis, traces for dependency mapping, and events for correlation. Data quality matters. If your observability data has noisy metrics or inconsistent log formats, the AI layer amplifies the problem by generating false positives and low-quality root cause suggestions.
Aligning AIOps and observability data sets
The relationship between AIOps and observability becomes clearest when you look at how AIOps platforms filter and act on the noise that observability systems generate.
Anomaly detection in observability data
Machine learning detects anomalies by establishing baselines for normal behavior, accounting for seasonality (traffic patterns that vary by time of day or day of week), and dynamically tuning thresholds based on historical variance.
Static thresholds create alert fatigue. A CPU reading of 80% might signal a real problem at 2 AM but be completely normal during a daily batch job at 2 PM. ML-based anomaly detection learns these patterns and adjusts alerting accordingly.
Alert fatigue is one of the most consequential problems in enterprise IT operations. AIOps provides the filtering layer that makes high-volume telemetry manageable when distributed systems emit more events than humans can triage.
Noise filtering in AIOps
AIOps reduces noise through three primary mechanisms:
- Deduplication: When 50 alerts fire because one database is down, AIOps groups them into a single incident instead of paging 50 times.
- Correlation: The platform links related events across data sources (a deploy event followed by a latency spike followed by error logs) to identify patterns and surface the likely root cause.
- Suppression of low-priority alerts: AIOps suppresses alerts that historically resolve themselves quickly, or downgrades them to notifications instead of pages.
Our alert grouping combines related alerts that arrive within a time window or share attributes such as service or region. A cascading failure across multiple microservices lands as one alert group instead of many pages.
The concrete outcome is a higher signal-to-noise ratio. After moving incident response to incident.io, Favor increased incident detection by 214% because the team caught small issues before they became major outages. MTTR dropped 37%.
Vendor claims to question
When evaluating vendor claims, ask one question: does this replace my observability tool, or does it consume its data?
Red flags in AIOps vendor pitches:
- Claims to replace Datadog or Grafana entirely: No AIOps platform can replace the data collection and storage layer. If a vendor claims this, ask where the metrics, logs, and traces will come from.
- "AI-powered" without specific automation examples: Vague claims about AI that don't specify which tasks the platform automates (deduplication, triage, root cause analysis) usually mean an LLM wrapper that summarizes alerts without adding real value.
- No human review step: Any platform that merges code or changes configuration autonomously, without human approval, is a liability.
The right framing: observability vs AIOps isn't a competition. Observability collects the data. AIOps acts on it.
Integrating AIOps into existing observability workflows
Adding AIOps to your stack doesn't mean ripping out your existing observability tools. It means adding a layer on top that makes the data actionable.
Prerequisites for AIOps
Before AIOps delivers value, you need three foundations in place:
- Solid observability foundation: Metrics, logs, and traces flowing from your critical services with consistent tagging and instrumentation.
- Defined SLOs: SLOs give the AI layer context for what "bad" looks like. Without SLOs, every anomaly looks equally urgent.
- Clean alert routing: Alerts need to flow to the right team based on service ownership. If your alert routing is broken, AIOps will automate the wrong notifications faster.
Expect the fastest payoff from noise reduction. Well-implemented event correlation cuts alert volume by 60-90% in environments with well-defined service topology data. That's why clean service topology and ownership data matter so much.
The value comes from automating the coordination and triage work that often consumes the first 10-15 minutes of an incident. Human judgment still drives the actual fix.
AIOps as a layer on observability
Observability is the sensor network. AIOps is the automated dispatch system.
In that model, Investigations, our AI SRE product, picks up where the dispatch layer ends. It reads the telemetry your observability tools already collect, then turns it into a root cause hypothesis plus a drafted fix.
AIOps evaluation checklist
When evaluating AIOps tools, use this checklist to vet integration, safety, cost, and security before you commit:
- Integration with existing observability tools: The platform must support Datadog, Prometheus, Grafana, and New Relic at minimum. We provide documented integrations with major observability platforms plus PagerDuty for teams not ready to migrate alerting.
- Human review step before production changes: The AI should suggest fixes and draft PRs, but a human must review and approve before any code merges or configuration changes take effect.
- Transparent pricing: Our Pro plan costs $45/user/month with on-call ($25 base + $20 on-call add-on). Investigations is available as an add-on on Pro, so price the AI layer separately when you compare vendors.
- Security and compliance documentation: Ask for a SOC 2 Type II report, GDPR documentation, and encryption details for data at rest and in transit. Every SOC 2 report includes the Security criterion (CC1-CC9), so ask how the vendor's controls map to it. GDPR Article 32 lists encryption of personal data among the expected security measures.
- Our security posture: We're SOC 2 Type II certified, GDPR compliant, and use AES-256 encryption at rest. EU customers get primary hosting in Belgium with hot standby in the Netherlands, and no customer data leaves Europe. Don't skip this step during evaluation, or security will block the purchase after you've already championed the tool.
Build observability first. Add AIOps when the volume of signals exceeds your team's capacity to triage manually.
Book a demo of incident.io and see how Investigations gets you from alert to resolution an order of magnitude faster.
Key terms glossary
Observability: The ability to understand system state from external outputs: metrics, logs, and traces. It tells you what's happening in your systems.
AIOps: The application of machine learning and automation to IT operations data. It acts on observability signals to detect, triage, and respond to incidents.
Telemetry: The raw data collected from systems: metrics, logs, traces, and events. It's the input to both observability and AIOps platforms.
Correlation: The process of linking related events across data sources to identify patterns and root causes. AIOps uses correlation to reduce alert noise.
FAQs

Tom Wentworth
Chief Marketing Officer
See related articles
Building Investigations: what it takes to build an AI SRE
We spent the last two years building Investigations, our AI SRE. In this post, go behind the scenes of the work done and why build vs. buy is one of the most important decisions engineering teams are making right now.

October 1, 2026
Introducing Investigations, powered by Nexus.
Today we're launching Investigations: agentic root cause analysis that starts the moment you're paged, figures out what broke and why, and works with your team through to resolution. Here's what we built, what's powering it, and why it took some time to get right.

August 5, 2026
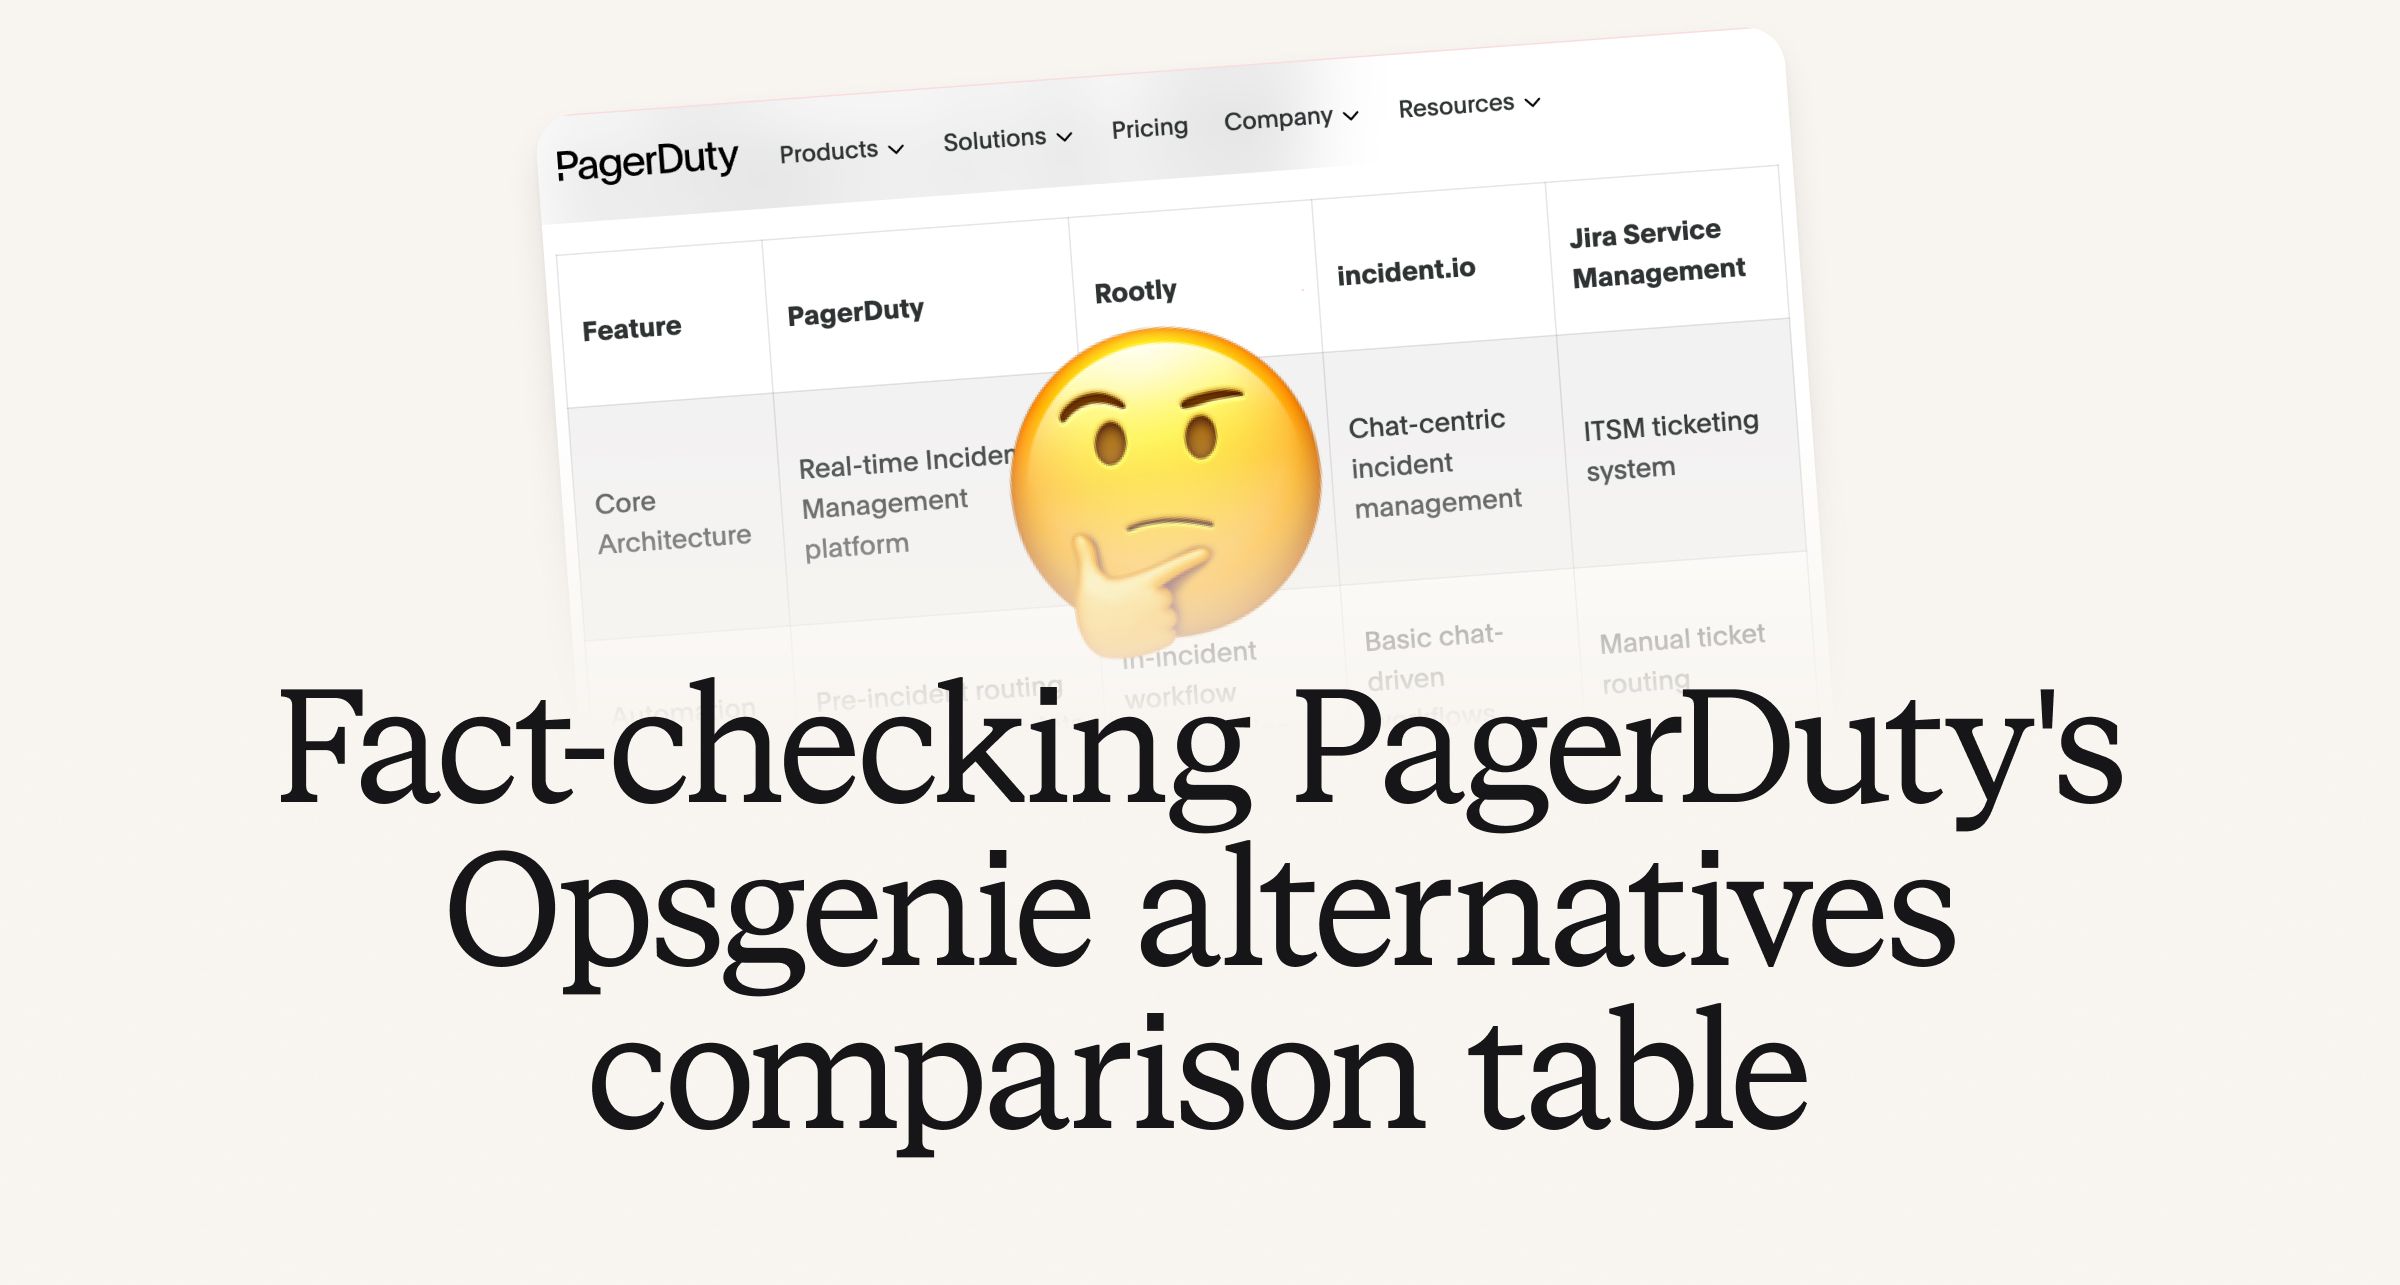
Fact-checking PagerDuty's Opsgenie alternatives comparison table
PagerDuty published a new comparison table about incident.io. Once again, it describes a product we don't recognize. So once again, we're correcting the record, row by row, with receipts.

July 28, 2026
So good, you’ll break things on purpose
Ready for modern incident management? Book a call with one of our experts today.
We’d love to talk to you about
- All-in-one incident management
- Our unmatched speed of deployment
- Why we’re loved by users and easily adopted
- How we work for the whole organization