Institutional knowledge doesn't scale: Building an agentic data analyst
August 3, 2026 — 13 min read
We’ve previously written about how deeply embedded data is in people’s day-to-day work at incident.io, and I’d have it no other way — demand for data is undoubtedly a good thing. What risks breaking at scale, however, is everything downstream of that demand: data-team capacity gets stretched thin, dashboard sprawl outpaces anyone's ability to maintain it, and stakeholders can't reach an answer without going through the data team.
That leaves people two options: wait for an answer that arrives too late to be useful, or worse, stop asking.
Traditional self-service analytics via a BI tool did a reasonable job at alleviating this for a while. Backed by a good semantic layer, we got pretty far with building detailed dashboards to drive business decisions and establish consensus across people and teams. The limitation we eventually ran into was that relying on dashboards worked for exactly as long as your question closely matched a chart someone had already built. This introduced a lot more friction for stakeholders when it came to more exploratory one-offs or “what if?” type questions.
The next thought: what if we give an LLM access to the warehouse? While LLMs are pretty darn good at writing SQL, text-to-SQL also has plenty of silent failure modes: not knowing which join paths are blessed, which filters are canonical, which of the four ARR-shaped columns applies to this specific question.
A semantic layer already solves some of this, e.g. the dreaded question of what counts as an active user gets a canonical answer once, centrally, rather than being reinvented every query. But most of the warehouse still isn't behind that semantic layer, and even where it is, the layer defines named metrics, not the judgment calls needed to compose fresh SQL against raw tables.
These were the kinds of nuances that are the bread and butter of a data analyst's work, i.e. bridging the gap between "the data exists" and "that number is correct". Unfortunately, none of that is written on the warehouse tables, or in the semantic layer either; it's institutional knowledge, and for better or worse, institutional knowledge doesn't show up in INFORMATION_SCHEMA. Handing out warehouse access just moves the bottleneck one step sideways, shifting the data team's work from "can you pull this for me" to "can you check this SQL before I run it", which is the same job, with worse ergonomics.
Getting our agentic BI hats on
We built our own data agent, affectionately called the "data brain" (naming things is hard). The goal was to abstract the work of a data hire, and the work was shaped by thinking about what a new data hire would get during onboarding, i.e., learning which tables mean what, which questions we've already answered correctly via dashboards, and how to run queries safely enough that we'd trust the hire agent unsupervised.
Overall architecture
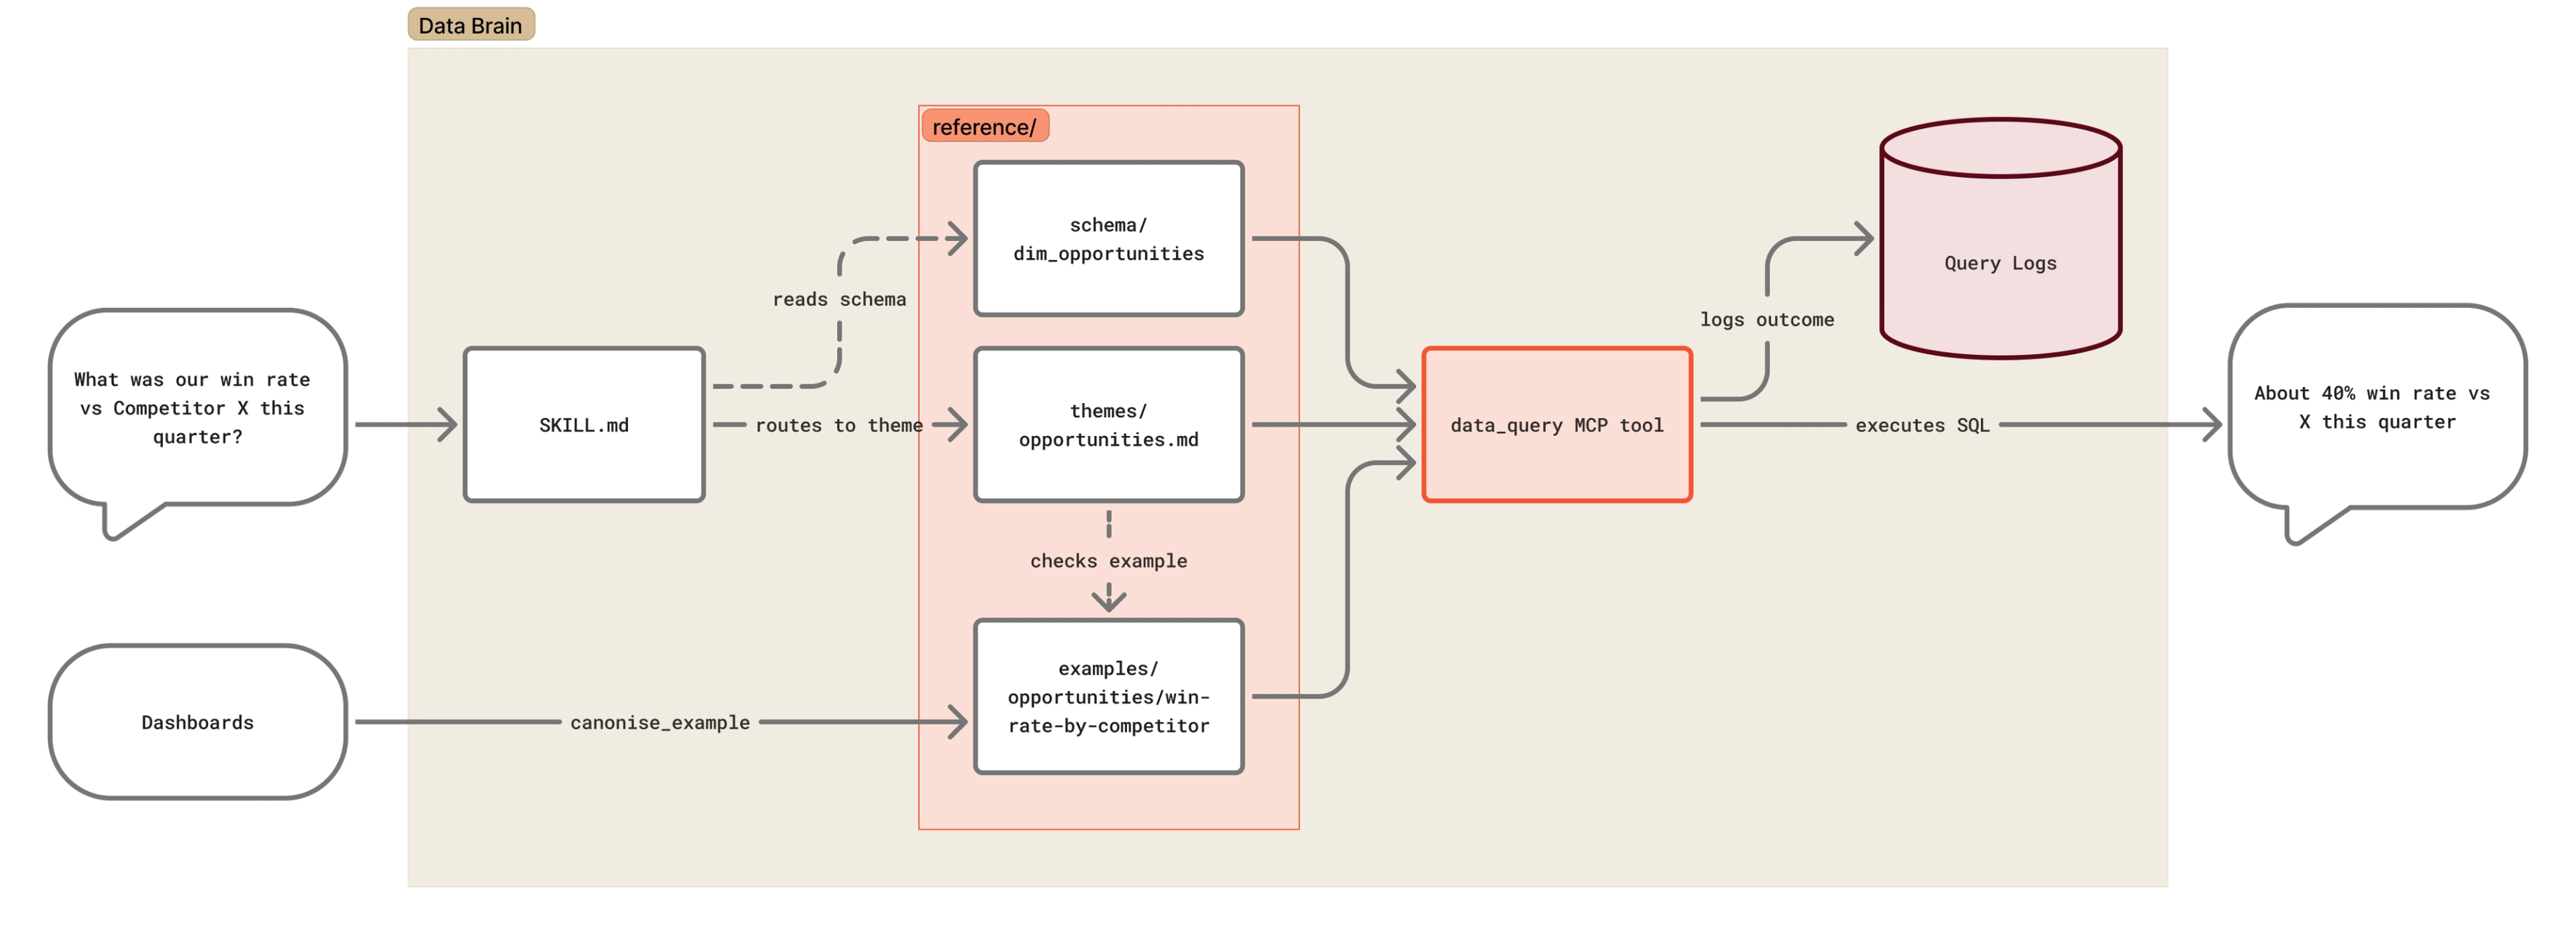
The data brain ships as a plugin in our internal AI repo, packaged so it behaves consistently whether you reach for it through Claude Code in the terminal or Cowork. The anchor is a query skill, read at the start of every data conversation, and acts as the operating manual for the entire system.
Everything that skill leans on sits underneath it:
themes/- One file per domain, e.g. opportunities, competitors, customers, renewal and retention, and so on.
- We grouped these around related business concepts. They deliberately don't mirror our marts models 1:1, because the marts models are optimised against dimensional modelling best practices whereas we wanted these themes to be closer to semantic concepts that were present in the business.
- Each theme bundles hand-written guidance like when to use it, when not to and a list of common “gotchas”.
- We heavily indexed on progressive disclosure and optimising for efficient routing here, because we wanted the agent to only load information relevant for the task at hand, and had strong intuition on the kinds of things it’d have to do.
examples/- These are hand-authored* (more on this below) vetted question-and-answer pairs with warehouse-dialect SQL.
- The agent is instructed to find a matching example and reference it wherever possible, instead of composing fresh SQL every time.
schema/- This is the raw per-model/table field catalogs that combines our semantic layer, and warehouse metadata.
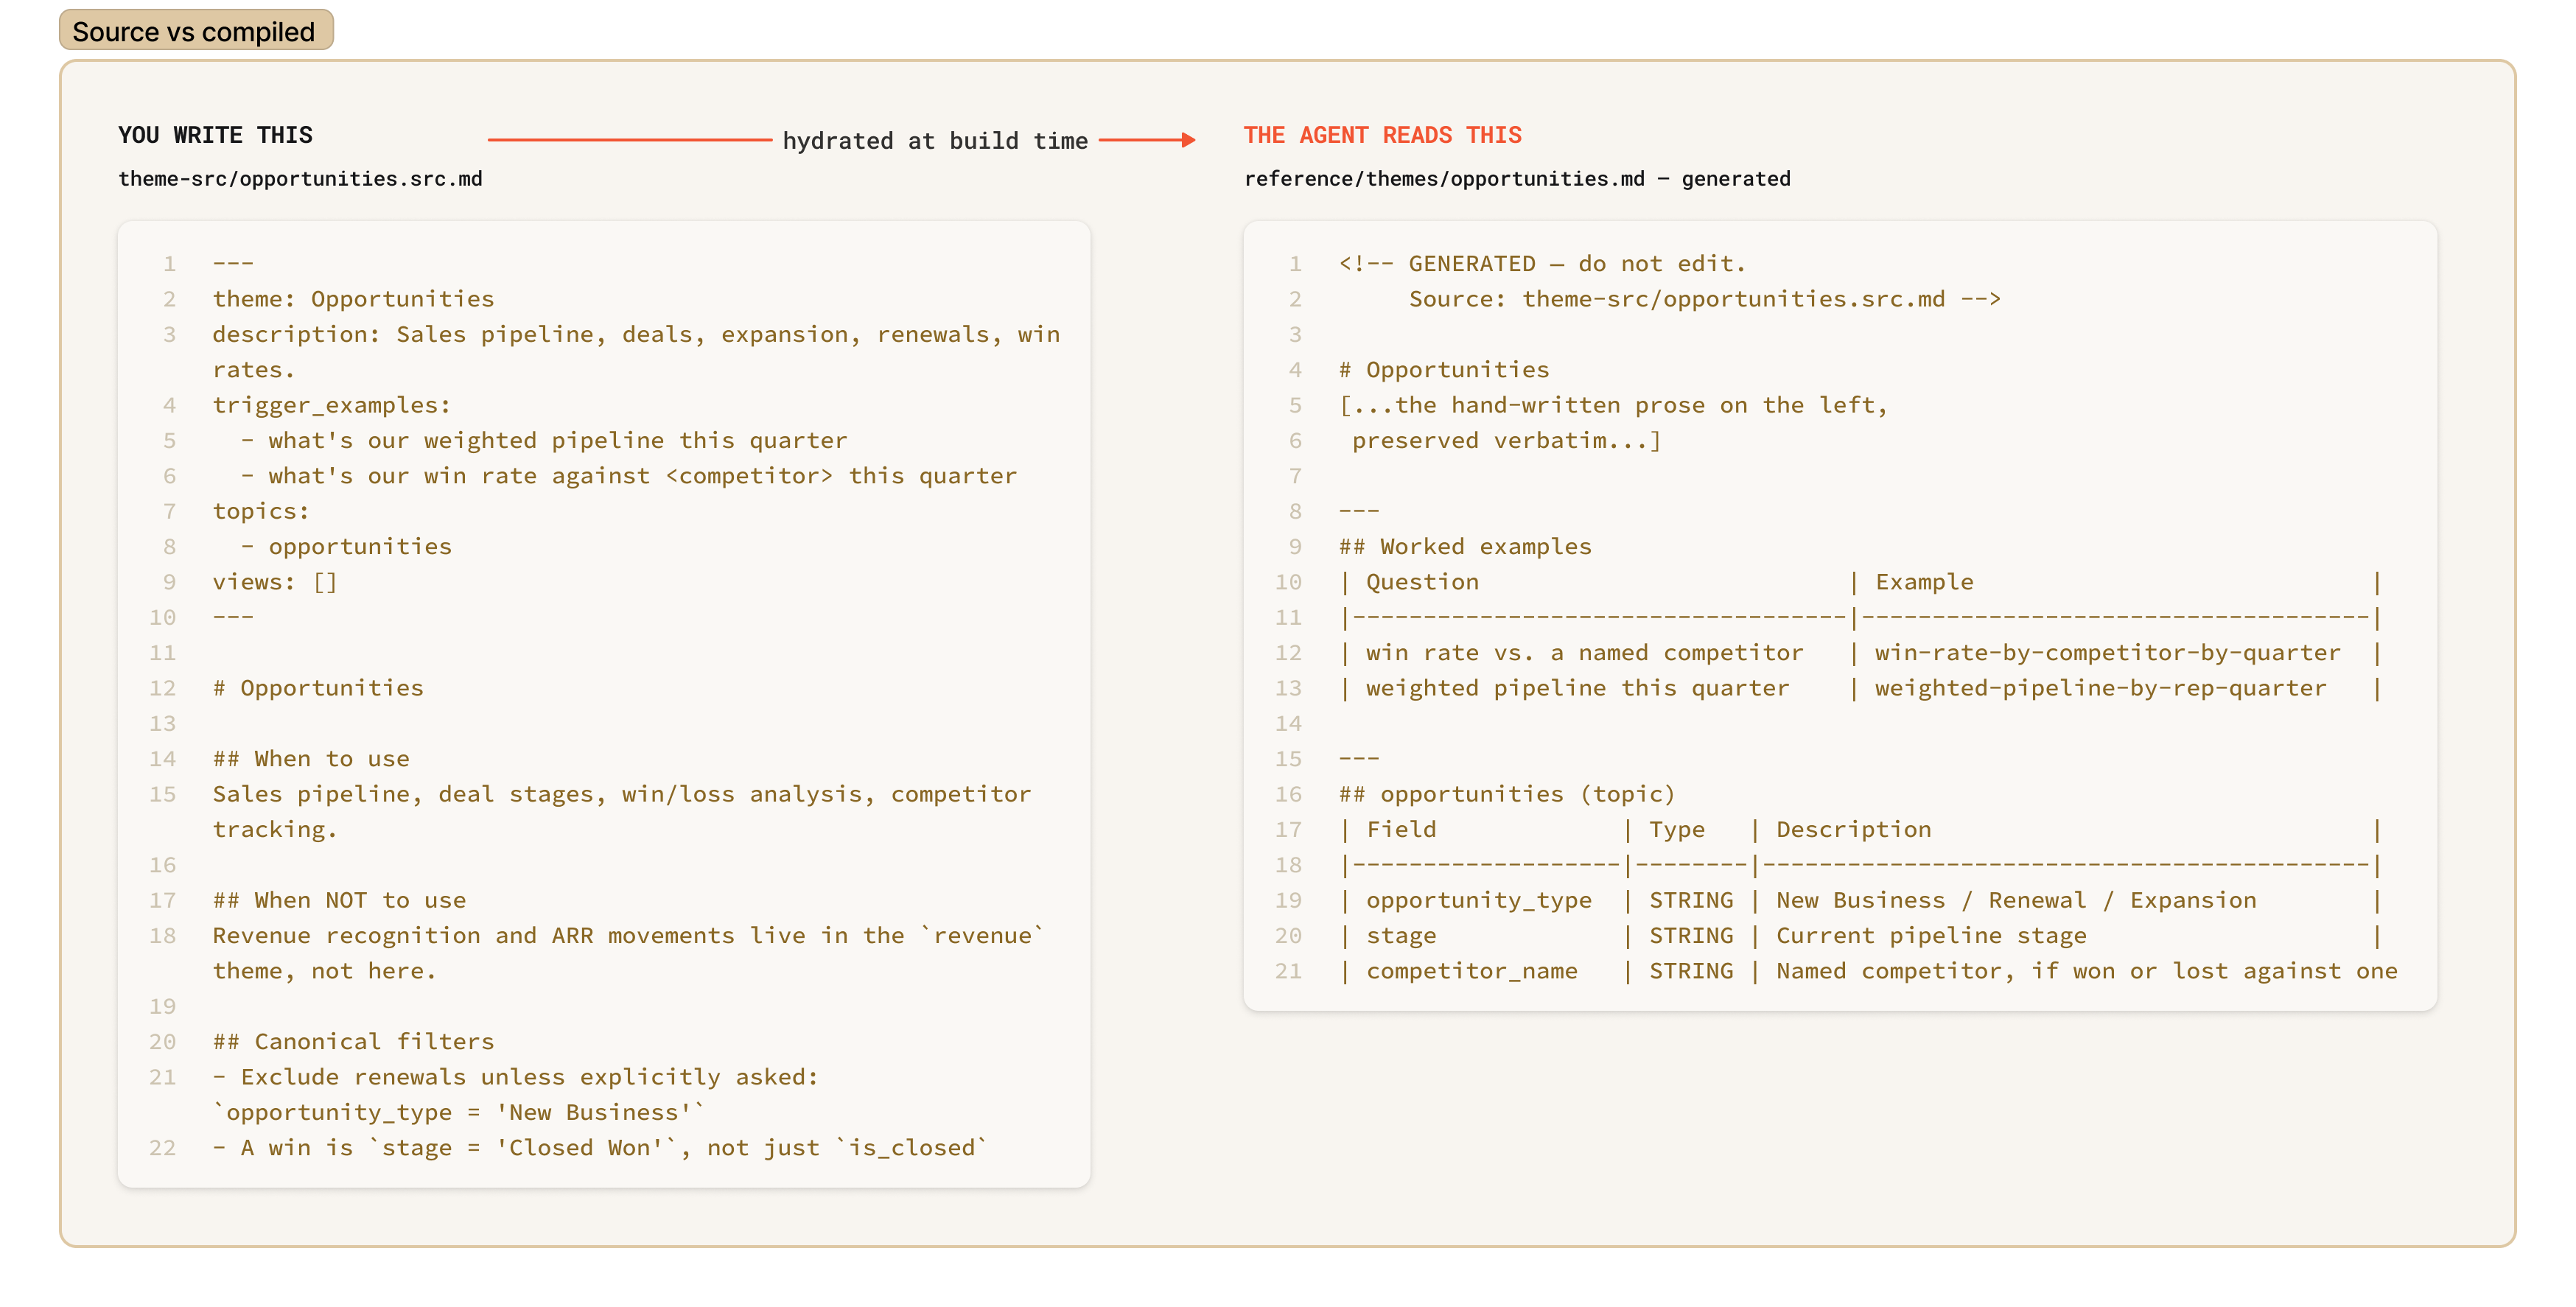
- Rather than dumping the entire schema into the agent’s context, each theme is “hydrated” at compile time with the relevant subset of schema-based information for that theme.
Themes and examples have their own (versioned) source files, and a small Go CLI assembles them against a snapshot of the semantic layer, the dbt manifest, and BigQuery's schema. That keeps the agent's reference material in sync with the warehouse without anyone hand-updating three docs every time a column changes.
Once the agent has composed a query, it calls a data_query tool — the only thing in this system with a real BigQuery connection. The tool dry-runs the SQL, checks the statement type and every referenced table against an allow-list, rejects anything that'd scan large amounts of data, and only then runs it for real. Additionally, every call, successful or rejected or errored, gets written back into the warehouse and modelled into dbt marts we can query like any other table. The "quick question" pipeline is now itself something we can ask quick questions about.
Logging
We also ensured we had really robust query-level logging here, in particular knowing if and which themes and examples the agent consulted when answering a question.
Without being able to establish this trail, a plausible-looking answer and a correctly-sourced one look indistinguishable from the outside, and you don’t know if it got it right through sheer luck. Additionally, this also allows you to know in aggregate which themes/examples get used, which ones get skipped, and what questions people ask that we don’t have good guidance coverage for.
Ensuring we had really solid logging and telemetry was foundational for being able to monitor the adoption and usage patterns of the data brain, but also set up a robust evals system and build a feedback loop to improve the guidance later on.
Bootstrapping the guidance
The examples/ form a really powerful bit of the data brain, particularly for questions that we knew would be asked of it but were genuinely tricky to derive from first principles. However, the process of generating these risked being labor-intensive, given that they needed dozens of validated SQL statements an agent could copy from, all ideally traceable to a real question someone had actually asked.
So we decided to bootstrap this process using a canonise-example skill, that takes a theme, a set of human questions, and the URLs of the curated, data-team-certified dashboards that already answer them today.
Dashboards represented an asset with a high level of curation, and we only built these off of dashboards that we knew were driving the business, rather than guessing what people wanted to know.
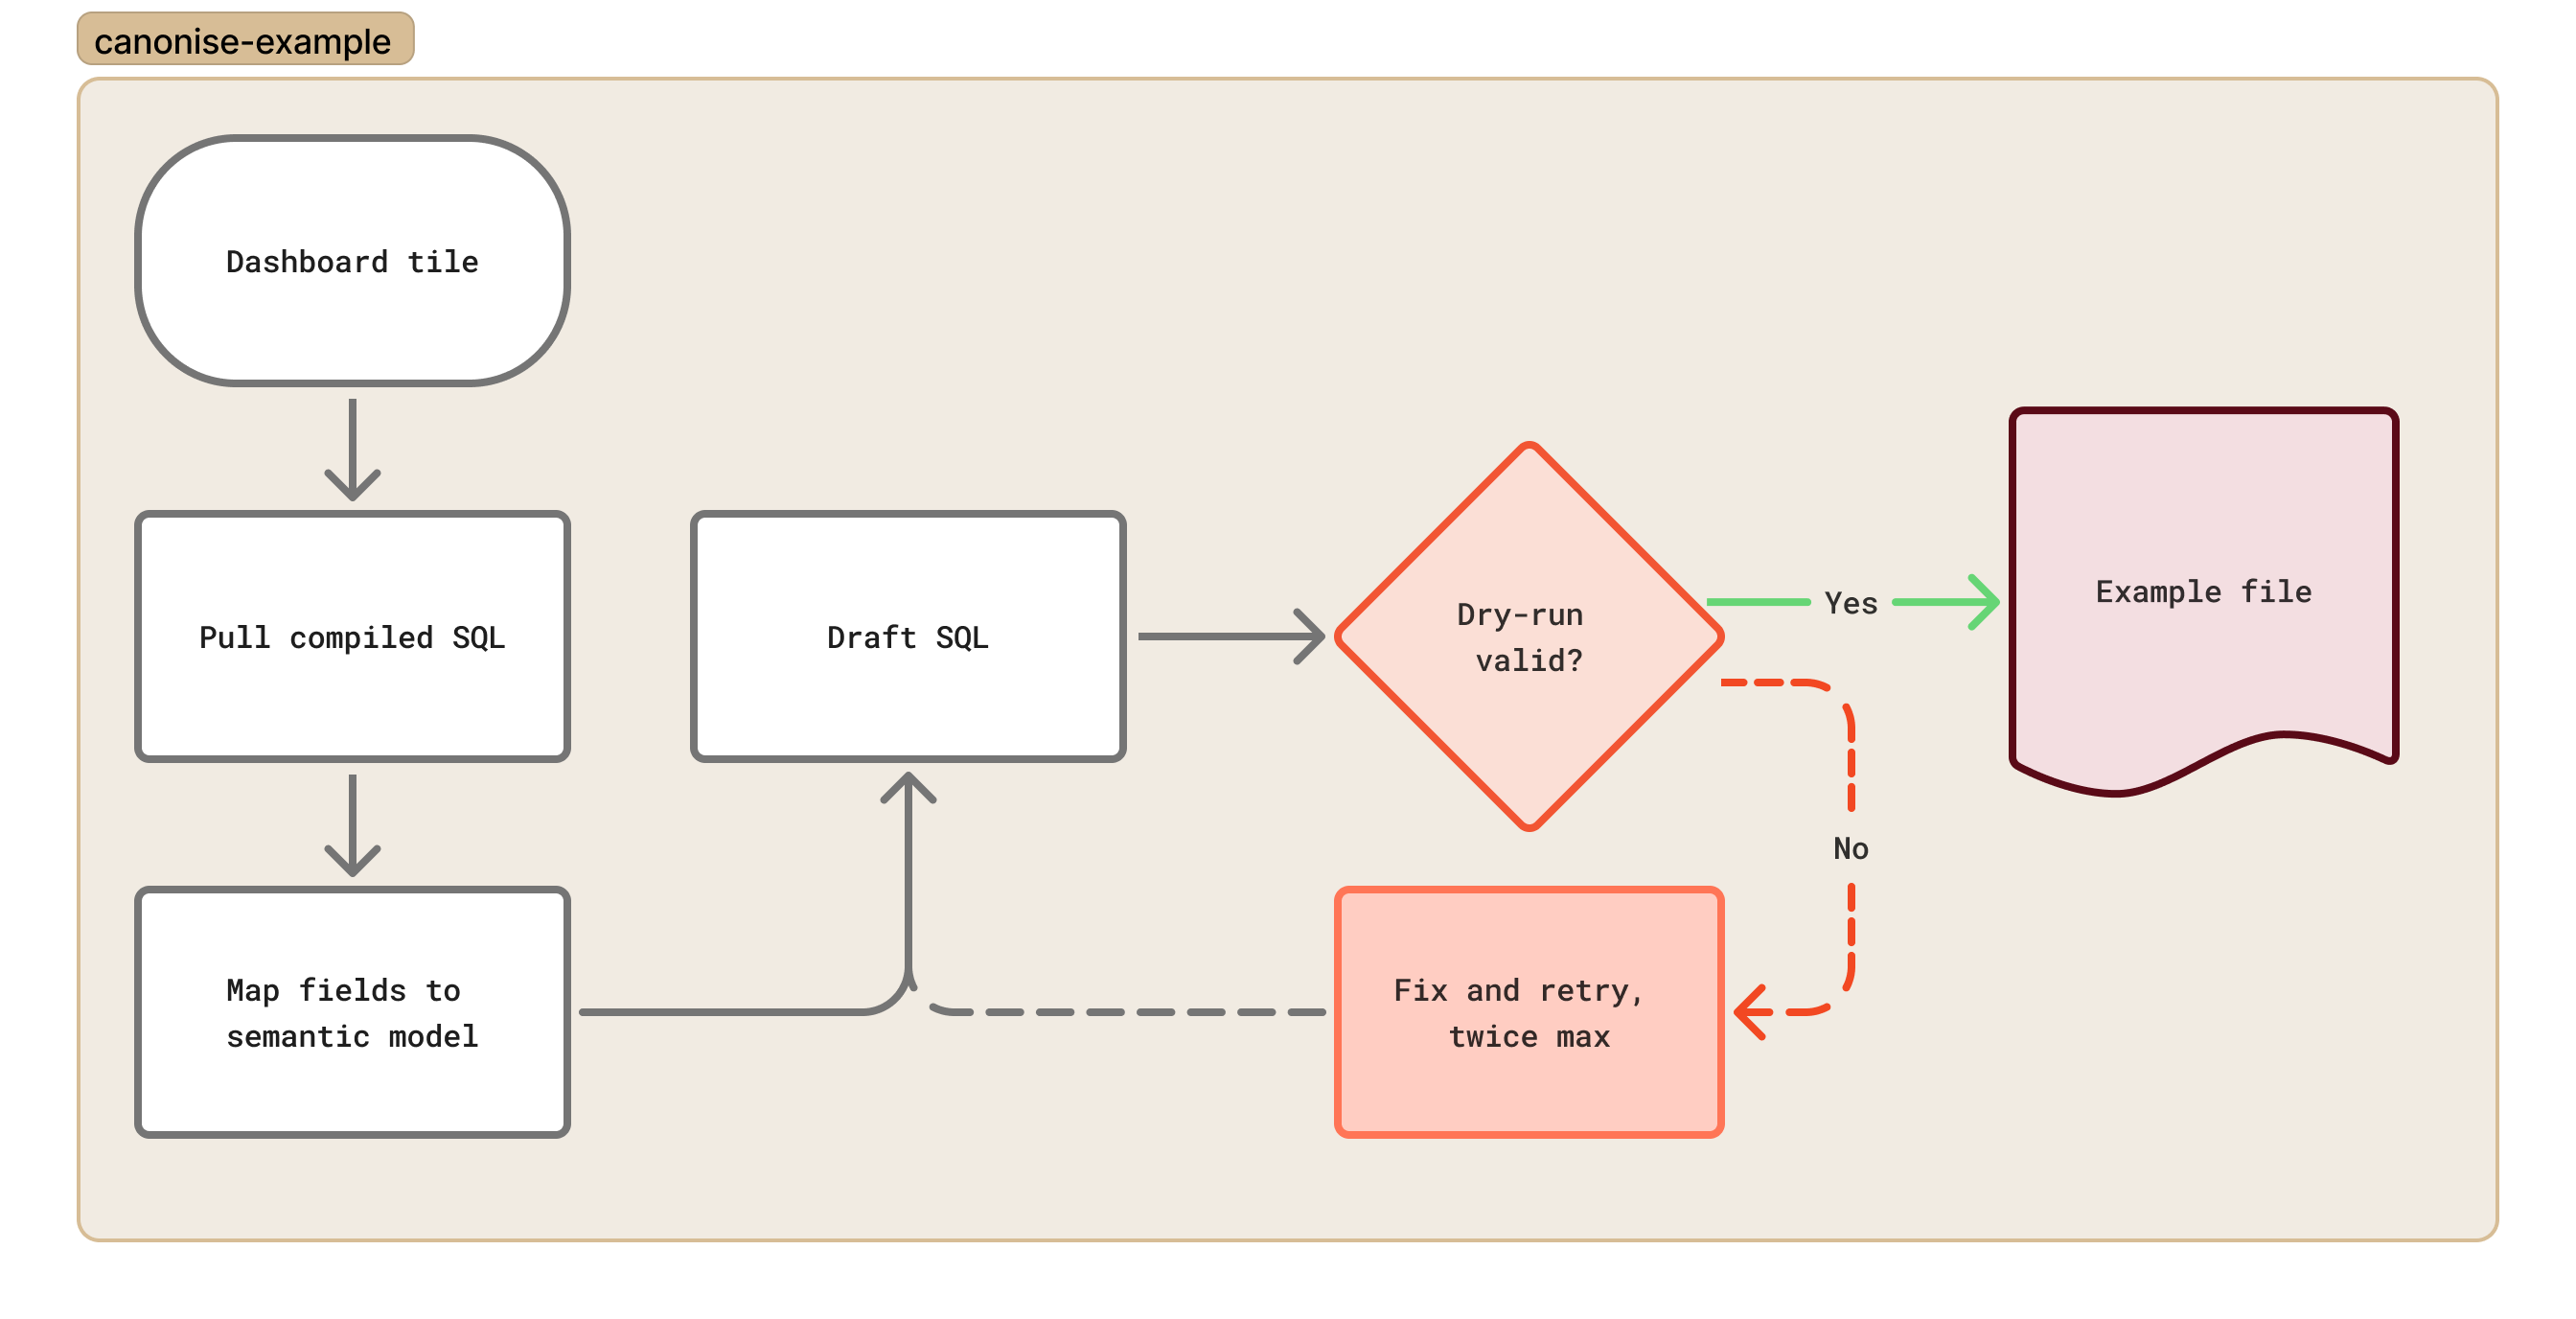
The skill itself pulls the compiled SQL straight off each dashboard tile (respecting filters, pivots and time anchors), and treats that as the source of truth for what the dashboard does. It maps every field back to what that field actually means in our semantic model, then drafts one canonical SQL statement, or a handful of variants, side by side, when different questions genuinely need different shapes. (We hit this in practice: two questions anchored on different time grains forced into one cube ended up messing up any ratio built on top of it later.)
Avoiding guidance rot
In a system like this, letting the guidance become unreliable is a very real failure mode, and what’s worse is that it’s a silent one. By default, nothing stops the prose drifting out of sync with the schema underneath, or two themes claiming the same trigger phrase, or having an example gather dust and quietly go wrong as the tables under it evolve. These risk the guidance being confidently wrong, until an agent reads it and writes confidently wrong SQL as a result.
So we added a theme-audit skill + routine that runs a series of checks across the corpus. It audits the assembled output because that's what the agent actually reads at query time. The checks cover things like:
- Hydration size — is a theme's context footprint blowing past a sane token budget?
- Example coverage — does the theme have worked examples attached, or is it schema with nothing to copy from?
- Trigger-phrase overlap — do two themes claim the same or near-identical question? That's a routing collision waiting to misfire.
- Staleness, at both theme and example level — when was this last touched, relative to how fast the thing it describes actually moves?
The first real run surfaced three genuine problems in our corpus: a theme with zero worked examples, another missing its required structural sections outright, and two themes both using "ARR over 12 months" as a trigger phrase, so a real question could route to either one at random.
The other instrumental lever in “closing the loop” with guidance improvement was using real-usage data to identify gaps, and areas of improvement in the corpus. More on this in the next blog post in the series!
Outcomes
We’re now a couple of months post-launch of the data brain, and the results speak for themselves. More than half the company are using it weekly (i.e. are weekly active users), with a further half of those using it 3 or more days in a given week. Retention is equally strong, nearing 60% week-on-week retention. What’s even more promising is that people are building workflows and skills that are all backed by the data brain, spanning a wide range of use-cases, from Customer Success to Product Ops.

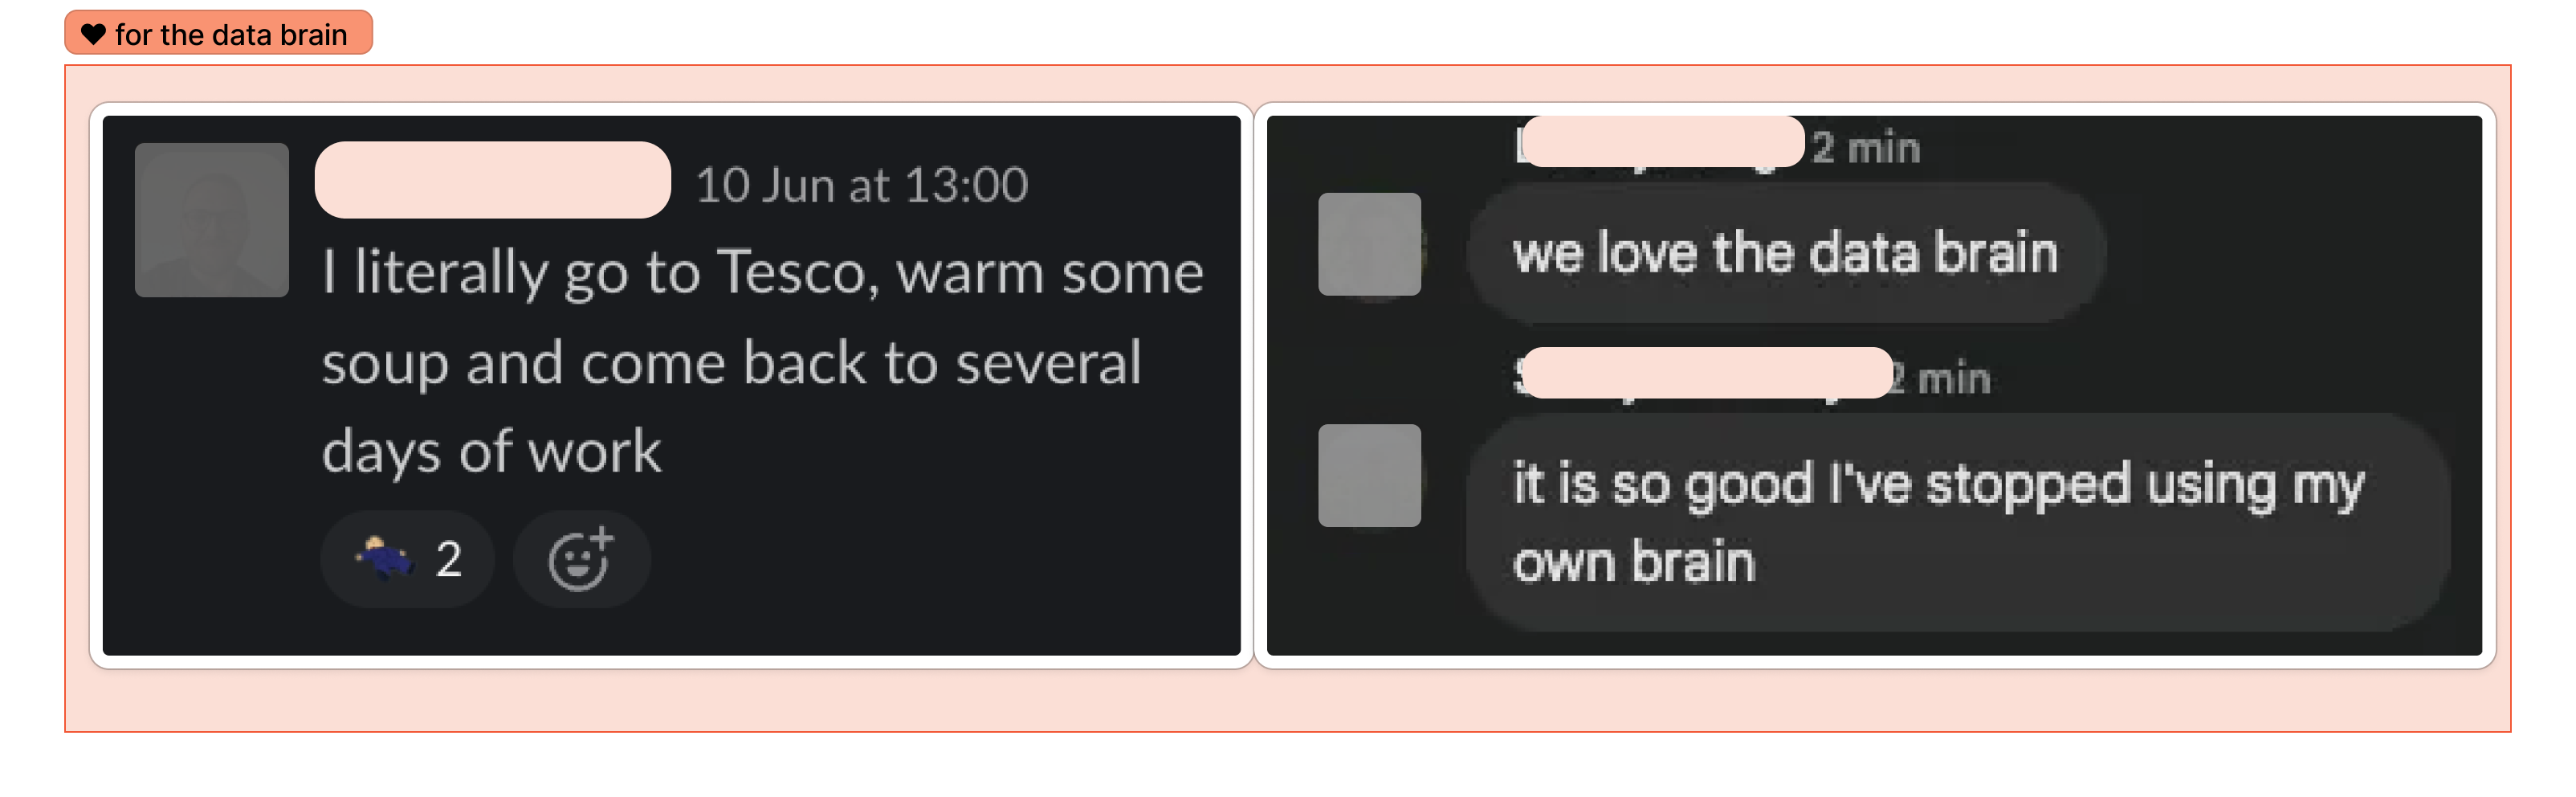
But don’t just take my word for it, the real proof is in what people have said about the data brain:
What’s next
You don’t get to just build a whole new surface for people to interact with data and leave it at that, you need to ensure you both maintain and improve the system. I’ll be covering more of the latter in my next blog post, which will focus on the measurement side of things, i.e. how we set up a robust evals system to ensure that the quality of output continues to be top-notch.
But until there, here are some valuable learnings that’ll likely be useful for your own implementation of a similar data agent:
- Logmaxxing is real. Setting up robust telemetry early one will pay dividends. Every
data_querycall writes a warehouse row: which theme and example slugs were consulted, each with a content version, the skill token proving the guidance loaded at all, and whether the call succeeded, was rejected, or skipped guidance. This makes it dead easy to answer things like "Is anyone actually reading thereporting_customerstheme?" - Treat the guidance corpus as code. The worst errors are the silent ones, e.g. prose drifts from schema, two themes claim the same trigger phrase, examples going stale. Without some kind of CI running against the assembled corpus, it stays invisible until an agent reads it and writes confidently wrong SQL, and you should try and guard against this. We’d also recommend versioning every bit of guidance, which will help establish lineage and monitor improvements.
- Progressive disclosure is your friend. Route the agent to the minimum context for the task — in our case the themes it opts into, vs. the whole warehouse schema in every prompt. Give the agent detailed breadcrumbs to what it needs to find, but don’t give it the entire bakery upfront.
- Bootstrap guidance from what's already trusted. The institutional knowledge you're capturing probably already exists in dashboards the business runs on. Extracting and validating that (like via
canonise-example) is faster and more “truthful” than hand-authoring examples cold based on what you think is useful.

Navo Das
Lead Data Analyst
See related articles
Dashboards aren’t (quite) dead
How they still matter as the curated, trusted layer that keeps both humans and LLMs telling the same story from the same data.

July 29, 2026

Pager fatigue: Making the invisible work visible
We developed The Fatigue Score to make sure our On-call responders’ efforts are visible. Here's how we did it, and how you can too.

April 25, 2025
Going beyond MTTx and measuring “good” incident management
What does "good" incident management look like? MTTx metrics track speed, but speed alone doesn’t mean success. So, we decided to analyze 100,000+ incident from companies of all sizes to identify a set of new benchmarks for every stage of the incident lifecycle.

March 25, 2025
So good, you’ll break things on purpose
Ready for modern incident management? Book a call with one of our experts today.
We’d love to talk to you about
- All-in-one incident management
- Our unmatched speed of deployment
- Why we’re loved by users and easily adopted
- How we work for the whole organization