Inspect alerts for better incident management
February 13, 2024

Last month, we announced the release of Alerts, which allows customers to automatically create incidents from their monitoring, paging and service management tools.
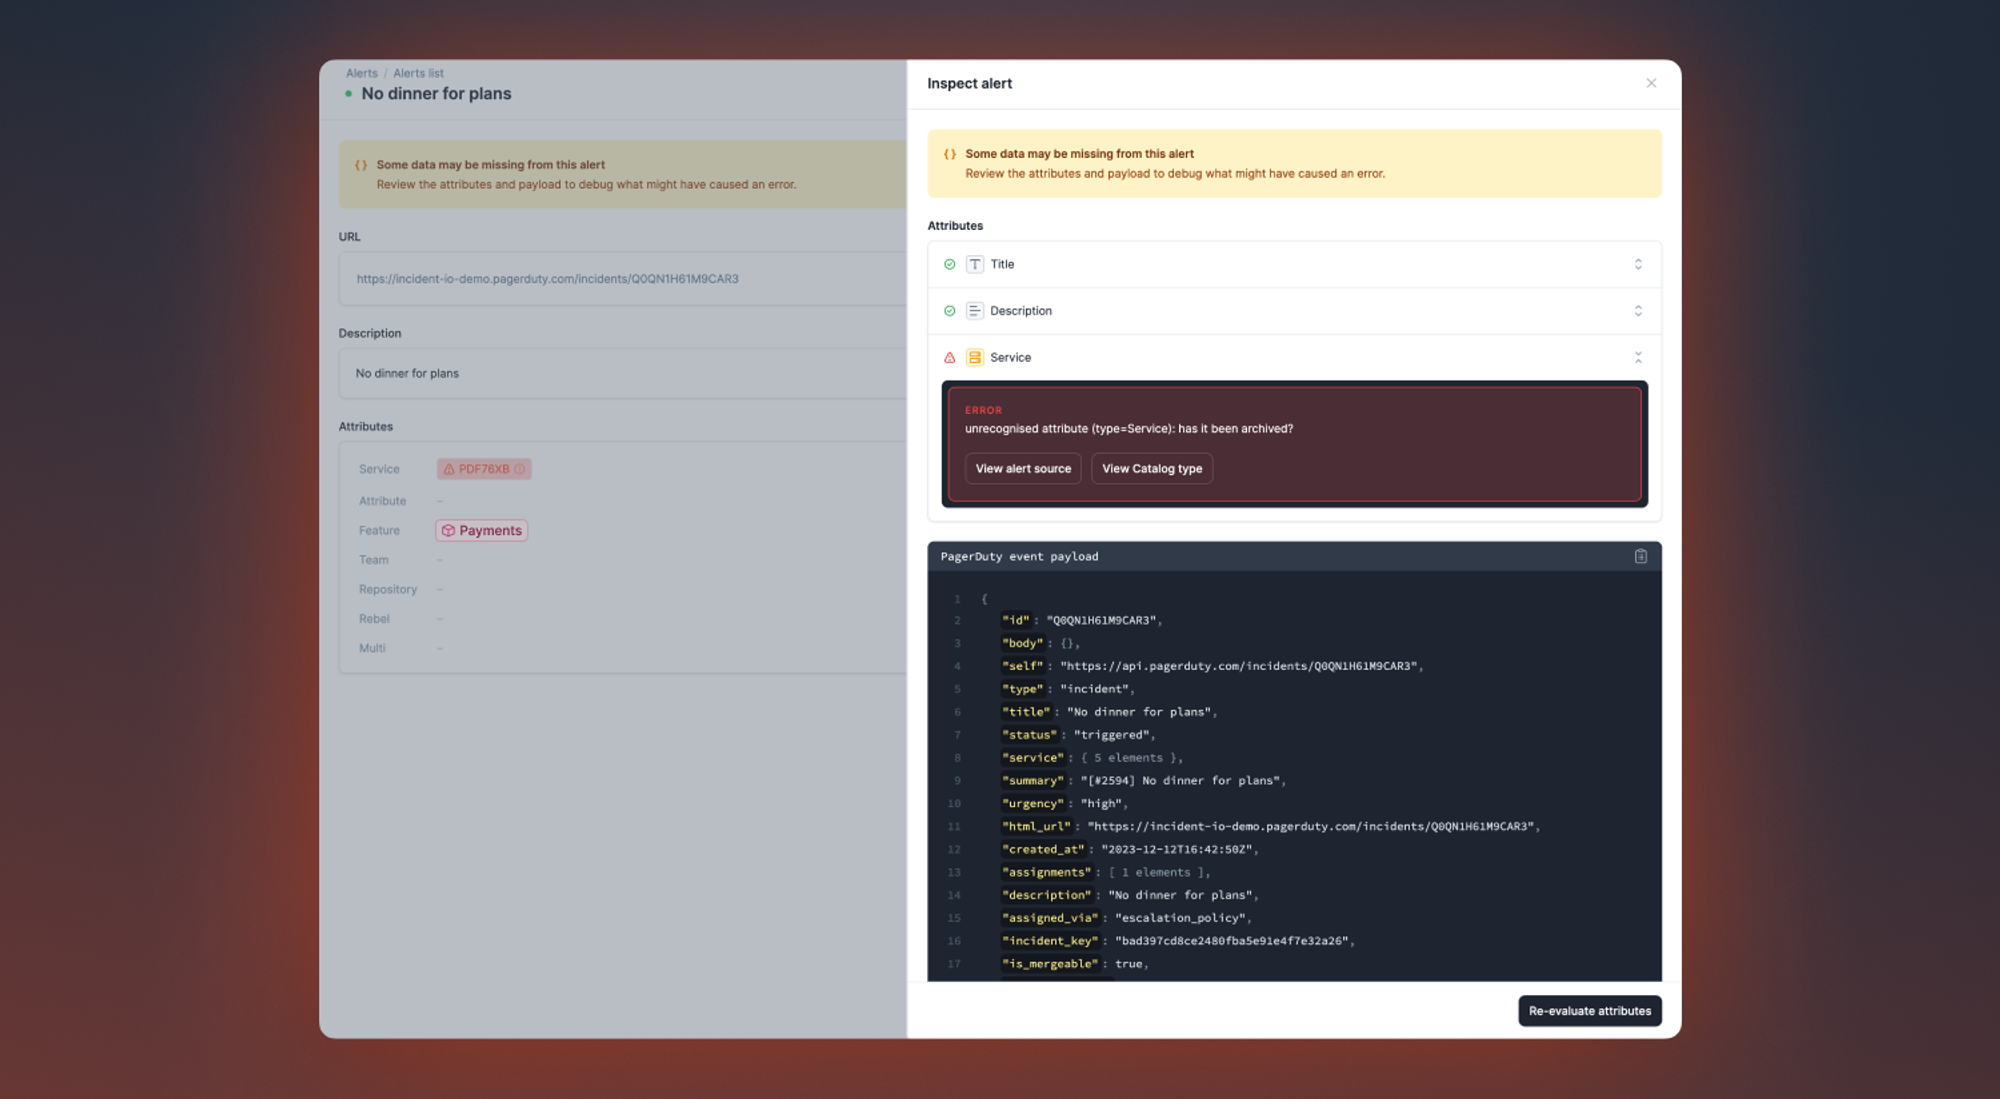
As of this week, we’ve added new functionality which allows you to inspect your alerts, giving you a better understanding of what’s going on under the hood for a particular alert. It should now be significantly easier to debug issues if you find missing attributes on your alert(s).
To inspect your alert, simply click on the Inspect button on the top right of the alert detail page where a drawer will appear. This drawer will let you see what was used to parse an attribute from an event payload and what was actually parsed.

Most importantly, if you have noticed one of your alerts isn’t looking as it should (i.e. there is a missing attribute), you can use this inspector to determine the cause of a failure. For example, if we failed to parse an attribute because you changed its type in the catalog, you can now determine that without having to reach out to the incident.io team.
Ultimately this inspect drawer will allow you to correct any issues by providing the ability to:
- Quickly see if one of your attributes is unexpectedly missing a value
- Determine if the catalog type associated with an alert attribute is correct
- Look for the data you need in the raw alert payload you sent us, and copy it easily to your editor
- Retry evaluating your attributes straight from your dashboard, once you’ve updated your configuration

While we were at it, we gave the detail view for Alerts a bit of a facelift to make it a bit easier to parse information. For example, we pulled the alert source URL to its own space in the page instead of being hidden in the header and pulled related incidents into the right navigation. Hopefully it should be easier to digest when reviewing your alerts moving forward! ✨
🚀 What else we’ve shipped
New
- Taught our AI assistant what retrospective incidents are
- Auto export follow-up to Jira issue templates are able to use variables and create expressions off of the follow-up that will be exported. Example of what you can configure with this is to set the Jira ticket assignee to the follow-up owner.
Improvements
- Related incidents now uses the latest models from OpenAI to generate more useful suggestions
Bug fixes
- Fixed a bug where we were displaying “missing variable” in templated text expressions
- Smoother experience when editing attribute expressions
- Fixed an issue preventing expressions being used when editing escalation forms
- Fixed incorrectly requiring an owner when declaring a task
- Fixed a bug where severities were not correctly selected when changing incident type for a retrospective incident
- Fixed a bug where the 'component impact' dropdowns weren't styled correctly
- Fixed a bug where you couldn't use expressions in the conditions for PagerDuty auto-create
- When exporting post-mortems to Google Docs, include links in italic text
- Fixed a bug where the Salesforce integration wouldn't correctly refresh access tokens
- Fixed overflowing incident titles when deploying a new workflow
So good, you’ll break things on purpose
Ready for modern incident management? Book a call with one of our experts today.

We’d love to talk to you about
- All-in-one incident management
- Our unmatched speed of deployment
- Why we’re loved by users and easily adopted
- How we work for the whole organization


