Insights saved views
November 29, 2022

🔍 Saving filters as a view
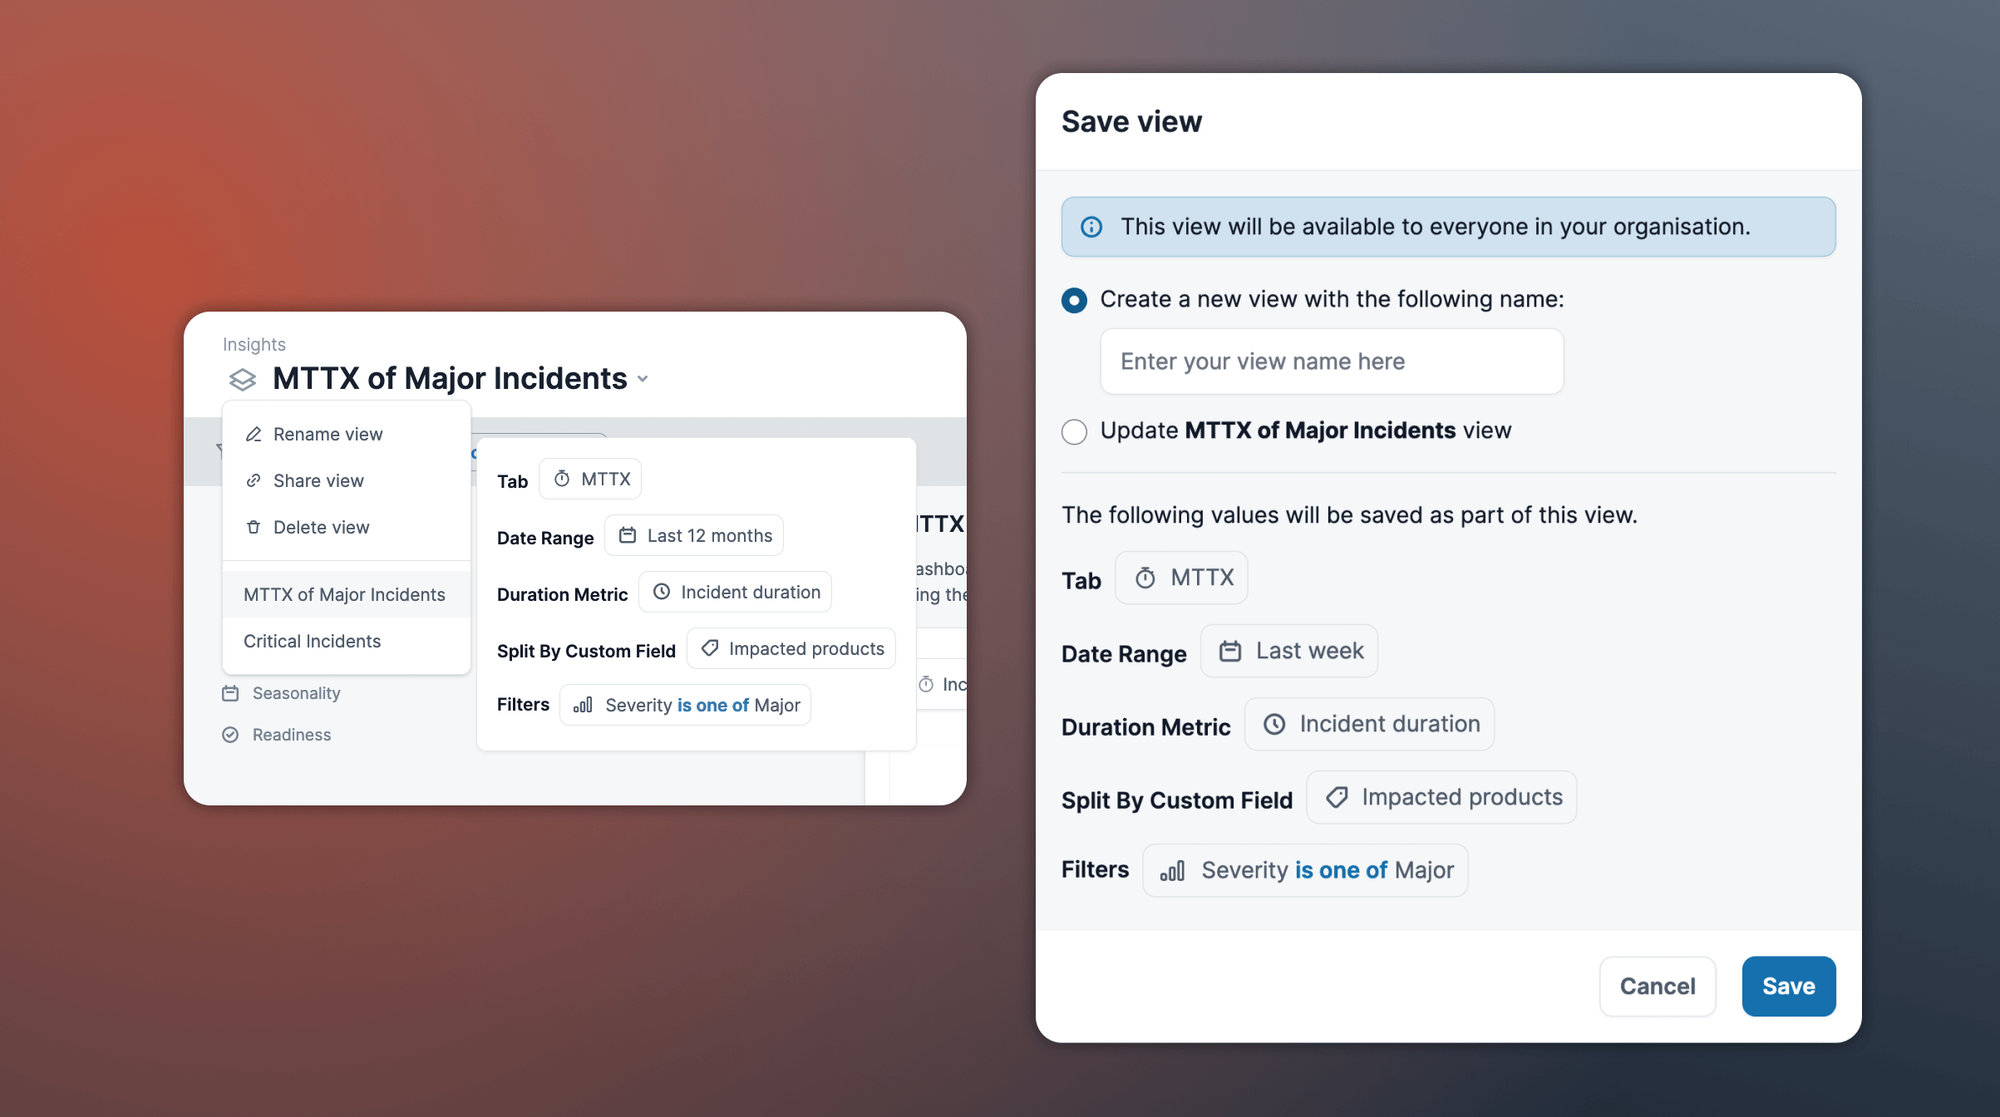
Following on from releasing saved views for follow-ups and incidents in October, we’ve added the same feature to our Insights section, allowing you to save filters that affect each of your insights dashboards.

Each saved view that you create can be given a relevant name, and comes with a unique link that works for anyone in your organization - making it simple to share a specific filtered dashboard with someone in your team.
For example: "Critical severity Security incidents in the past 6 months".
You can access your organization's saved views from the dropdown on the insights page.
👀 Previewing a saved view
When hovering on the name of a saved view in the dropdown, or when updating an existing one, you'll see a breakdown summarising the filters, date range, and dashboard tab included. This makes it quick and easy to preview a saved view before choosing to navigate to it.

🕑 Date range picker
The date range picker for each of the insights dashboards has been moved to the top navigation bar, allowing it to be saved as part of a view. It is now also sticky, meaning it will continue to affect each dashboard as you navigate between tabs.

Read more about how to use saved views in our help centre.
🏁 Performance improvements
We have applied a performance improvement to the way we trigger nudges in the platform, whilst also upgrading our underlying database infrastructure, which has resulted in a noted increase in speed and responsiveness across the entire platform.
🚀 What else we shipped
New
- We now highlight that there are unsaved changes when exiting from creating a new decision flow
- We'll nudge you to provide an internal update when you update your Statuspage (if you haven't sent one recently) to keep everyone in the loop
Improvements
- “Labels” Jira issue field type are now better supported within the export follow-up modals
- The follow-ups page now loads much faster 🏎️
Bug fixes
- Google Meet call links will now consistently update within the Slack channel bookmark
- Statuspage connection errors are handled more gracefully within the platform
- Exported timeline images with text will both be exported to post-mortems
- Numbered lists are no longer removed when pulling a pinned message in to the timeline
So good, you’ll break things on purpose
Ready for modern incident management? Book a call with one of our experts today.

We’d love to talk to you about
- All-in-one incident management
- Our unmatched speed of deployment
- Why we’re loved by users and easily adopted
- How we work for the whole organization


