Powerful insights, saved views and custom field improvements
October 25, 2022

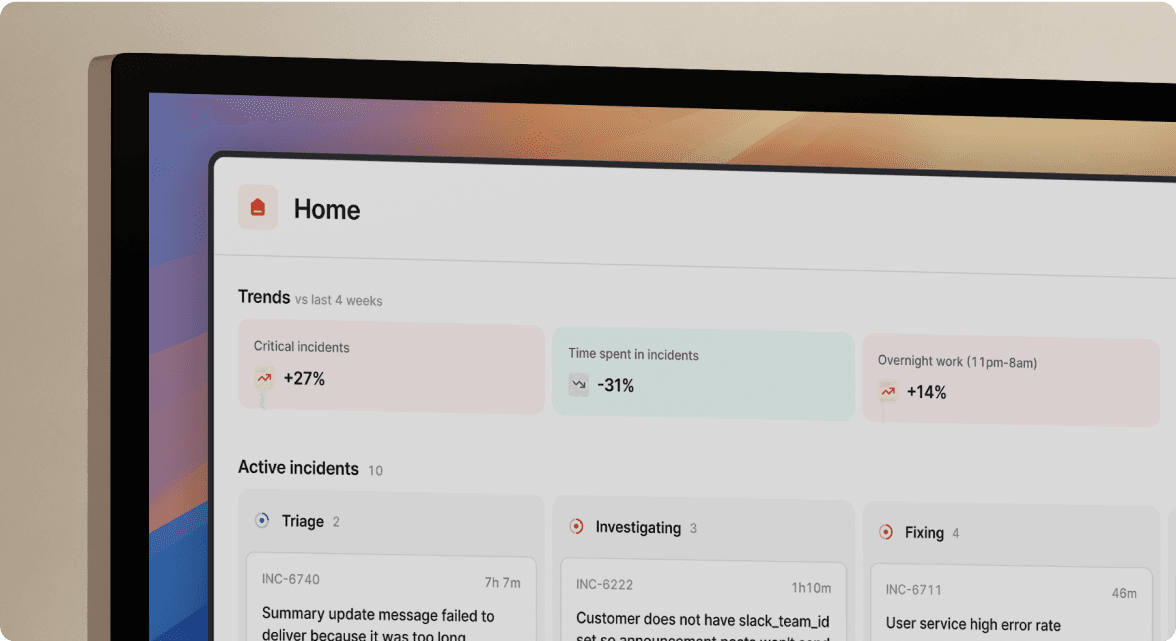
Powerful New Insights
You've built the spreadsheets, pored over the data: you know drawing conclusions from incident data is hard. That's why we've released a load of new dashboards to help you get real insight from your org. Let's take a look, using data from our real account 🔍
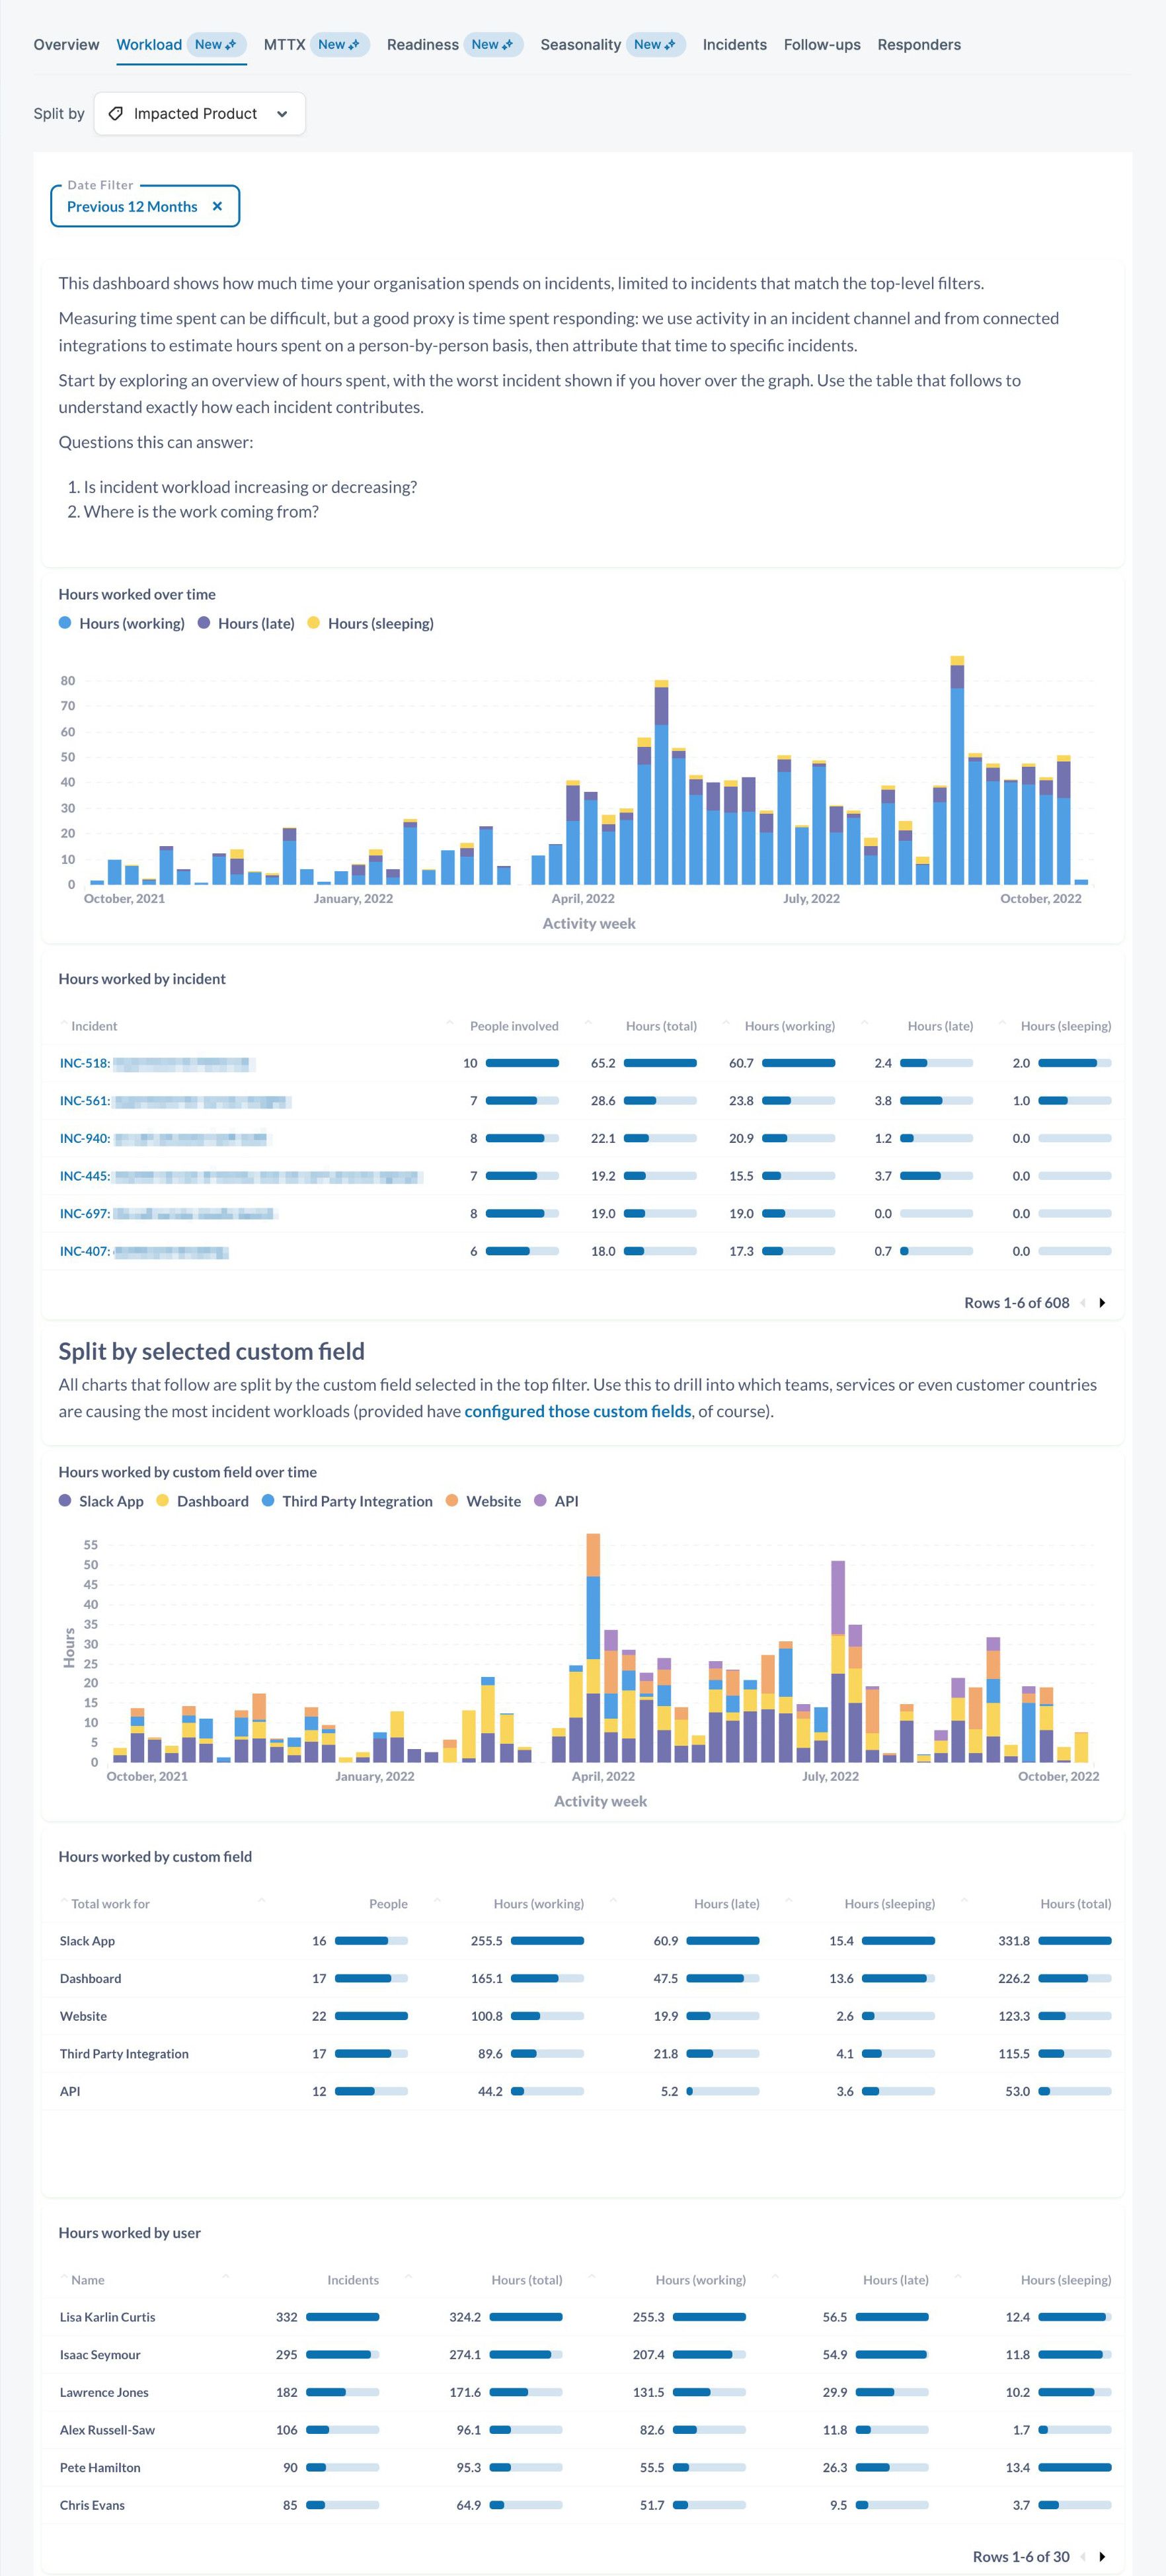
Workload
Where are we spending our time? And where does the work come from? Probably the most useful question to answer, the Workloads dashboard shows time spent on incidents over time, and split by any of your custom field values. View workload trend per service, team or even country.
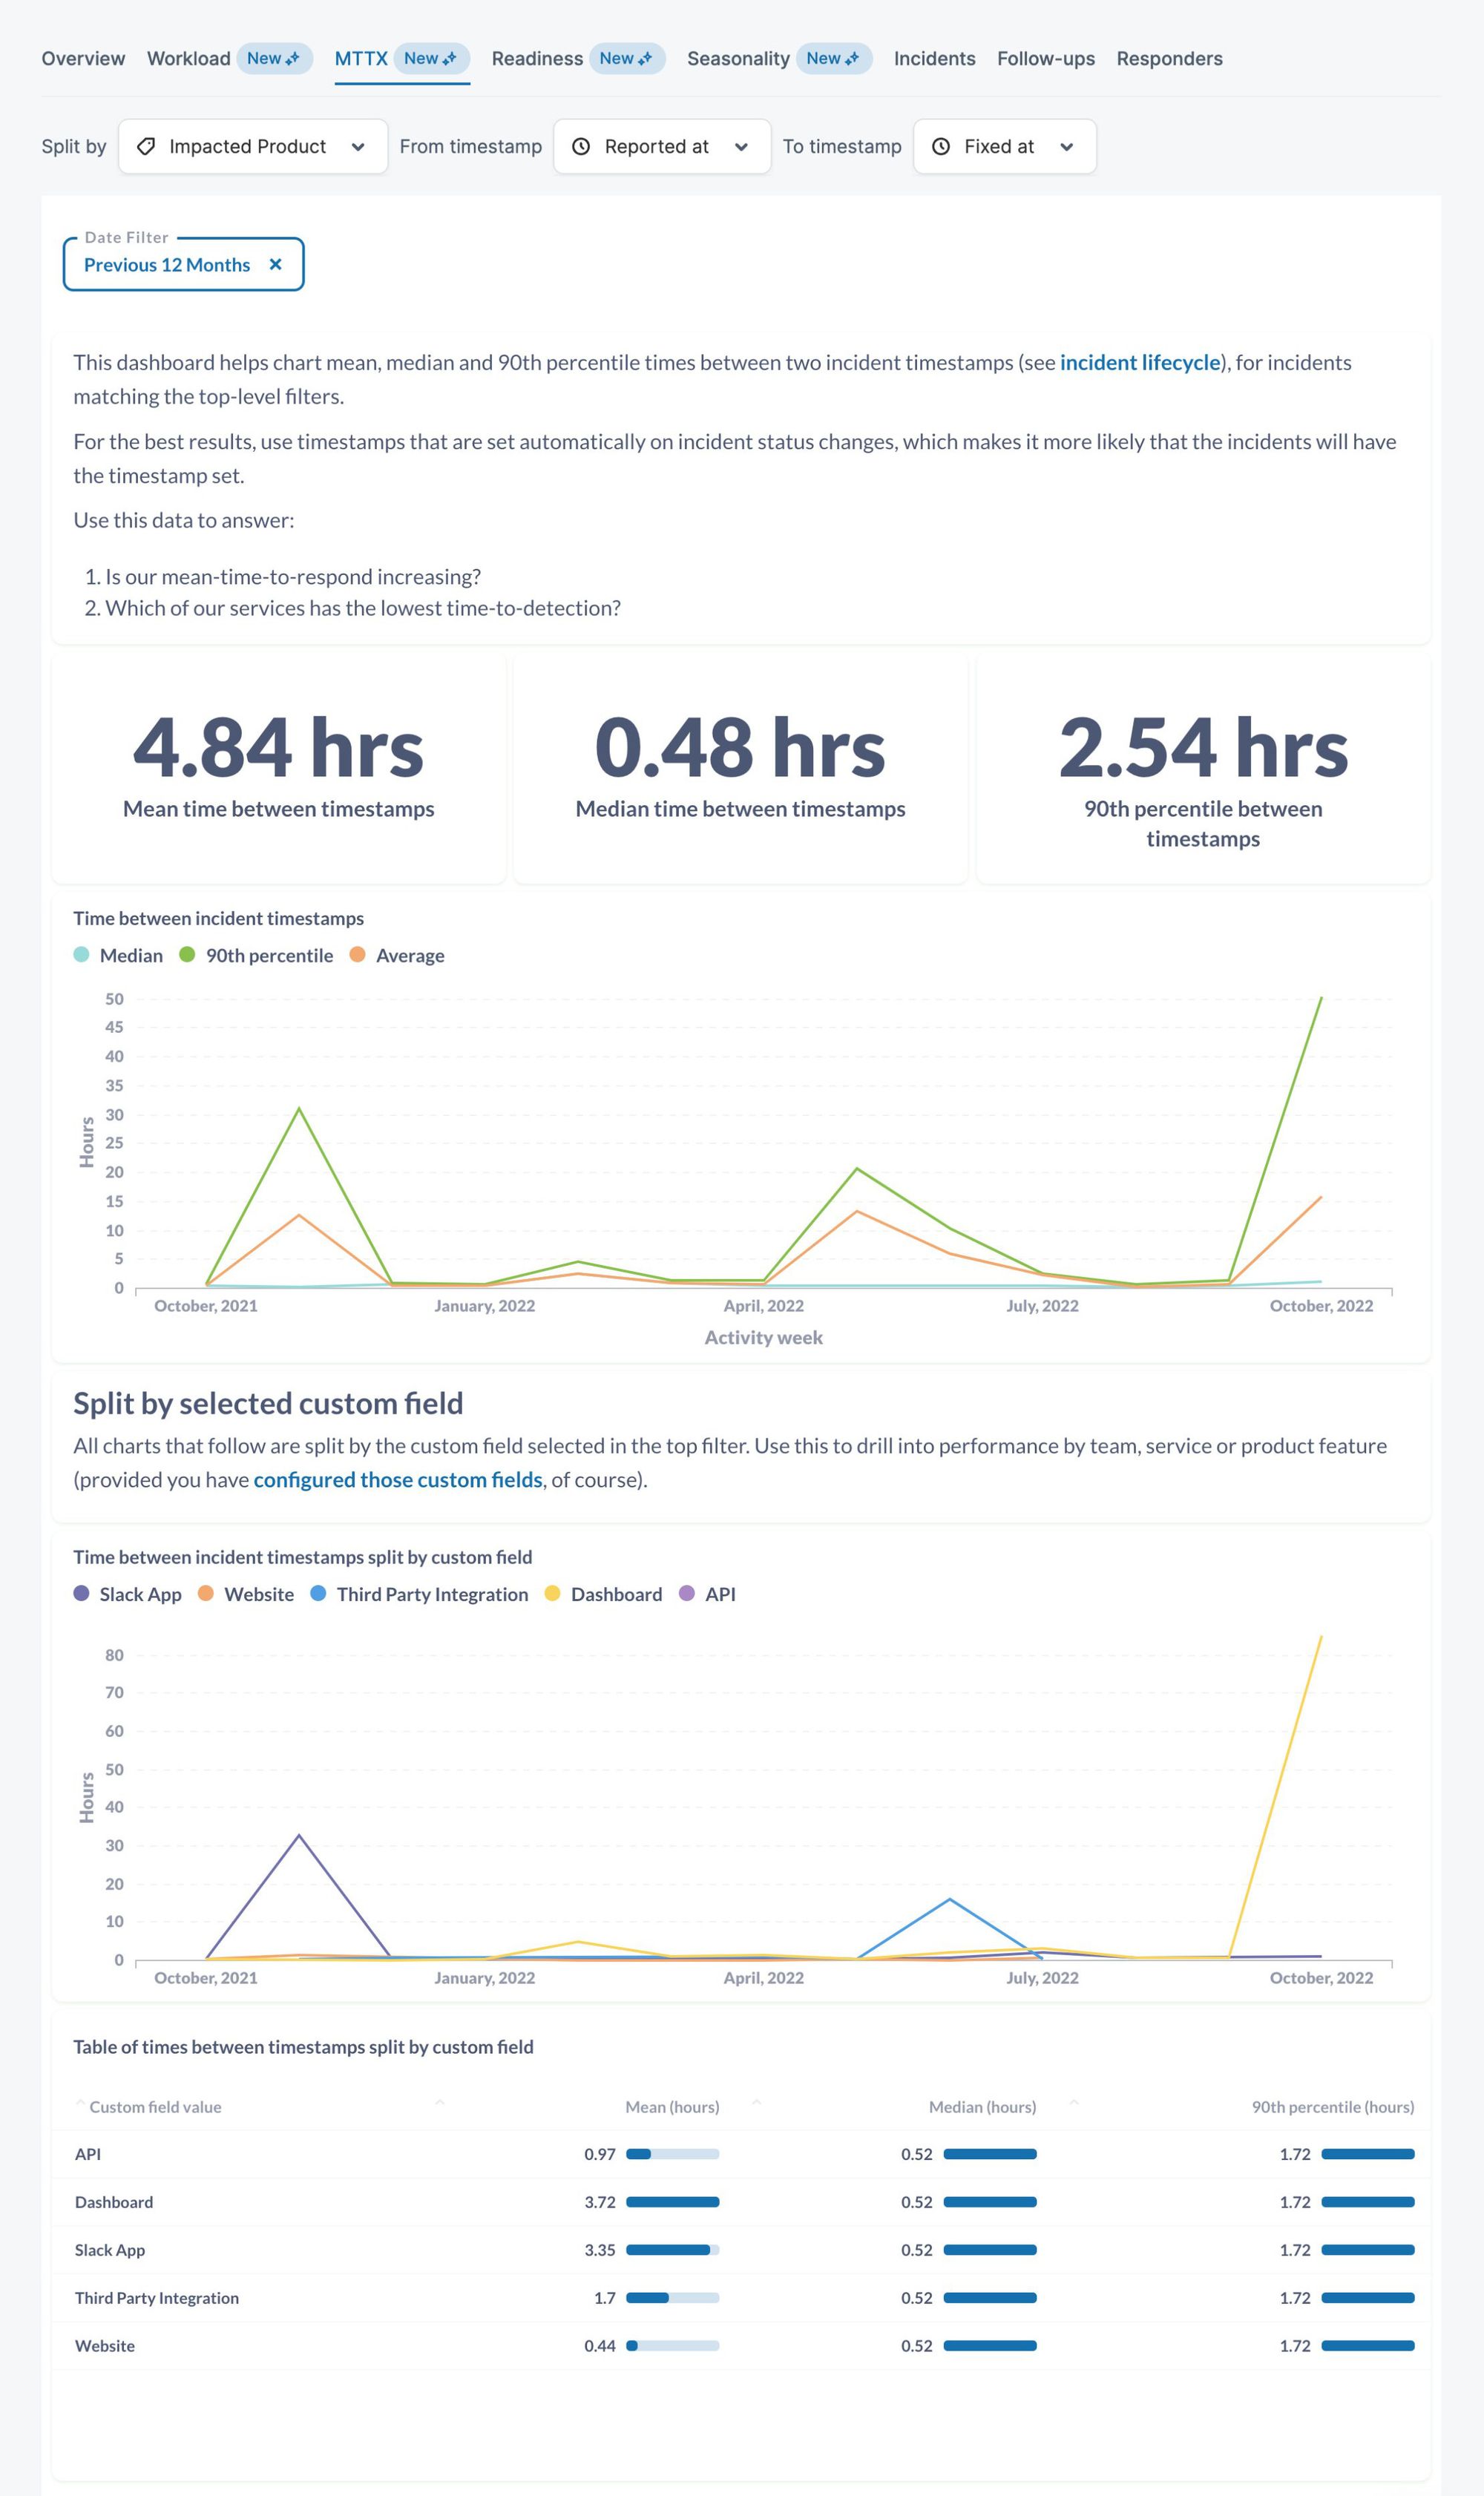
MTTX
MTTX metrics are industry standard, and can be useful in quarterly reviews or tracking performance for specific services over time. On the MTTX dashboard, pick any two incident lifecycle timestamps to see mean, median and 90th percentile performance, split over a custom field of your choice.
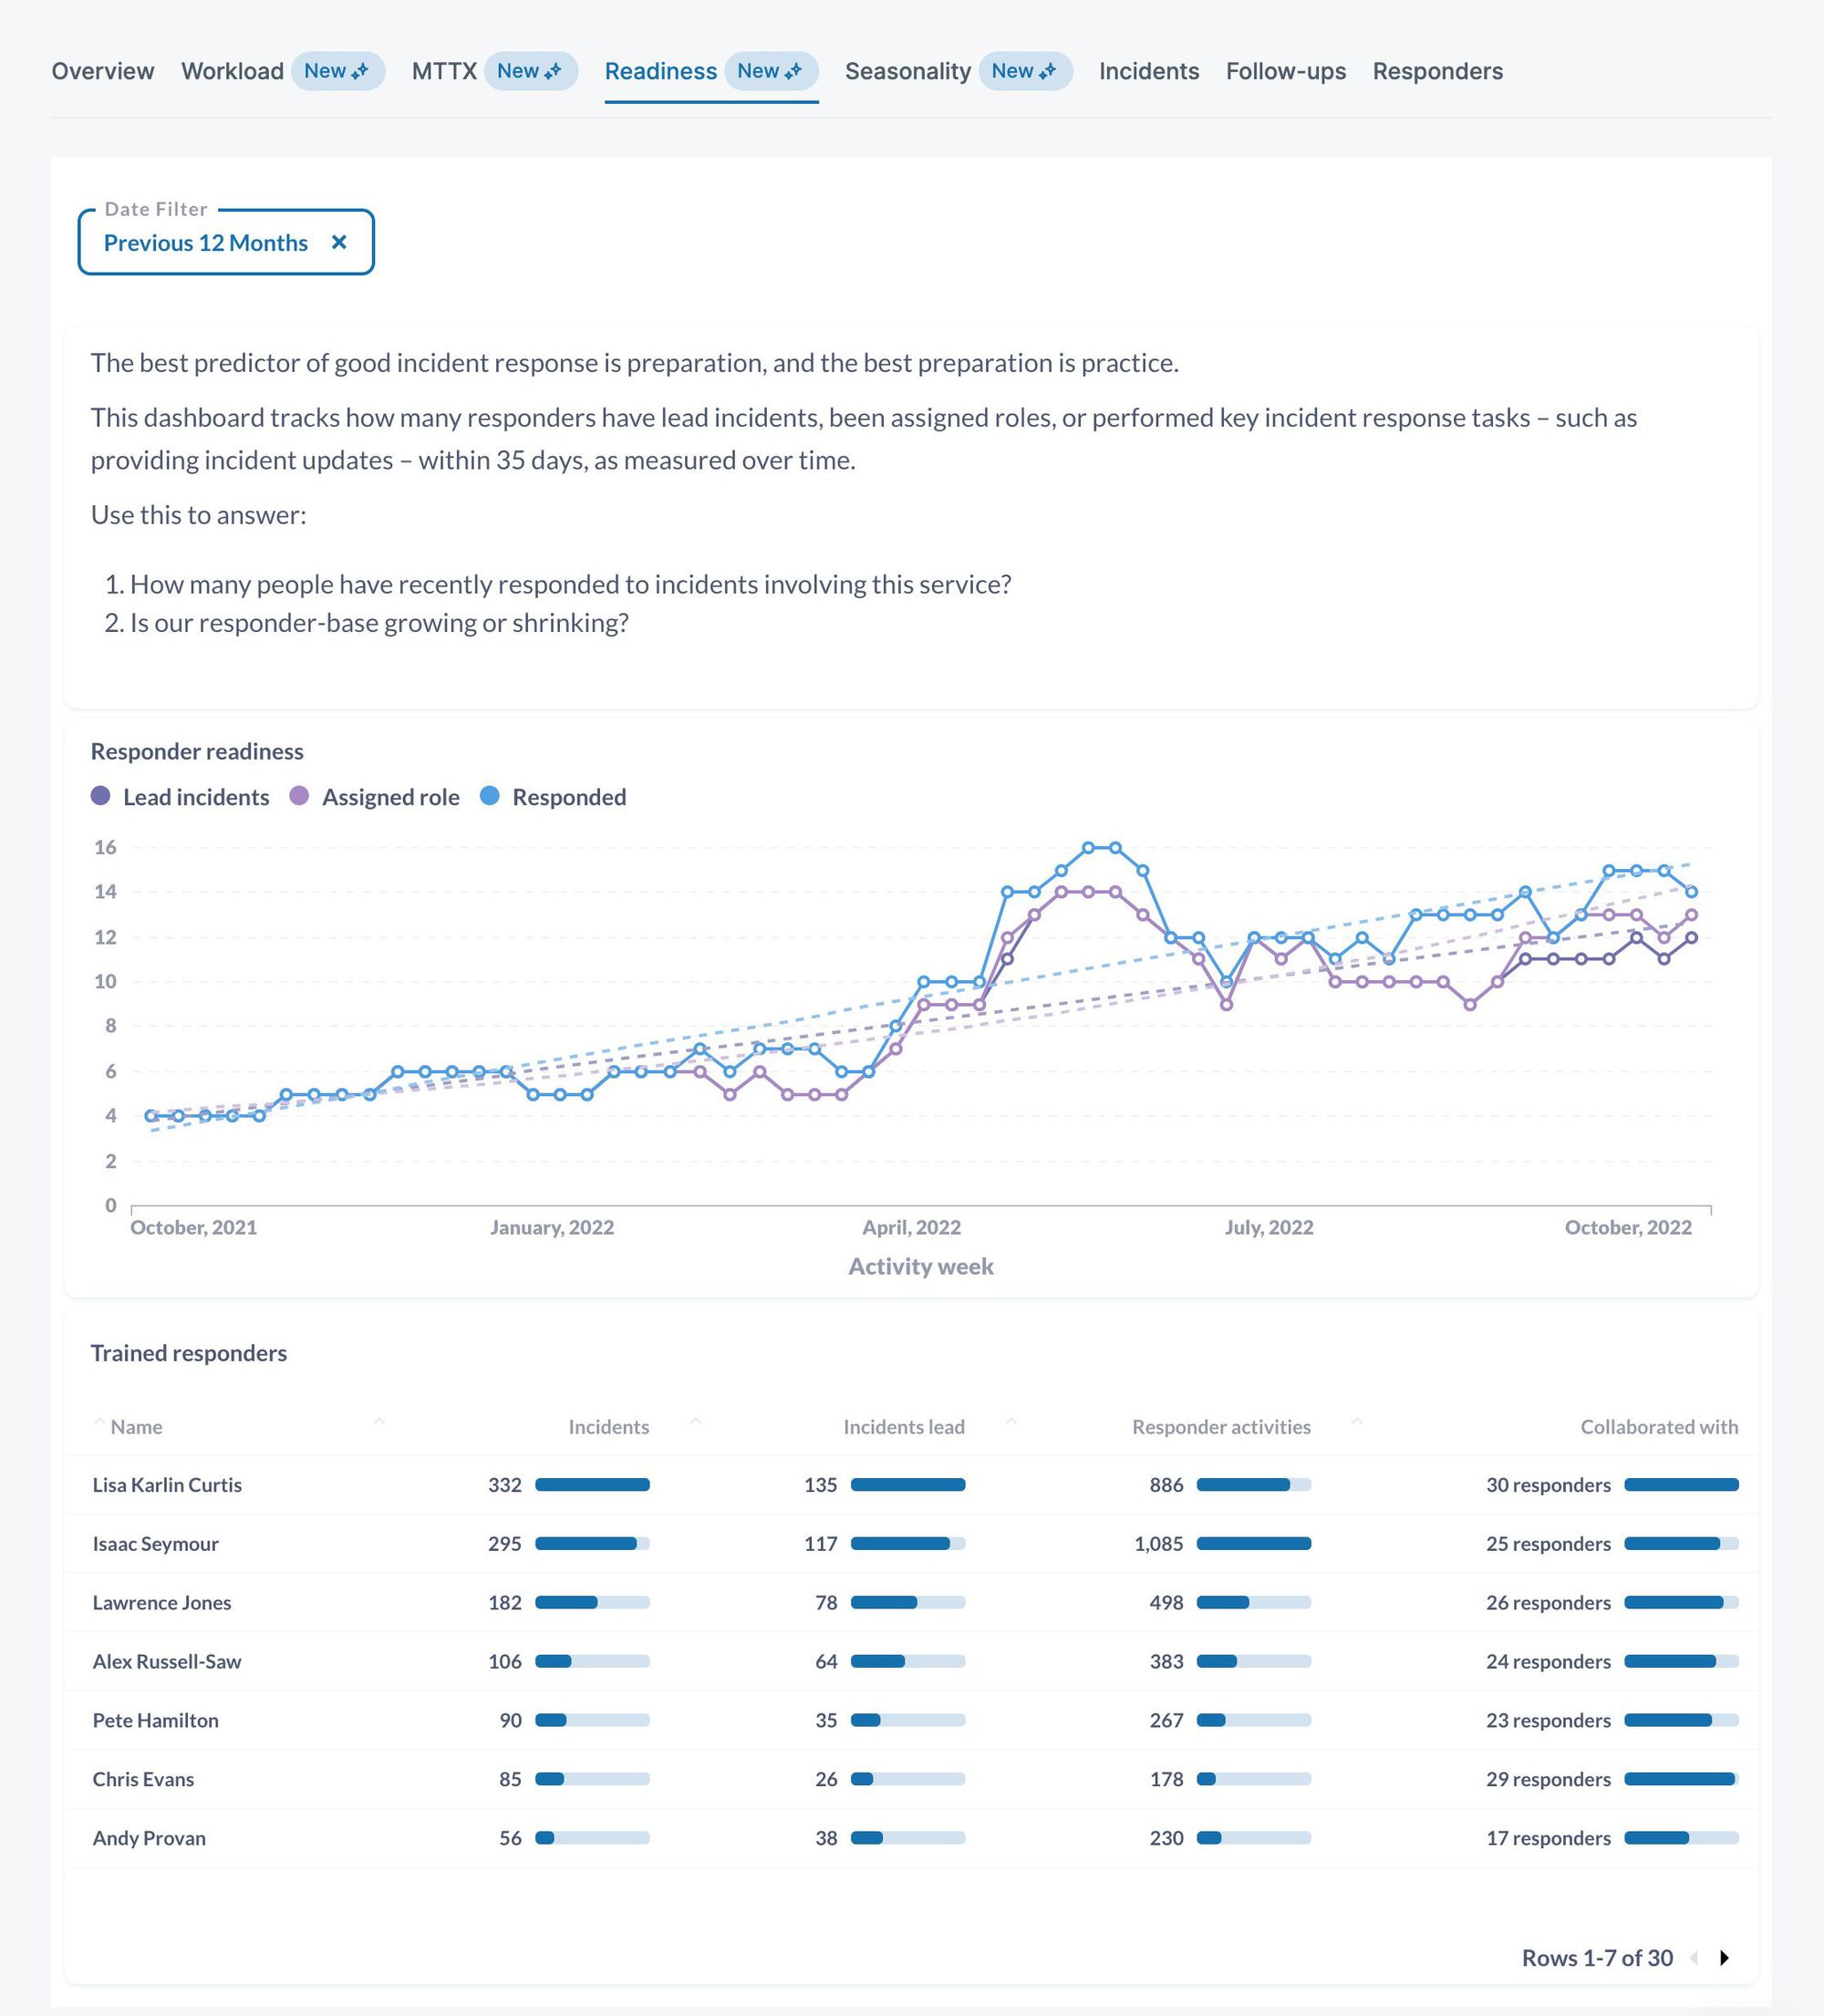
Readiness
Are you growing the number of trained responders? What about for incidents involving a specific service? Answer both with Readiness, showing how many people have recently responded to incidents matching your filters over time. Use this to guide onboarding & training efforts.
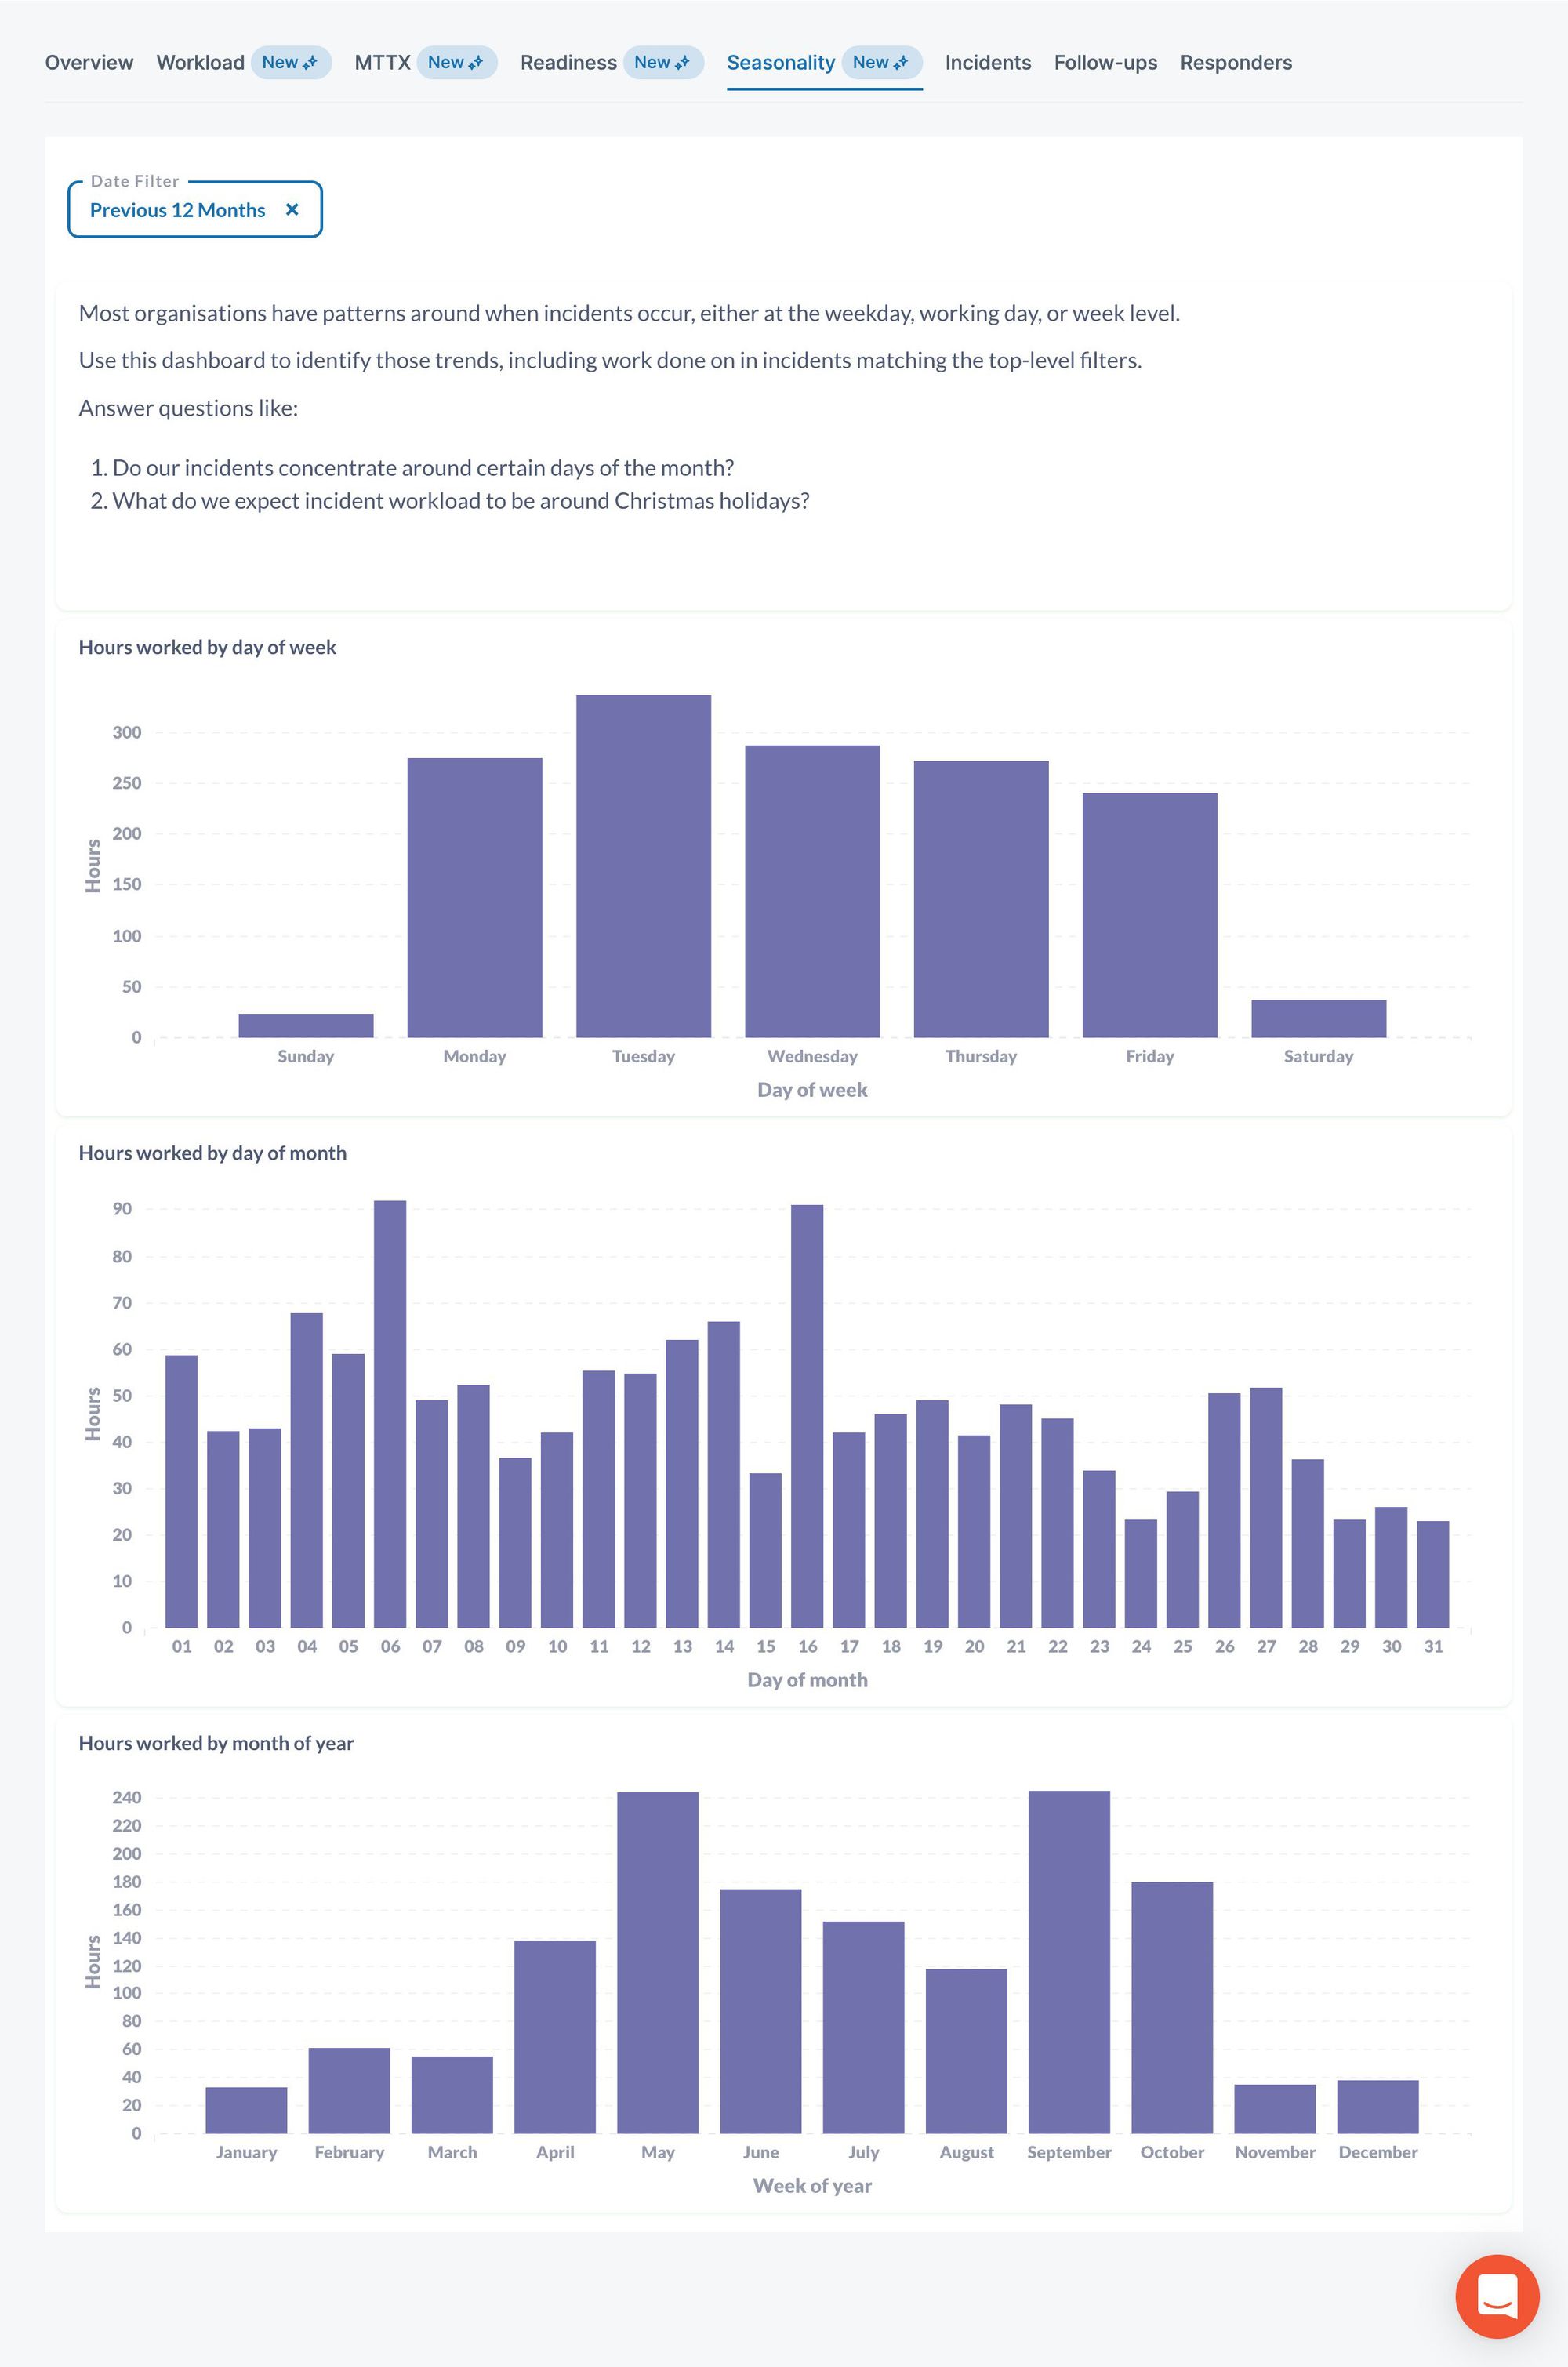
Seasonality
Are there patterns in when your incidents occur? Specific months, or days of month where incident workload peaks? Most companies see seasonal incident trends. Understand what this means for you with Seasonality, helping plan for and anticipate operational work.
Activity
Finally, get a view of incident activity for either your own user or the entire org, looking back over the last year of incident response. We could see our first week on-call, and enjoyed reminiscing about the more interesting incidents. What memories can you find?
Saved views
The follow-ups page now gives you the ability to save your filters to a view. You can give views a name, and each one gets a unique link that you can share. Once you save a view, it's then available to everyone within your organization — making it quick and easy to share a particular set of follow-ups with others. Read more about how to use saved views in our help centre.
You can access all of your existing saved views from the dropdown on the follow-ups page.
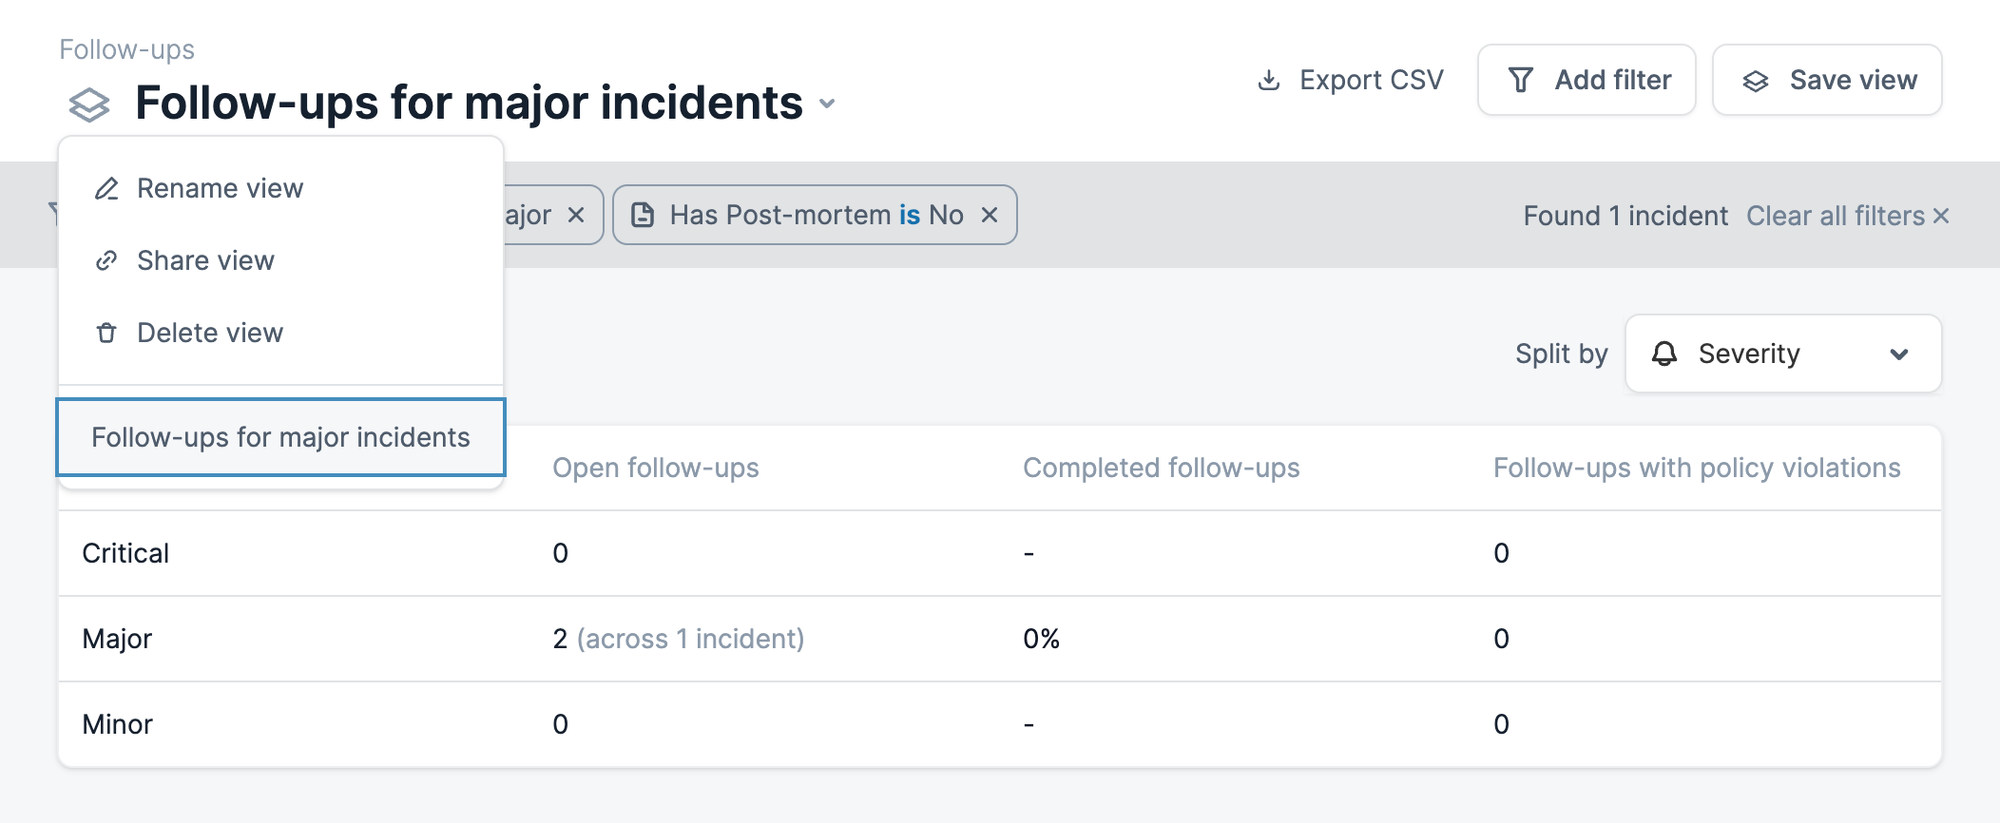
We have also made the saved view sticky, so everytime you visit the follow-ups page it will bring you to the saved view you last viewed.
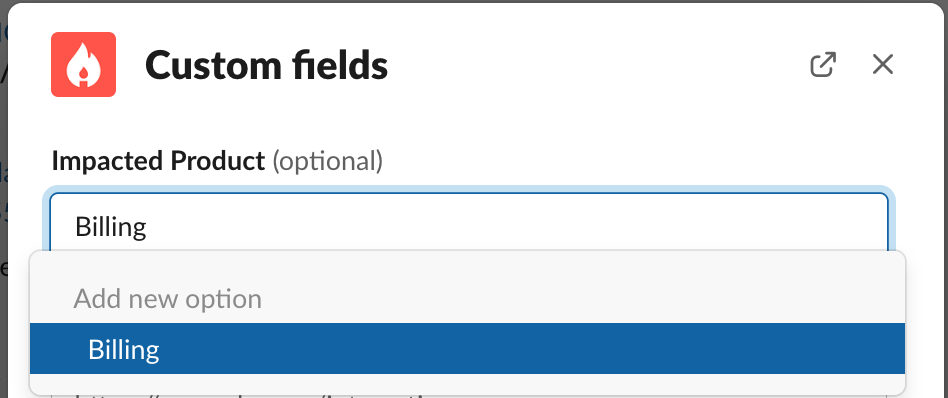
Dynamic custom field options (a.k.a tags)
When configuring a custom field, you can now choose to manage options 'dynamically' for single-select and multi-select fields. That means that responders can easily add new options during an incident, instead of having to go and update the list in Settings every time.
Order custom fields & incident types
You can now choose the order that custom fields appear across incident.io by re-ordering them from the settings page.
You can do the same for Incident types, so that they are ordered within the dropdown in a way that makes sense for your organization.
🚀 What else we shipped
New
- A brand new settings overview page (and generally sprucing up our settings pages)
- You can now provide an update and edit the severity or status of an incident from the incident homepage
- You can now assign roles from the incident homepage
- When configuring PagerDuty auto-create, you can now choose a default incident type and severity, or use expressions to choose it based on the PagerDuty incident
Improvements
- You can now reorder workflow steps when editing a workflow
- We'll warn you before you navigate away from editing a workflow, so you don't lose your changes
- You can now specify which incident statuses a policy should apply to
- We use bold consistently when notifying about follow-ups in Slack
- You can now edit an action from the overflow menu posted in Slack
- It's easier to assign an action to someone just after it's been created
- We'll no longer show
Isaac (Isaac Seymour)when selecting users in Slack: justIsaac Seymour - Link custom fields now truncate in the incident homepage
- The timeline looks a bit clearer when someone creates multiple actions or follow-ups in a short space of time
Bug fixes
- We now reload the announcement rule list page after you've edited a rule
- Policy report times now display correctly when listing reports
- Fixed an issue where newlines weren't working correctly in the incident update screen in Slack
- Fixed a bug where if an incident lead didn't have a Display name in Slack, we would display an empty name in the lead bookmark
- Fixed a bug where policy reports in Slack would include test and tutorial incidents
So good, you’ll break things on purpose
Ready for modern incident management? Book a call with one of our experts today.
We’d love to talk to you about
- All-in-one incident management
- Our unmatched speed of deployment
- Why we’re loved by users and easily adopted
- How we work for the whole organization


