Join live: What happens when your AI goes down?
How savepoints quietly throttled our Postgres queue
October 6, 2026 — 18 min read
At incident.io we are huge fans of Postgres; we've written about it a lot over the years, including how to choose the right indexes and how we're proud of being boring (©The Pet Shop Boys).
We use Postgres as our primary transactional database, which as of today has ~900 tables, and counting! The vast majority of our codebase does something along the following lines: read some data from Postgres, execute some business logic, then write that data back to Postgres.
It is not, however, always that simple.
One of the most complicated uses of Postgres we have in our product is a component of our On-call system we call the “ticker”. The ticker's job is to make sure that every active escalation is in the right state, checking who's acked or nacked, and progressing the escalation to the next level of its path if needed. At the moment, we do this about 15 million times a day.
The ticker's indicator of what escalation needs to be worked and at what point is a Postgres-backed queue, very similar to the shape described by Brandur (Postgres Job Queues & Failure By MVCC), whose work we're also big fans of.
In this post we're going to cover a number of performance pitfalls you can fall into with these systems, and how we solved them. One of the worst possible ways to learn a lot about Postgres internals is by debugging something like this while it's hurting production; we've learned a lot from load testing that can hopefully help you avoid these mistakes.
The end result of running through all of these performance tricks was a 3.5x improvement in our peak escalation capacity at our current size, as well as removing a number of bottlenecks that damped our ‘scaling curve'. We're really excited about these results, and this post will walk you through what we learned.
A dispiriting performance ceiling
Recently, we've been doing a lot of load testing as part of the reliability work we're doing across the platform. We want to understand how our system creaks under the most extreme load. When we do this work, we disable a number of protections we run in production, like rate limiting. We want to see what performance looks like without these constraints so we can push the system to its limits, with a view to doing performance work that enables us to raise these limits for customers.
We wanted to be able to fully saturate our database doing useful work: as the number of concurrent workers (and work to be done) rose, we'd reach our eventual CPU ceiling, at which point we could get a bigger CPU. Unfortunately, however, there were bottlenecks in our system that slowed us down before we were able to saturate the database. There was something about our implementation that was causing us to not be able to use all our cores for work all the time. Given turbopuffer's conjecture “Typically when there's a large gap between napkin math and reality, it means there's either a big opportunity for optimisation or a bug in our understanding” (yet to be disproven by Fable), there had to be performance gains available to us that were within reach, so naturally, we went looking for them!
An anatomy of a function call
I'm going to be talking about some ticker internals in this post and how they got slow under load, and then how we fixed that, so it's worth us breaking out what these terms mean and what they're doing under the hood.
acquireAndTick
In the ticker the main ‘work loop' was calling this function on repeat — it has two constituent parts, acquire (which fetches escalations to tick) and tick (which actually ticks them, more on that later).
acquire
The acquire function is remarkably simple: the heart of it is a database query that looked not unlike this:
SELECT *
FROM escalations
WHERE next_due_at <= now()
ORDER BY next_due_at ASC, id ASC
LIMIT $batch
FOR UPDATE SKIP LOCKED;
This query is normally very fast. Let's break it down:
- We take an
UPDATElock on theescalationsrows, preventing competing processes from updating them while we're ticking them. - We
SKIP LOCKEDso we don't try to acquireescalationswhich are currently being processed. Without this, we'd hitlock_timeoutswaiting for competing processes to tick those same escalations — we run many concurrent workers in parallel, and they'd all contend with each other! - We then order by
next_due_at, which is indexed, usingid(the primary key, K-sortable) as a tiebreaker, and takebatchSize(at this point a hardcoded value) of entries.
The latency we expect of an acquire function in production is a p50 of 10ms and a p95 of sub-20ms.
tick
Next up, once we have the work, is to tick the escalations we've acquired. The logic was basically as simple as “loop through the escalations we've acquired, and call tick on each one while we hold a lock against the batch”.
We previously (we'll come back to this) ran each tick inside its own subtransaction after claiming the rows to be ticked, using Postgres' SAVEPOINT command (SAVEPOINT). This meant that a single tick transaction failing didn't dirty every tick in the batch.
Ticks are a more business-logic-intensive operation than pure acquisition, and the operation is more ‘branchy' because of this: some ticks need to advance an escalation to the next level of an escalation path, notifying new users and looking up a round-robin policy when doing so; others are ‘no action required'.
This means latency here is a little less regular than acquisition, but we expect the p50 to roughly be ~25ms with a sub-100ms p99.
The unbearable slowness of acquisition
Anyone that's a seasoned Postgres-backed-queue blog post enjoyer knows where this goes next: under load, acquisition began to slow down.
Under normal load, the ‘seconds per second' of work distributed inside the ticker is about 5:1 in favour of ticking. Under heavy load, acquire began to dominate the workload entirely. Even worse, adding more ticker workers couldn't help us ‘burn through' this; an increase in workers just increased the amount of acquisition we were doing.
But why? Why had we slowed down? To this point?
There's one telling metric every time you see a slowdown like this in a queue: the amount of data you're fetching from shared_buffers for the table you're acquiring from. Our first tests at heavy load peaked with us fetching 136 GiB/s of data from shared_buffers for that table. It's worth saying that in Postgres this metric counts the total size of the pages you're accessing logically, so we're not actually loading that much, but still — this is a problematic number, equivalent to about 6 Blu-rays, or, for the younger readers (we have interns every year — apply!), roughly 160 hours of TikTok, every second.
This all points to there being a specific underlying failure mode, and to understand it, we need to dive into how Postgres stores data on disk.
Postgres stores its row data in tuples; you should read this Crunchy Data post if you're unfamiliar with the concept. One row can have many tuples, each representing that row's data at a particular point in time. The reason for this is that different transactions might need to see different versions of a given row's values, so we can only clean up old tuples when all the transactions that need to see that data have finished.
When acquisition slows down, this usually means some process is blocking this cleanup: dead tuples are accumulating but nothing is pruning those old rows.
If we're going to continue using a Postgres queue (we are, for the next little while — another post on what we did next will come later!), this isn't really something we can get away from. We do a number of things to make sure that we don't get into these situations in the first place, for example, we ban long-running transactions. However, cleanup can be held back by any number of processes, including operational things like read replica replication.
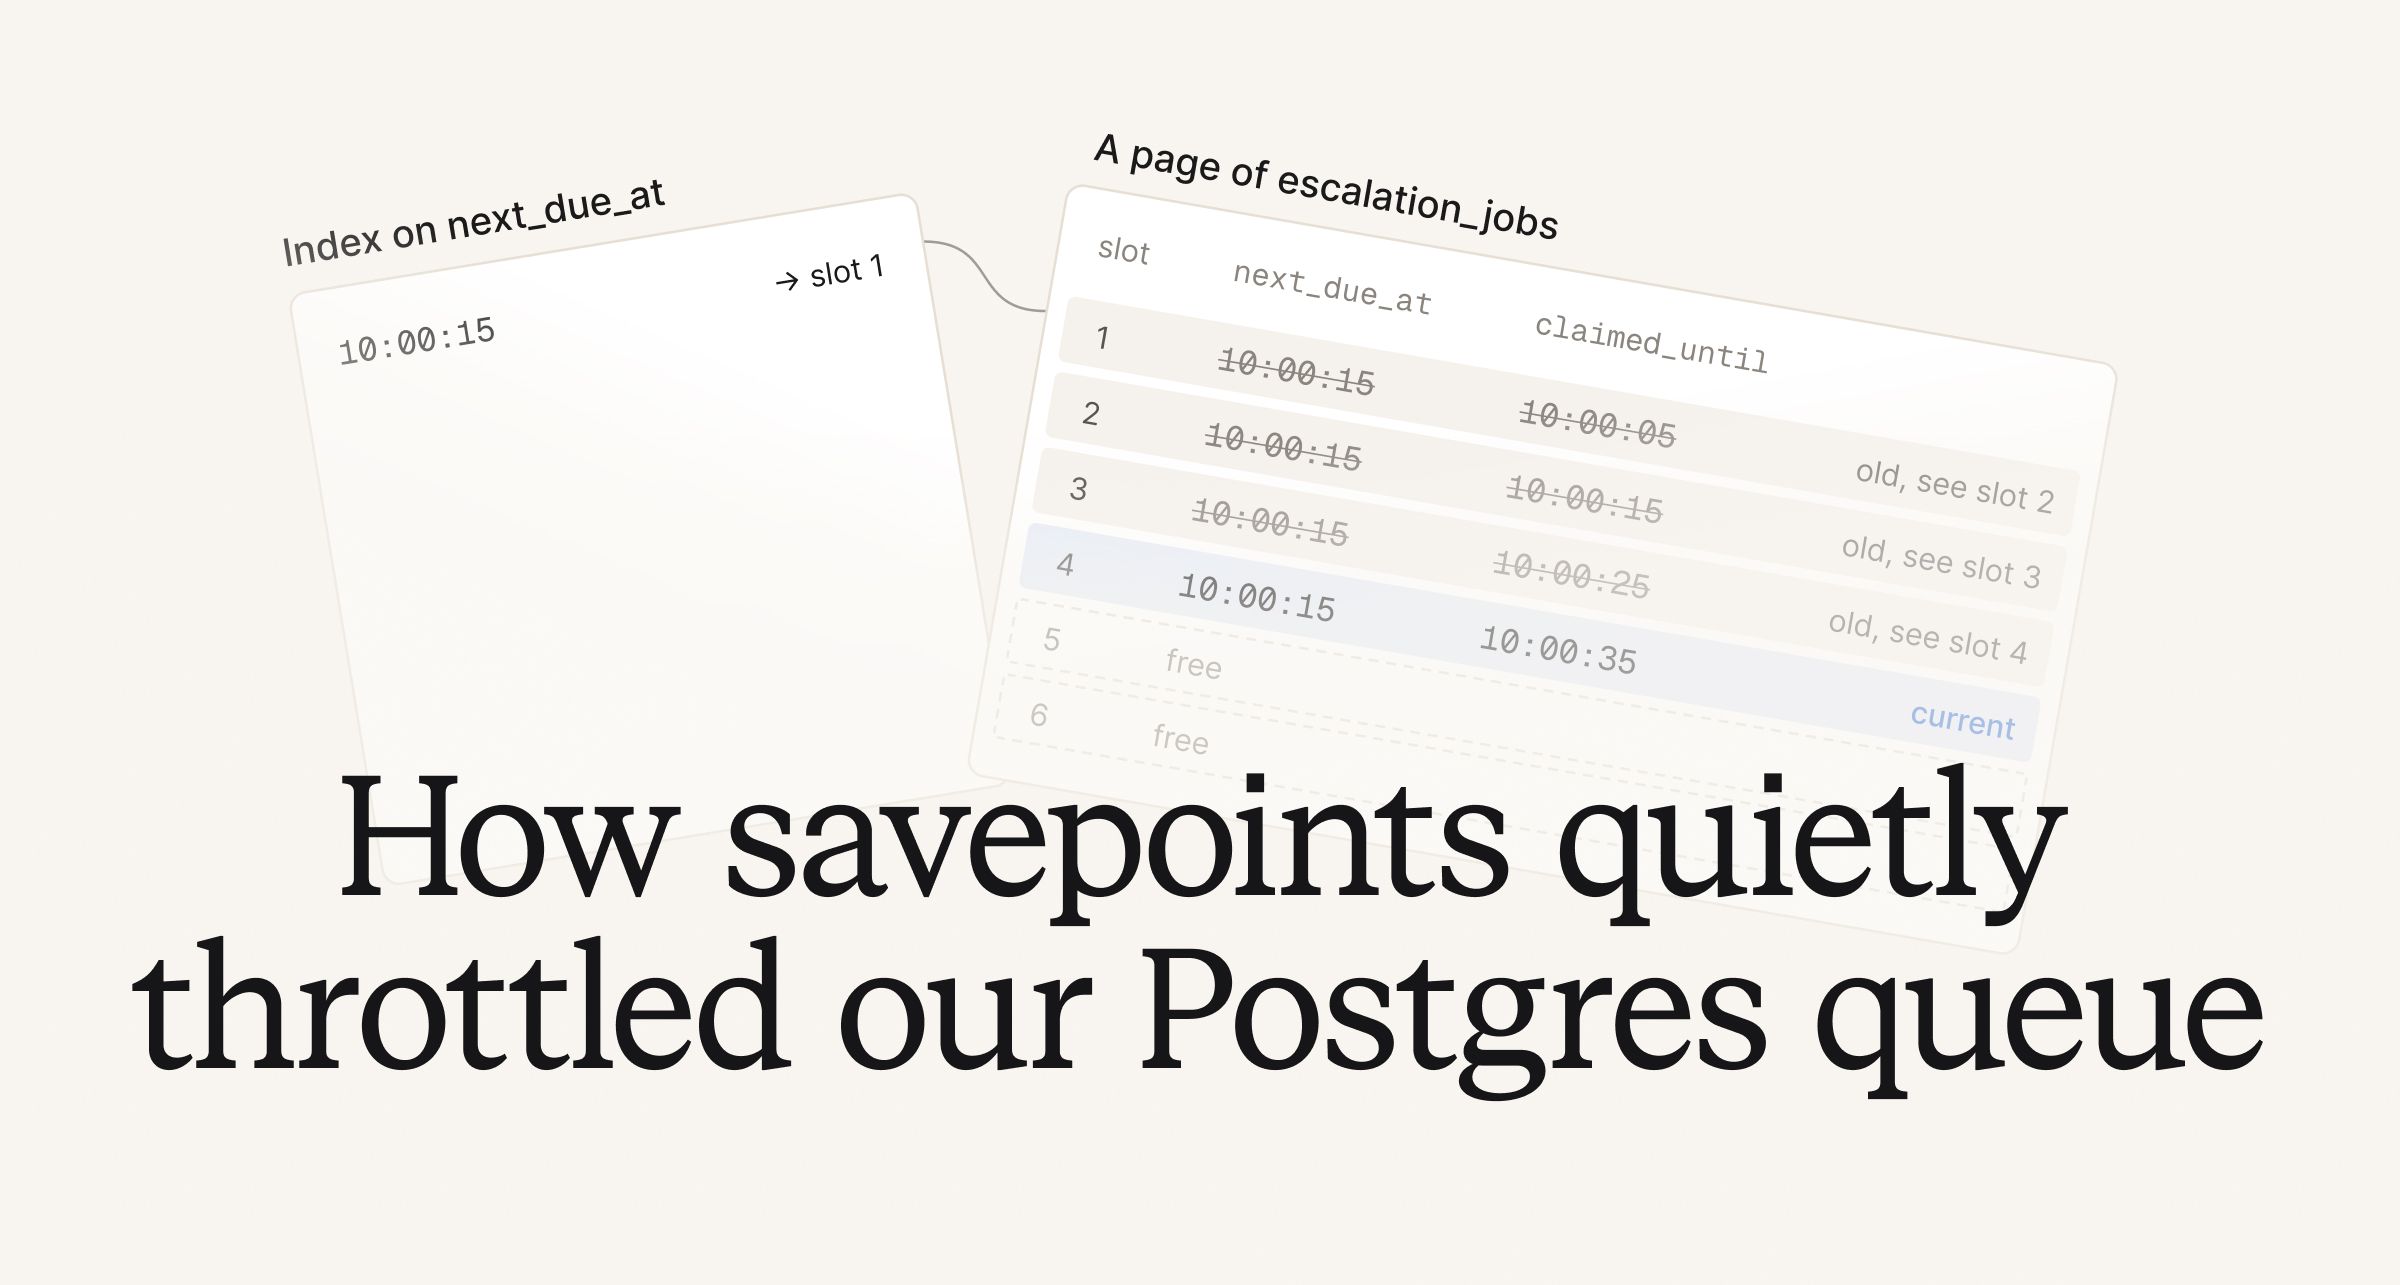
One thing we can do is make each tuple smaller. For us, this meant moving the queue from the escalations table (which contains all information about an escalation) to a table named escalation_jobs, which is the minimal queue representation of the work to be done for a given escalation. On disk, this means that a given escalation_job is anything between ~15x and 60x smaller than an escalation.
LWLock:MultiXact-ly!
During our load tests we started to see a rise in LWLock waits in GCP Cloud SQL's metrics. As we increased load, the percentage of time the database was spending waiting on internal Postgres locks climbed and climbed. Eventually, it began to totally dominate all of the time we were spending in the database.
We thought that this would've been solved by our earlier work: a common issue people hit with this type of workload is LWLock:LockManager waits. Matt Smiley from the GitLab reliability team goes into this in great detail here.
In earlier versions of Postgres, too many relations (indexes, foreign keys) on a single table could cause slowdowns in performance. The older escalations table fit this shape, but moving to escalation_jobs, which didn't, had no effect.
Cloud SQL's Query Insights only shows the class of wait event, not the details of the wait event itself. We could see it was an LWLock, but there are many flavours of LWLock — we needed to be sure we were targeting the right one.
Not the standard failure mode
Follow this section along with this visualisation — it'll help you understand what's happening inside the database!
Running a load test again while sampling pg_stat_activity began to show something else: the flavour of LWLock we were specifically hitting was LWLock:MultiXact.
What's this, I hear you ask?
Well, you know how earlier we spoke about how we used subtransactions to tick each escalation? Internally to Postgres, transactions are tracked via a reference to the xid of the transaction that created or locked a given tuple. When you lock a row, Postgres records the locking transaction in that tuple's xmax field. That works perfectly when exactly one transaction holds a lock on a row — but xmax only has room for one identifier.
We're in a bit of a bind here — these rows are locked by more than one transaction (the subtransaction and its parent), but we have no way of indicating that.
To get round it, Postgres maintains a separate ‘multitransaction' infrastructure to handle these scenarios. Multitransactions have their own ID range — separate from the basic transaction ID range. Postgres sets the tuple's xmax to the multitransaction ID (henceforth, MultiXact) and then sets some tuple-level metadata to say that this ID lives in the MultiXact space, not the normal transaction space.
These live in pg_multixact, a pair of on-disk structures, offsets and members, that Postgres reads through a small, dedicated in-memory cache. offsets tells Postgres where to look inside members for a given MultiXact ID, and members holds the actual list of transactions and the locks they hold.
This means that to check who holds a row with a MultiXact, we now need access to this data. If this data changed in flight, that would be a problem for query correctness, so access to it is guarded by, you guessed it, an LWLock!
Now think about what acquire does: SKIP LOCKED means walking past every row another worker is currently ticking, and in our world every one of those rows had a MultiXact in xmax, because every tick ran inside a savepoint. Each row skipped meant a lookup. Each worker we added meant more rows locked, more MultiXacts minted, and more workers queueing to read them, all through the same LWLock-gated cache. That's why adding workers slowed us down: each one just added more lock contention.
How we fixed it
The good news about a problem you've caused yourself is that you can stop causing it!
Doing so here is pretty interesting: rather than wrapping each tick in a subtransaction, we split acquiring work from doing it.
Instead of opening a parent transaction up front, we run a query that looks like this:
UPDATE escalation_jobs
SET claimed_until = now() + interval '10 seconds'
WHERE escalation_id IN (
    SELECT escalation_id FROM escalation_jobs
    WHERE next_due_at <= now()
      AND (claimed_until IS NULL OR claimed_until < now())
    ORDER BY next_due_at, escalation_id
    LIMIT $batch
    FOR UPDATE SKIP LOCKED
)
RETURNING escalation_id, next_due_at, claimed_until
We then process these escalations inline, one by one, each in its own transaction.
This removes subtransactions from this part of the ticker entirely. When we load tested it, MultiXact waits didn't disappear completely as a wait class, as there are other subtransactions elsewhere in the system, but they never came close to dominating our time in the database, even under the heaviest load.
What does it cost us? Well, now if the process dies after claiming a row, and before we've managed to tick it, we pay a latency penalty of up to 10 seconds, during which it's claimed but not being worked. During a graceful shutdown we finish all claimed work before exiting, so this only happens when the machine dies underneath us.
This is a tolerable delay in a system like ours, for an edge-case scenario that rarely occurs — and we alert on sustained delay across anything more than a small subset of escalations.
Why claimed_until isn't indexed
Every update in Postgres writes a new version of the row. When you're writing to a column that's indexed, every index on the table has to get a new entry pointing at that new tuple.
We update claimed_until regularly, it's one of the biggest sources of tuple-churn in our entire queue. When we're clearing dead tuples, a lot of what we're doing is clearing the old tuples of escalation_job rows before they had claimed_until set.
A HOT (heap-only tuple) update skips that: if none of the changed columns are indexed and the new version fits on the same page, Postgres links it from the old version and leaves the indexes alone.
It also makes old versions cheap to clean up. Nothing in an index points at an old HOT version, so the next query that reads the page can clear it out on the spot. An old version with index entries pointing at it has to wait for vacuum, which cleans the page and every index together.
So we kept claimed_until out of every index, and left 15% of each page free (fillfactor = 85) so there's room for the new version. next_due_at is indexed however, so we still need to tune our auto-vacuum settings to be relatively strict, but this helps us achieve some level of frequent vacuuming automatically.
One claimer per pod
The last optimisation we'll cover today was a rewrite of our (at this point) more naive acquisition process. Splitting the claim from the ticking logic fixed our MultiXact problem, but every worker was still running its own claim query.
With N workers on P pods that's NxP SKIP LOCKED scans fighting at the head of the queue, walking past rows the others have just locked.
So, given this, what did we do? Well, now the acquire and tick of acquireAndTick are fully separated. We run a single ‘dispatcher' goroutine in each pod which communicates with the workers (that run tick) over a buffered channel.
Workers block on that channel instead of polling Postgres, and the number of concurrent claim queries drops from workers × pods to just pods!
func dispatcher(ctx context.Context, jobs chan<- Job) {
	for ctx.Err() == nil {
		free := cap(jobs) - len(jobs)
		for _, job := range claimJobs(ctx, free) {
			jobs <- job
		}
		time.Sleep(pollInterval)
	}
}

func worker(ctx context.Context, jobs <-chan Job) {
	for job := range jobs {
		tick(ctx, job)
	}
}

func main() {
	jobs := make(chan Job, workerCount)
	go dispatcher(ctx, jobs)
	for range workerCount {
		go worker(ctx, jobs)
	}
}
The dispatcher only claims as many jobs as the channel has free slots. When the channel is full it claims nothing and another pod will pick up work that's needing done as this pod is saturated.
That bounds claimed-but-not-started work to one job per worker and gives us backpressure for free. If a job has waited in the channel long enough that its lease is more than half spent, the worker renews it before ticking. In practice ticks are fast enough that this almost never happens, so the normal path costs no extra writes.
Well, what have you got to show for it?
We ran some final ‘let's try to really break this' load tests in production after all of these (and more, for another post) changes.
The end result is that we were able to 3.5x escalation throughput across our system under peak load. Previously, due to lock contention, we were never able to properly hurt the database — acquisition of work slowed down to the point where we weren't able to make a meaningful dent in our primary's CPU. Now, acquire just keeps on going and going and going until we run out of headroom: this is actually good news as that's much easier to fix through conventional scaling techniques as opposed to fighting for nasty Postgres optimisations!
This work, completed with my colleague Jonathan Donaldson, is just a fraction of the scaling and optimisation work we've been doing on the Reliability team at incident. We consider scaling and reliability to be different sides of the operational rigour dice, and internally hold a bar where we only get permission to do rewrites or reach for infrastructure improvements if we've fully pulled on the reasonable-optimisation thread.
If you're interested in doing work like this, we're hiring at incident.io/careers.

Rory Malcolm
Product Engineer
See related articles

Almost excited to get paged
We added WhatsApp as an on-call notification method, since it's more reliable than SMS in some regions. As an intern six weeks in, I led the project from scoping through to the first message landing in production, and out to a full rollout for customers.

September 22, 2026
Interning at incident.io: rate limiting, resiliently
Our rate limiter depends on Valkey. If Valkey goes down we fail open and stop limiting which isn't good enough for our platform. As an intern, I built per-pod in-memory top-k buffers so we keep rate limiting even with the backing store gone.

September 2, 2026
We turned off Pub/Sub and nobody noticed
Our entire event-driven platform ran through a single message broker, which made it a single point of failure. So we added a second one. This is the story of building an event load balancer, the queuing theory behind it, and the final chaos test where we turned off Pub/Sub in production and nobody noticed.

+

August 11, 2026
So good, you’ll break things on purpose
Ready for modern incident management? Book a call with one of our experts today.
We’d love to talk to you about
- All-in-one incident management
- Our unmatched speed of deployment
- Why we’re loved by users and easily adopted
- How we work for the whole organization