Interning at incident.io: rate limiting, resiliently
September 2, 2026 — 12 min read
Hi there 👋 I'm Anthony.
I joined incident.io as an intern with the Reliability team. I was super excited to get stuck into working at a startup, somewhere that moves fast, where you get handed a lot of responsibility early on and make decisions that actually have an impact. And incident.io ticked every box.
By the end of the first week, I'd already shipped my first customer-facing change to production. A customer had asked for a way to permanently turn off cover-request notifications, and I built the dashboard toggle that did it. When I messaged them to say the change was live, they replied within the next minute! They thanked me and said that they’d already used it 🎉. It was a great early lesson - it taught me that the changes I make have an impact on the product and the users. Exciting.
In my second week, I was handed a trickier problem: rate-limiting redundancy.
Quick heads-up before we get into it: if there are words in here you don't understand (like me on my first day), I've added an appendix at the bottom covering all the concepts I've learnt.
The problem
Our team, Reliability, has a goal of maintaining and improving the uptime of the on-call product. One of the key systems protecting our platform is our rate-limiting backing store, Valkey. The great thing is that the managed Valkey offering we use, Google Cloud Memorystore, has a 99.99% SLA, which means it promises to be up 99.99% of the time. But 99.99% isn't good enough for us - our rate-limiting system is such a critical part of how we keep the platform up that Valkey being down for any amount of time just isn't acceptable. If Valkey went down, we would fail open, meaning we wouldn’t rate limit at all, which could lead to system overload. My job was to close that gap and make sure we could rate limit in some form even if Valkey disappeared.
I was given a cool and important problem and I was only two weeks in.
Learning whilst being supported
I started with a 1:1 with Jon, my onboarding buddy. He walked me through how our rate limiting worked, filled in the context I was missing on the project, and pointed me towards a few directions I could take. One thing I appreciated was that although the culture here is to move fast and solve problems, I was given the space and continuous support to take my time and properly understand everything and get the lay of the land. The whole team was supportive and patient. That cemented one of my first real lessons about incident.io: it's genuinely okay to take the time to understand things properly, and the culture here backs that up instead of making you feel behind for it.
Once I had gained enough understanding of the current package and how a potential solution would slot in, the next stage was writing a product scope and a technical scope.
These two documents are super important: the product scope outlines exactly how the changes I'm making affect the product and the customer, and the tech scope dives into how it will actually be built. Together they document, for a long time afterwards, why certain decisions were made and what the impact was.
My initial drafts were rough around the edges, but the approachability of the engineers around me made the iterative process smooth. After a few rounds, I discussed with Johanna, one of our engineers, who gave me some really good, personalised feedback on my documents. With her input, a few helpful resources she pointed me to, and feedback from the rest of the team, I was able to get my tech scope ready for kickoff.
This was another good lesson: the engineers here genuinely want to see you do well and contribute, and they're willing to invest real time in you if you ask. If you think about it, that time pays off both ways: you get more proficient, and the tips you pick up make you quicker on future projects. In this case, it made me a much better scope writer.
Making an important engineering decision
The core technical challenge for the project was finding an effective way to track the top-k busiest traffic gates, basically the named limits each request gets checked against, in each pod's local memory, and maintain an in-memory buffer for just those top-k gates so we could rate limit the hardest hitters when Valkey was down.
The top-k algorithm I’d researched and planned to use was the Space-saving algorithm, but at the project kickoff (which is a meeting where the team stress-tests our approach before work starts), a couple more alternative top-k algorithms came up, notably the HeavyKeeper algorithm. Patrick, one of our team leads, encouraged me to benchmark the two algorithms and come to an evidence-based solution instead of going off vibes.
I built a simulation and ran the numbers myself. The outcome was unexpected. Space-saving was fast and accurate on low-cardinality traffic, but struggled to correctly track the top-k used gates under high traffic and high cardinality. HeavyKeeper, on the other hand, held 100% precision in a shorter amount of time, under the exact same conditions. I presented my data to the team, and it was received well as my decision was backed by evidence. This was another lesson I picked up here: even as an intern, and relatively early on, I was trusted to make defensible decisions that actually mattered.
Actually building
Once I had my plan stress-tested and cemented my technical decision, the next stage was actually building the thing. I built in-memory buffers on each pod, tracking the top-k busiest gates locally. Valkey stayed the normal path; the difference was that if it went unreachable, a pod could now grant up to its own budget and then start denying, instead of failing open. And all the work I’d put in and the support of the engineers made the implementation the easiest part of the process.
Before deploying the code, it's always smart to test it extensively locally. I drove traffic at two gates side by side (one wired to the new local top-k feed, one still on the old Valkey-fed top-k), then killed a local 3-shard Valkey cluster mid-test to see how each handled the outage. With Valkey down, the new gate did exactly what it was supposed to: it granted 17 requests off its local buffer, then hit its budget and rejected the next 28 requests as rate limited. The old gate, with no local in-memory buffer to fall back on, just logged 20 requests granted using our previous fail-open policy with no rate limiting at all. Watching the system do the right thing in the failure mode I'd designed against, under conditions I'd deliberately created, was one of the most satisfying moments of the internship.
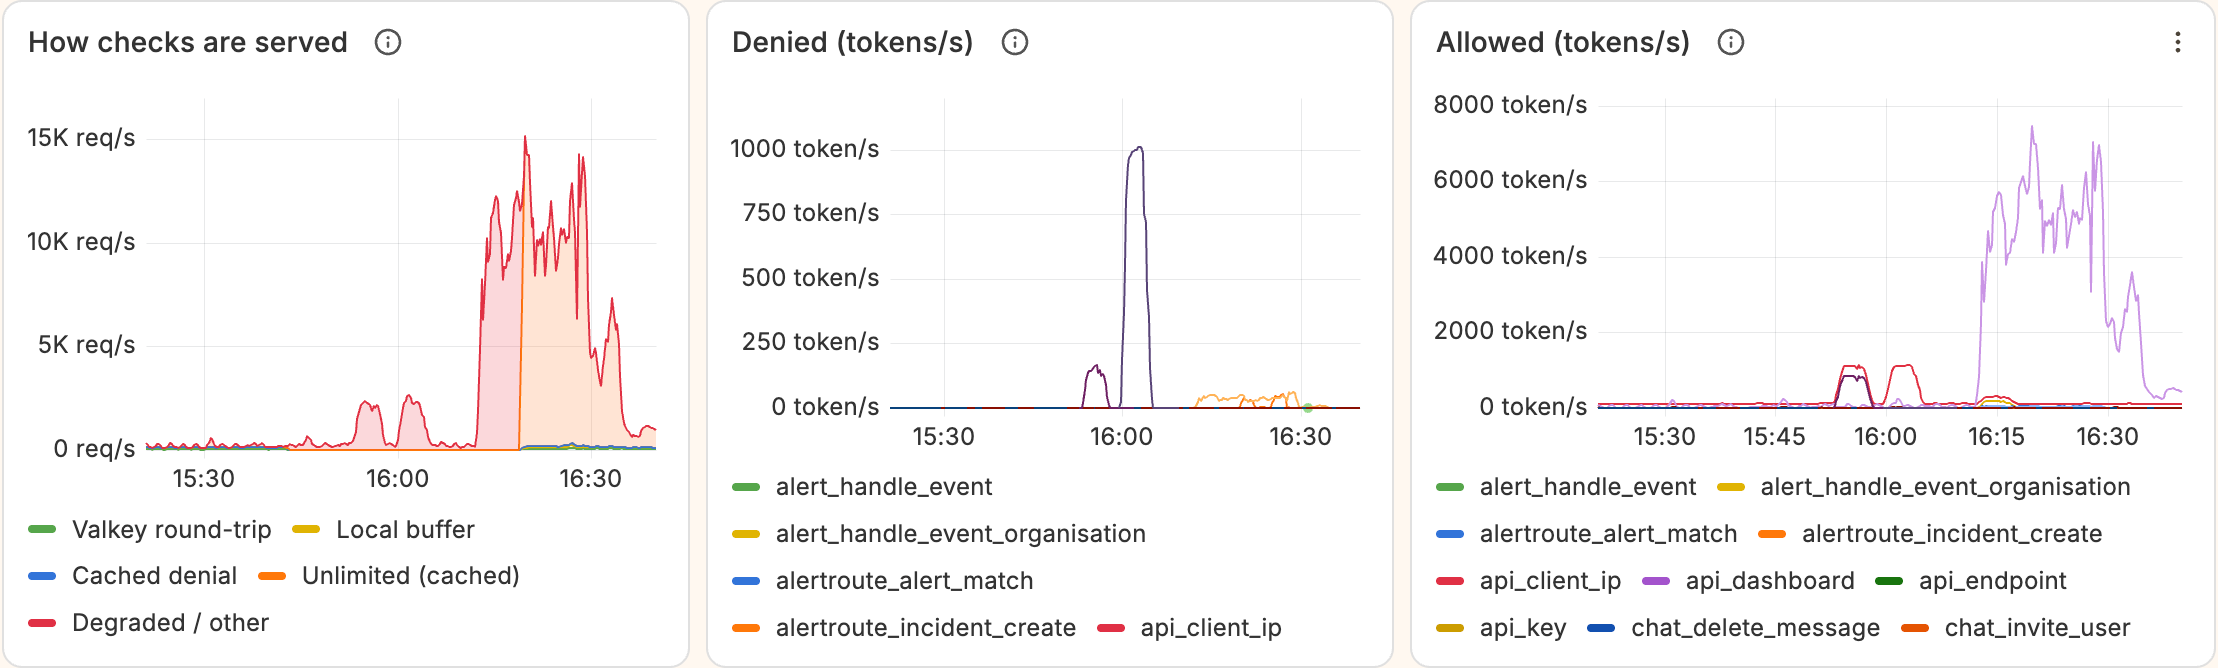
This graph shows that all checks were served by the local buffer in the degraded local rate limiter system. Requests were allowed while there was still budget available, but once the limit was hit, they started getting rejected 🎉🎉.
Now it was ready for prod 🚧. To make sure we didn’t ship a breaking change, we rolled out the new in-memory top-k gradually. We started with low-risk traffic gates to see how they behaved with real production traffic. Once it was clear there were no issues, we moved on to higher traffic gates, and finally the handful of high-traffic, high-cardinality gates that see the most traffic on our API. Before flipping the global default, Jon and I ran one more load test in staging: we took Valkey down again and hit the test gate with 1,000 requests a second across 20 rotating label sets (i.e., combinations of labels attached to requests), and watched it deny exactly as it should.
When Jon asked if we were ready to make the in-memory top-k the default everywhere, I told him I trusted and believed in the code enough for that. We did, and it held. We now had rate-limiting resiliency, and I had played a role in making our system more fault tolerant as an intern within my first month.
Improvements
A few weeks after rollout, I revisited an improvement we could make to the feature. Because every pod now enforced its limit independently, the effective limit across the whole system ended up being limit × pod count, rather than the limit we'd actually set. It was a known extension of the original work, and the team trusted me to take it on and drive the research and the fix myself. I brought a proposal to Patrick and Ben, one of our infrastructure engineers, and what followed was a great debate about the best way to close the gap: a Kubernetes headless service vs. a k8s informer vs. a gossip protocol, weighing DNS staleness against complexity. We landed on the k8s informer, which meant using the Kubernetes API to watch for changes to the Deployment resource and dividing the local limit by the live pod count, so the effective limit stayed exactly what we'd intended. And I shipped it! 🎉
Reflections
If I zoom out on the whole project, a few lessons come back to me. It's okay to take your time to understand something properly instead of rushing it. The engineers around you will invest real time in you if you just ask. And even as an intern, you can be trusted with decisions and ownership that actually matter. The pace I got to learn here - picking up distributed systems concepts, learning how to make sure decisions are properly thought through, and finding new ways of approaching problems - isn't something I think I'd have got anywhere else, certainly not this fast.
So if you're looking for a place where you're given real responsibility and trust, the chance to work on fun problems, and the support you need from a team that cares, incident.io is the place to be. We're hiring early careers, so apply!!
Appendix: every term I had to look up
In as plain English as I can manage, roughly in the order they show up above.
Valkey - a very fast in-memory data store (a fork of Redis) that lives outside our app.
SLA - a service level agreement: the uptime a provider contractually promises, and what they owe you if they miss it.
Traffic - the requests coming into our system, e.g. someone loading a page in the app or another service calling our API. "High traffic" just means lots of requests arriving.
Traffic gate - a named limit that requests get checked against. Each gate has its own cap, and every request hitting it is either allowed through (a "grant") or turned away (a "denial", i.e. rate limited).
Pod - one running copy of our app, with its own memory. We run lots of them side by side, so whatever a pod keeps in memory is its own and isn't shared with the others.
In-memory buffer - a small amount of state kept in a pod's own memory, so it can make a decision instantly without asking Valkey.
Cardinality - how many distinct things you're counting.
Top-k - the k most frequent items in a stream of things, where k is whatever number you pick.
Staging - a near-copy of production we can safely break, used for load tests before real customers are involved.
k8s informer - a Kubernetes feature that tells your code, in real time, things like how many copies of the app are currently running.

Anthony Oparaocha
Product Engineer Intern
See related articles
We gave cloud agents a phone to QA
Our cloud agents now test mobile pull requests on cloud simulators and leave screenshots and a recording behind. The agent collects the evidence and a person decides whether the change is right.

October 14, 2026
How savepoints quietly throttled our Postgres queue
We 3.5x'd our peak capacity in one of the most performance critical systems we have; here's how we did it, featuring a journey through some Postgres internals.

October 6, 2026
Building Investigations: what it takes to build an AI SRE
We spent the last two years building Investigations, our AI SRE. In this post, go behind the scenes of the work done and why build vs. buy is one of the most important decisions engineering teams are making right now.

October 1, 2026
So good, you’ll break things on purpose
Ready for modern incident management? Book a call with one of our experts today.
We’d love to talk to you about
- All-in-one incident management
- Our unmatched speed of deployment
- Why we’re loved by users and easily adopted
- How we work for the whole organization