Incident metrics pulse
How organizations are measuring their incident management
We surveyed world-class organizations about which metrics they track to measure the effectiveness of their incident response. In this report, we've analyzed the responses from companies like Ramp, Etsy, Skyscanner and others and share the insights their responses provided.
The process
What are teams looking at to better understand how well they’re doing at incident management?
This is a question we get asked all the time and one we empathize with deeply. While there are several well-established incident metrics that organizations commonly use, like MTTR and raw counts of incidents, a vast number of them are ineffective, or worse, entirely misleading.
The problem? These metrics tend to surface high-level insights that are difficult to action, and in some cases lead you to the wrong conclusion altogether. But it’s a tough situation to resolve, with few people offering viable alternatives that can be easily obtained or digested at different levels across the organization, and that provide high signal on the thing they’re modeling.
So we wondered how teams sorted through all of this noise to figure out what would deliver the most insight and impact. To get some answers, we put together a simple survey:
Here’s what we asked:
- What incident metrics do track within your team?
- What incident metrics do you report upwards?
- Do your incident metrics trigger you to take action?
- What metrics would you want if you had a magic wand?
Admittedly, some of the responses weren’t too surprising. But others got us thinking and challenged some of the assumptions we’d made. Here, we’ll share the findings that we collected from world-class organizations such as Etsy, SumUp, Ramp, and more.
With these insights in hand, we hope you can make some improvements to your existing metrics, or at the very least be confident you’re on the right track with what you’re already looking at! As with most things in the realm of incidents, context is paramount, so what works at one company won’t necessarily translate well at another.
How are teams measuring the effectiveness of their incident response?
To start, we asked what metrics people track within their teams. We wanted to uncover what individual teams really care about measuring and looking at, absent the pressures of management or other people across the organization Metrics have a tendency to become “politically charged” inside many organizations, often with leaders wanting them to convey a particular narrative. It’s understandable why this happens and what the consequences likely are.
So with this in mind, let’s dive into what teams care about tracking for their own benefit...
👑 Winners: MTTx
Time to detect, time to resolve, time to acknowledge, mean time between failures…
Of the responses we received, the overwhelming majority of them mentioned tracking MTTx at their organizations. This is a broad range of metrics that average out a handful of incident response data points. In other words, from start to finish, how long it takes you to complete a specific action. For example, MTTD measures how long a problem exists before the appropriate parties are alerted to it. MTTA measures the time between an issue being detected and someone starting to work towards resolving it. In our survey, half of all respondents specifically cited MTTR, or some variation of resolve, resolution and restore.
In many ways, this is not wholly surprising. These metrics tend to be the most straightforward to track and aren’t resource intensive to gather. And if we’re being honest, looking at how long it takes you, on average, to resolve an incident just makes sense. Organization want their response to be as fast as possible and will understandably look towards data points that give them the best measure of this, with the lowest friction. If you’re trying to understand whether or not you’re doing something as efficiently as possible, honing in on how long it takes you to do so feels right. It’s simple: a high, or upwards trending average suggests that you need to improve things while a low or decreasing average means that things are working out well.
But this measure hides a lot of nuance that’s impossible to distill if you just look at the raw numbers. Simply put, there’s too many uncontrollable variables in how long it takes you to respond to incidents to make MTTR a useful metric.
Takeaway
Based on the responses, it appears that Mean Time to… is still the workhorse for organizations when comes to incident metrics—but MTTR in particular stands out.

A cautionary tale on MTTR
The survey responses show that businesses still heavily rely on MTTR to provide incident insights. And while this may work out just fine for some organizations, the problem is these metrics tend to skew very easily, leaving you with insights that aren’t representative of the actual state of things. We’ll use a hypothetical situation to illustrate the point.
Let’s imagine, in January, you had seven incidents, and across those incidents it took you an average of 20 minutes to resolve them. You decide you’d like to improve your MTTR of 20 minutes and reduce it down to 15–an objectively well intentioned and sensible goal, since your customers haven’t been enjoying the downtime.
Now in February, your follow-up actions from the incidents in January, along with investments in reliability and knowledge sharing mean you have a much better month. You have one small incident that’s swiftly resolved within three minutes, and in the final week of the month you have a particularly gnarly one. The person on-call takes longer than anticipated to fix the issue as a runbook is out of date, and it takes them 45 minutes to get things restored.
Your February MTTR ends up being 25 minutes. You’ve gotten five minutes worse.
Did things get worse? MTTR would suggest so, but you’ve had fewer incidents in February, less aggregate downtime, and when it comes to the numbers the average was largely inflated due to an unpredictable and unique set of circumstances. You could argue February was a much better month than January.
To be clear, we’re not suggesting you shouldn’t use MTTR. Like all metrics, they are a model of a complex world, so you should be aware that they are fallible. MTTR going up might mean things are getting worse, or it might happen when things are actually getting better. If you’re using it, it’s worth being aware of this fact, and ensuring it’s the starting point for a deeper investigation.
⛈️ After the storm: Post-incident metrics
Responders are also looking past metrics that measure their incident response, and are tracking what happens after the incident as well. Several mentioned post-mortem and follow-up action completion times as primary measures they cared about.
But why are teams looking at these numbers in the first place? It ultimately boils down to two things: learning from incidents and reducing the likelihood of repeat incidents. When we dug a little deeper, we found post-mortem completion rates are being used as a numerical proxy for how much teams are learning from incidents. A higher number of post-mortem documents means more learning and vice versa.
Done well, post-mortem documents can unearth several areas of improvement teams otherwise may not have found. Issues like inadequate training, system vulnerabilities, misconfigurations, and process improvements can be discovered through a post-mortem.
It’s important to acknowledge this kind of metric masks some complexity. Writing a document doesn’t mean you’re learning and learning doesn’t necessitate a document being written so, like all metrics, it requires cultural alignment and a degree of quality control.
When it comes to follow-up actions, respondents are most commonly tracking completion time and/or overall % of actions completed.
By making note of what these items are and whether or not they’re being completed, teams can nip any process gaps in the bud before they result in repeated incidents that could’ve been avoided entirely.
While there’s understandably a focus on how well teams are responding to live incidents, the insights you gather around what happens after the incident can be just as valuable.
Takeaway
Organizations are starting to approach incident metrics from a more wholistic point of view and not just focusing on response datapoints.

📱 Hold the pager: On-call metrics
A few responders mentioned tracking their team’s on-call metrics also, specifically alert fatigue. Given how important on-call is for organizations of all sizes, tracking whether or not certain teams and individuals are getting the brunt of the work is sensible.
Alert fatigue is a phenomenon that first made its rounds among medical professionals. It occurred when folks on-call got paged repeatedly during the course of a shift. This ended up in them growing desensitized to the alerts and, eventually, processing them as noise. Down the line this led to missed, ignored, or delayed responses to pager alerts.
Alert fatigue is a very real issue and sweeping it under the rug only delays the inevitable outcome of burnout. But think about the proactive measures you can take when you know exactly who’s getting on-call alerts, when they’re getting them, and whether or not they’re in need of some reprieve.
- You can better understand which teams are getting notified the most
- You can encourage overrides so responders don’t get burned out
- You can reconsider what types of incidents require pager alerts in the first place so responders can focus on the most impactful work
Ultimately, by staying on top of this metric, teams can set their team up for success and demonstrate that employee well-being is top of mind.
Takeaway
There’s a correlation between the growing complexity of an organization and how much they ask of their on-call teams. With more teams tracking this load, it suggests that balancing the needs of the business with employee well-being is a priority.

The disconnect between teams and upper management on what’s the best measure of effectiveness
Interestingly enough, in many instances the metrics that responders track on their teams and what they report upwards aren’t one in the same. Here’s how it generally broke down:
- 13% of responders indicated that they track and report the same metrics at the team and upper management levels
- 3% of responders don’t report any incident metrics upward despite tracking them at the team level
- 81% of responders indicated what they track and report are largely the same, but they’ll report up a few more metrics. For example, one responder mentioned that they track MTTD at the team level, but report up MTTD and MTTR.
One metric that came up repeatedly? Total number of incidents.
From the feedback, it's clear that upper management tends to prioritize quantitative metrics, like minutes of downtime, incident counts, and other time-related measures. There’s less focus on depth and more focus on simple-to-understand numbers.
On the other hand, team members on the ground often lean towards qualitative metrics, focusing on patterns, the business impact of incidents, and the underlying factors contributing to them.
As a whole, this suggests that there’s a disconnect between what teams think is the best reflection of their efficiency and what upper management thinks is most useful to make business decisions.
In general, this does at least suggest that there’s still a bit of contention around what incident metrics provide the most impact and best represent the “state of the world” when it comes to incident management.
Takeaway
When it comes to the usefulness of certain incident metrics over others, teams are at odds with leadership and there’s a slight misalignment between team-level objectives and business-level objectives.

Are organizations doing anything with the insights they gather?
Surprisingly, this question prompted the most diverse set of responses. Yes, most teams use their incident metrics to take direct action. For one responder,
...these are triggers for my team to engage to get certain areas back on track.
But nearly half of all responders mentioned that the metrics they track don’t trigger any actions whatsoever. This poses the question: if teams are making the time to track metrics at the team level and report them up, why aren’t they prompting any corrective actions?
One theory for this might be time constraints. Teams are already spread thin, and the thought of adding corrective actions to an already packed backlog can seem daunting.
Another, perhaps more plausible theory? The metrics teams are tracking and reporting don't actually serve their needs. There's some support for this idea: several respondents admitted they monitor metrics like incident count and MTTR/MTTD but then do nothing with this information.
Although our survey didn't directly address this, follow-up discussions revealed that most people find more value and learn more effectively from examining “interesting” incidents in depth, rather than relying on superficial numerical data.
In an ideal scenario, the insights you gather from metrics should be valuable enough to course correct anything that’s lagging behind. But if you aren’t doing anything with these data points, is it time to consider a different approach?
Takeaway
With several teams spending time collecting metrics but not doing anything with them, it begs the question: are these metrics useful to organizations in the first place?

What metrics are on organizations’ wish lists?
While this question understandably generated many context-based responses, one theme came up throughout a few responses: cost. And given the discussions around tightening balance sheets for companies across the board, this feels par for the course.
The reality is that every incident can represent a dollar lost for organizations. But oftentimes it can be difficult to assign an exact amount to incidents. And when you dig deeper, it’s easy to understand why.
X amount of downtime doesn’t necessarily equate to X loss.
Some benchmarks you’ll come across are a $427 per-minute cost of downtime for small businesses and $9000 for medium and large. But the problem with this is that it removes so much nuance. The industry you’re in, your business model, revenue streams. All of these and more make calculating your downtime costs based on averages very challenging.
If you’re an e-commerce website and your website goes down for ten minutes, will the customers who visited your site during that period never come back? Unlikely. So what is the best representation of loss during this period? Hard to say.
Other organizations use the following to get a benchmark for their downtime costs:
Outage cost = potential revenue + lost productivity costs + recovery costs
But again, there’s so much variability here that makes relying on these calculations a bit of a gamble.
To make matters more complicated, cost cannot be reduced down to revenue lost. There’s productivity loss. Lost trust. Regulatory scrutiny. The list goes on. So as teams mature and the stakes get higher, being able to assign a wholistic value to incidents is becoming more and more critical, particularly for leadership.
Takeaway
As companies revisit the efficiency of their spend, the desire for more cost-quantifying incident metrics is top of mind for organizations of all sizes.

Our recommendations
The results are in—now what? Many of the results of this survey affirmed what we assumed: organizations track a diverse set of metrics to understand the efficiency of their incident response.
And while there are some common themes such as MTTR, what metrics organizations track is highly context-based. For this conversation, however, it’s worth taking a step back.
It’s undebatable that keeping up-to-date with incidents can give valuable insight into organizational health. And since incidents are often handled by people closest to the day-to-day, for anyone further from the action, incident data can be one of the most direct and honest signals you can get for how things are going and can facilitate better business decisions.
If you’re finding yourself looking for better signals, or just trying to up-level what you look at to track incident response efficiency, here’s a few ways we think you can do that. Crucially, we think it’s important to combine multiple metrics to get an accurate picture, instead of relying on singular data points.
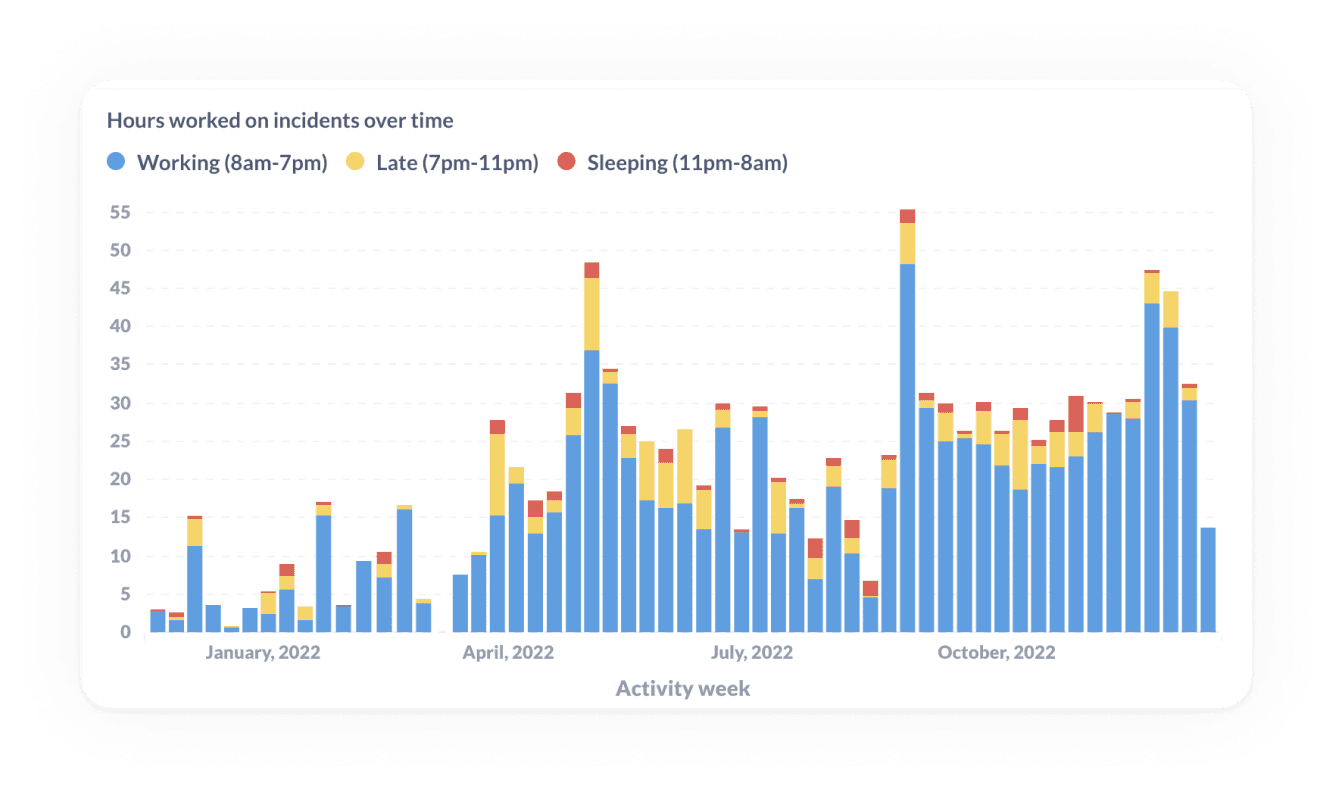
⏲️ Track workload to measure time spent working on incidents
First, let’s look at an alternative way to measure incident impact: workload. It’s fair to say that measuring incident impact can be highly nuanced and can leave you running around trying to answer loads of questions
- What are the worst kind of incidents?
- One that impacts the most customers?
- Had the most monetary impact?
- Was most severe?
But sometimes the simplest question is the best one. In this case it’s how much time people actually spent trying to resolve the incident. Time spent responding to incidents is time not building product or serving customers. It represents a typically overlooked cost of supporting the service you already provide, and can be spread across many people even in a single incident.
If you could directly quantify the amount of time spent on incidents, think of how many questions that might help you answer.
By breaking down incidents into data points such as, “How many people responded to this incident?” How much time did each of them spend on it?” you can much better represent how bad an incident was.
📟 Track pager load to look for any imbalances in on-call responsibilities
We’ve written extensively about on-call and the burden it represents for teams.
Because of this reality, it’s important to be proactive about minimizing the disruption that being on-call creates. But outside of asking how folks are feeling, it can be hard to know when on-call has become painful.
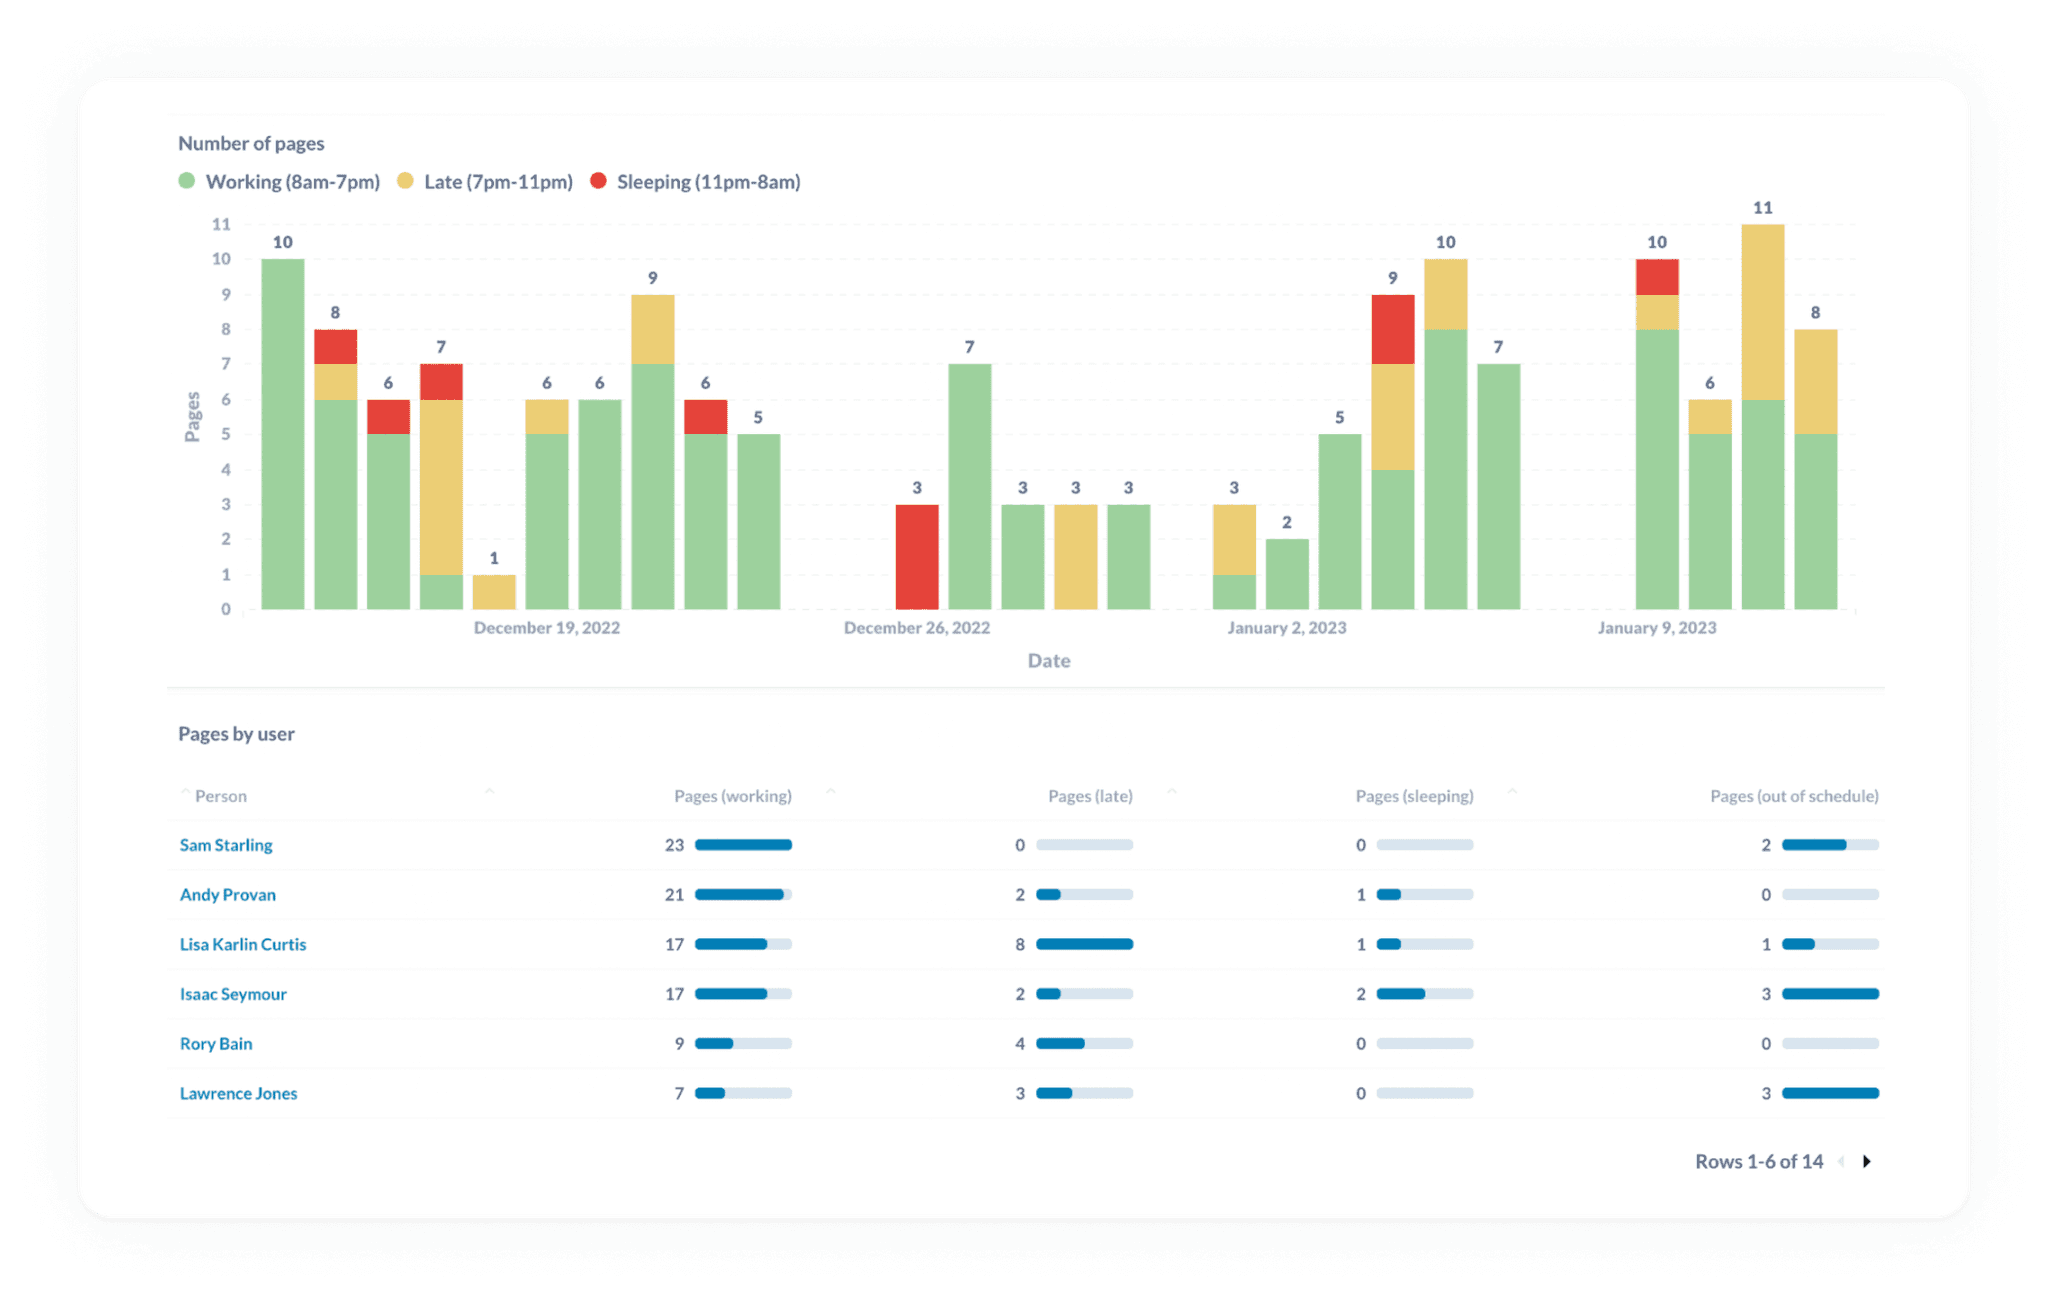
By tracking frequency of pages and contextualizing those pages for the type of disruption they caused the person, you can address an increasing operational burden before it makes a turn for the worse.
💪 Track operational readiness to benchmark your preparedness
Are you ready for your next incident?
All organizations deal with incidents day in and day out. But because things change frequently—such as tenured employees leaving and branching out into new product spaces—your incident preparedness is likely to change, too.
And the last thing you want is to be stuck in the middle of a bad incident, looking around and saying, “we weren’t ready for this” or “I don’t know how to do that.” The best proxy to measure how ready you are to tackle your next incident? How many of your team have responded to different types of incident over time.
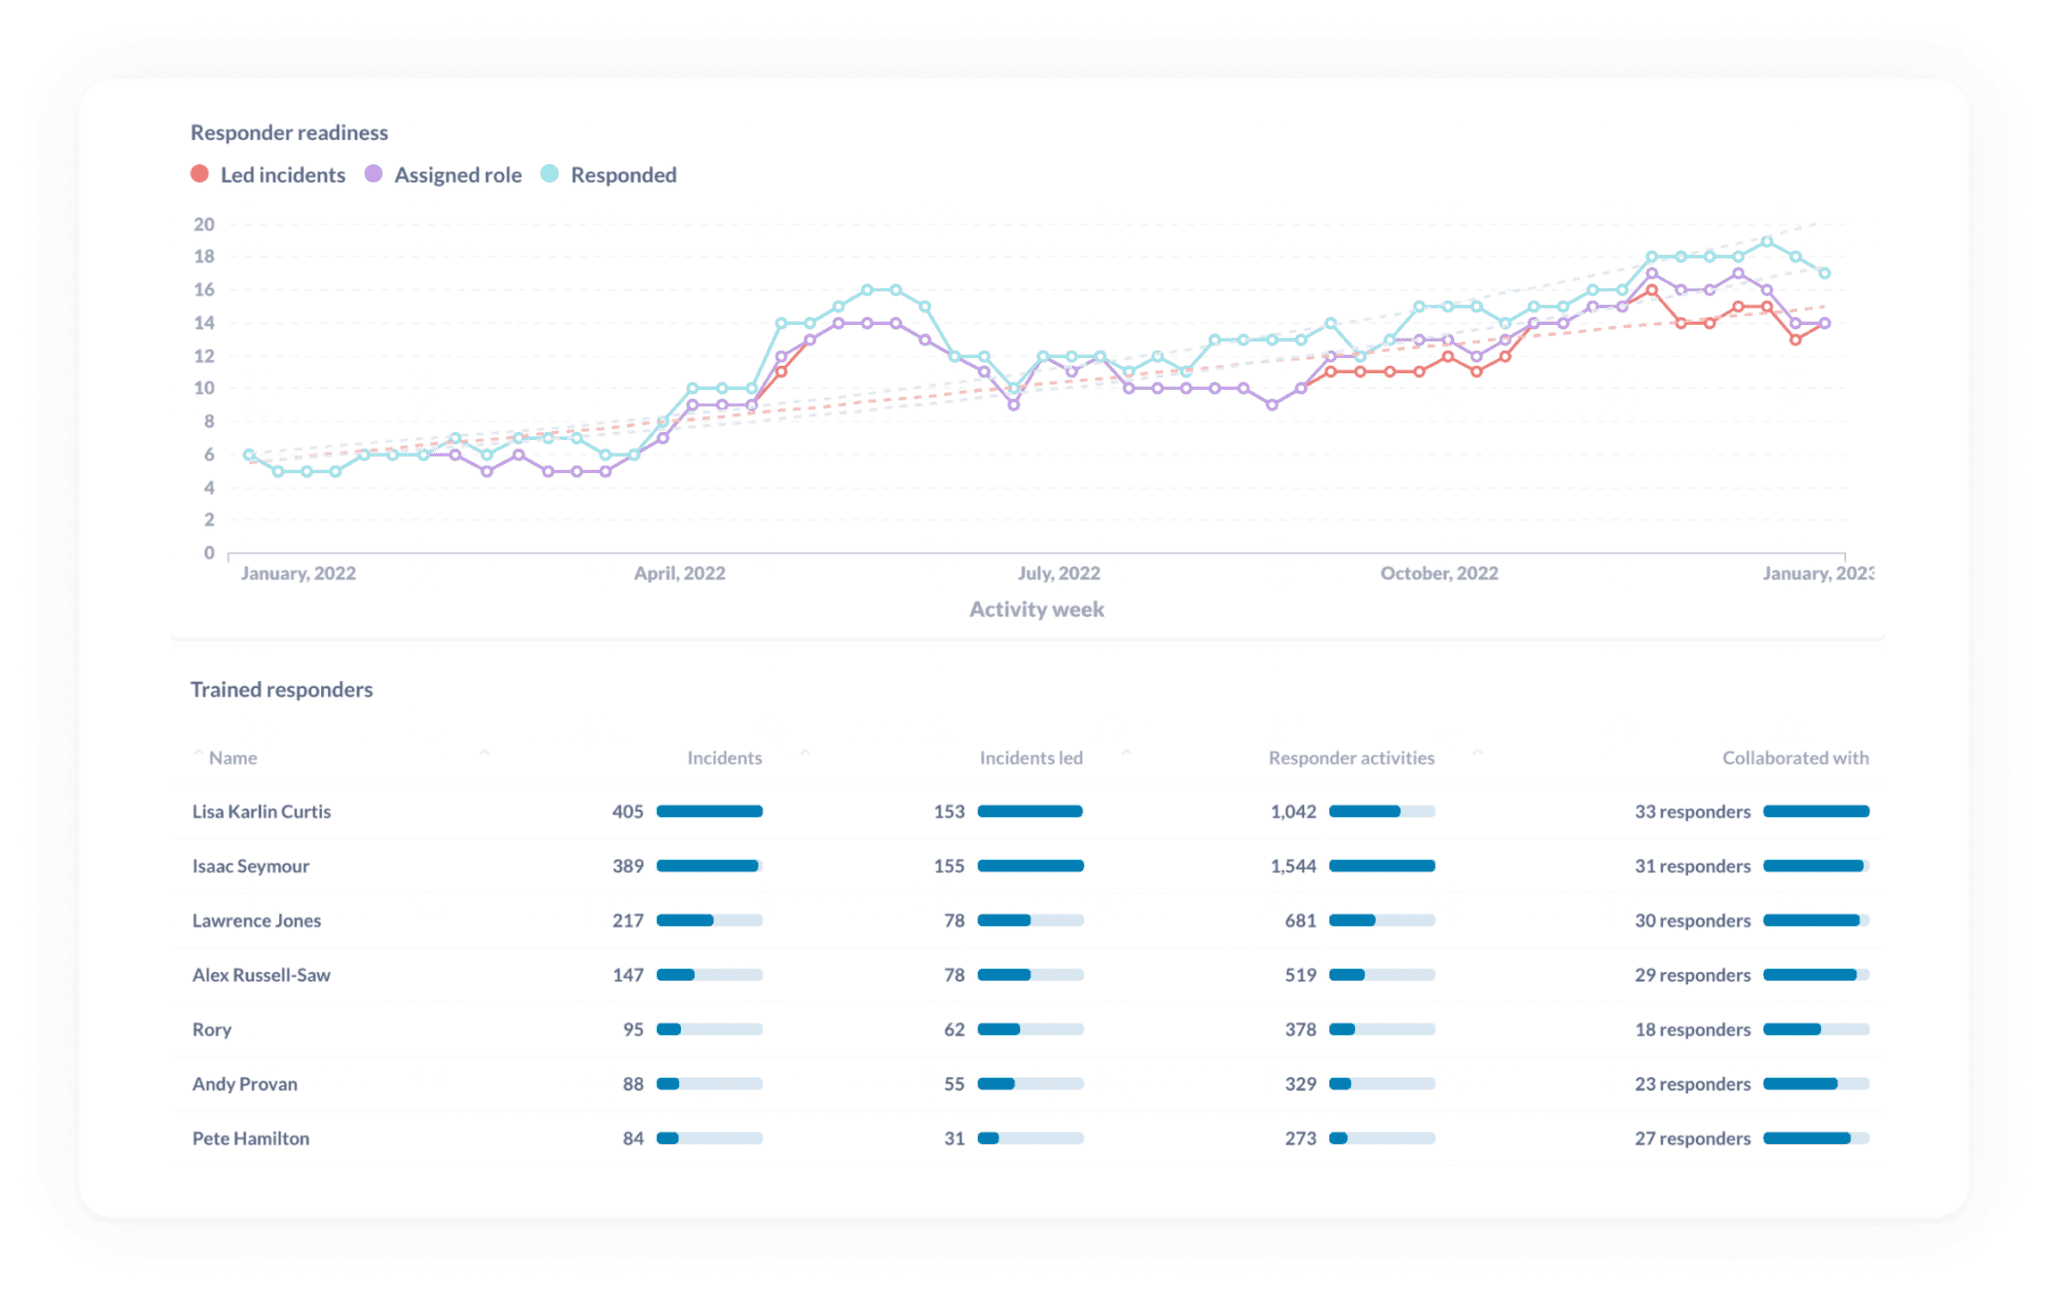
In the chart above, you can see how many responders:
- Have led incidents
- Have been assigned specific roles in those incidents
- Have responded to incidents
This can help point out any gaps in experience. Say you’ve had a new joiner who, over the course of six months, has led very few incidents relative to other new joiners over the same time period. This can suggest to you that this person may be in need of some time in incidents where they have the opportunity to lead. Perhaps adding a shadow rotation could help?
At incident.io, we run Game Days to give everyone an opportunity to go through the motions of a typical incident, while playing different roles. We'll always make sure that anyone without recent experience of major incidents participates in these drills, which increases the number of people trained to respond when the next incident happens.
Metrics are just a starting point for improving
To reiterate: metrics that work at one organization won’t necessarily make sense at another. So if tracking MTTA, follow-up completion, and pager load makes the most sense in your context, keep doing so!
But regardless of what you end up tracking, remember that metrics are a starting point for any investigation. Numbers cannot convey, with 100% certainty, so many factors around responding to incidents.
How do folks feel? Did we do everything we possibly could have to prepare for this? How likely is this to happen again?
And the reality is that certain metrics, like MTTR or incident count, just don’t do enough to paint a picture beyond the raw numbers. They leave out too much context and nuance and can leave you with a narrow worldview. Ultimately, metrics like these can be more harmful than good down the line.
And yet, tracking metrics for the sake of doing so isn’t going to move the needle either. Whether you’re tracking workload, or pager load, operational readiness or something else, it’s just as important to actually implement any learnings you gather.
Ultimately, the metrics you track should enable you to make changes and improvements that deliver the most value.
When you operate with this framework everyone wins: you, your team, your business and the folks who make it all possible, your customers.
So good, you’ll break things on purpose
Ready for modern incident management? Book a call with one of our experts today.
We’d love to talk to you about
- All-in-one incident management
- Our unmatched speed of deployment
- Why we’re loved by users and easily adopted
- How we work for the whole organization


