Investigating in the open
It’s tempting when debugging an incident to prioritise speed above everything else. That often comes at the cost of collaboration: all the context is in one person’s head.
Don’t keep it to yourself
However good a responder you are, there’ll be things that other people know that you don’t.
By keeping the context to yourself, you’re sacrificing the opportunity to use the skills of the wider team. You might not initially think that’s relevant: it’s only a minor incident after all. But you never know what might happen: maybe you have a personal emergency and need to hand it over. Or perhaps the incident turns out to be bigger than you’d first thought.
Write what you’re doing as you go, so you can collaborate later if needed.
This is particularly important in long-running incidents. Incidents are exhausting, and once the initial adrenaline rush has subsided it’s common to find yourself crashing. If you’ve left a good trail, it’ll be easy to hand over and take a break, so the incident can keep moving.
Don’t rely on your memory
Whenever you perform a test, run a command or verify a statement, share all the data you have into a log that everyone responding to an incident can see.
Being able to go back into your incident Slack channel and see which commands you ran can be the difference between understanding an issue and an unsolvable problem.
It helps to avoid bad assumptions, and means you won’t be left with “what ifs?” about the actions you took.
Optimise for knowledge sharing
Tacit knowledge – which is stuff people just know – runs rife when you’re building at speed, and incidents can help keep your team on the same page.
Debugging trails are a fantastic source of information on both the particular problem being investigated, and the processes and tools folks are using to debug things. I’ve learnt a heap of tricks with our observability setup by seeing what others are posting.
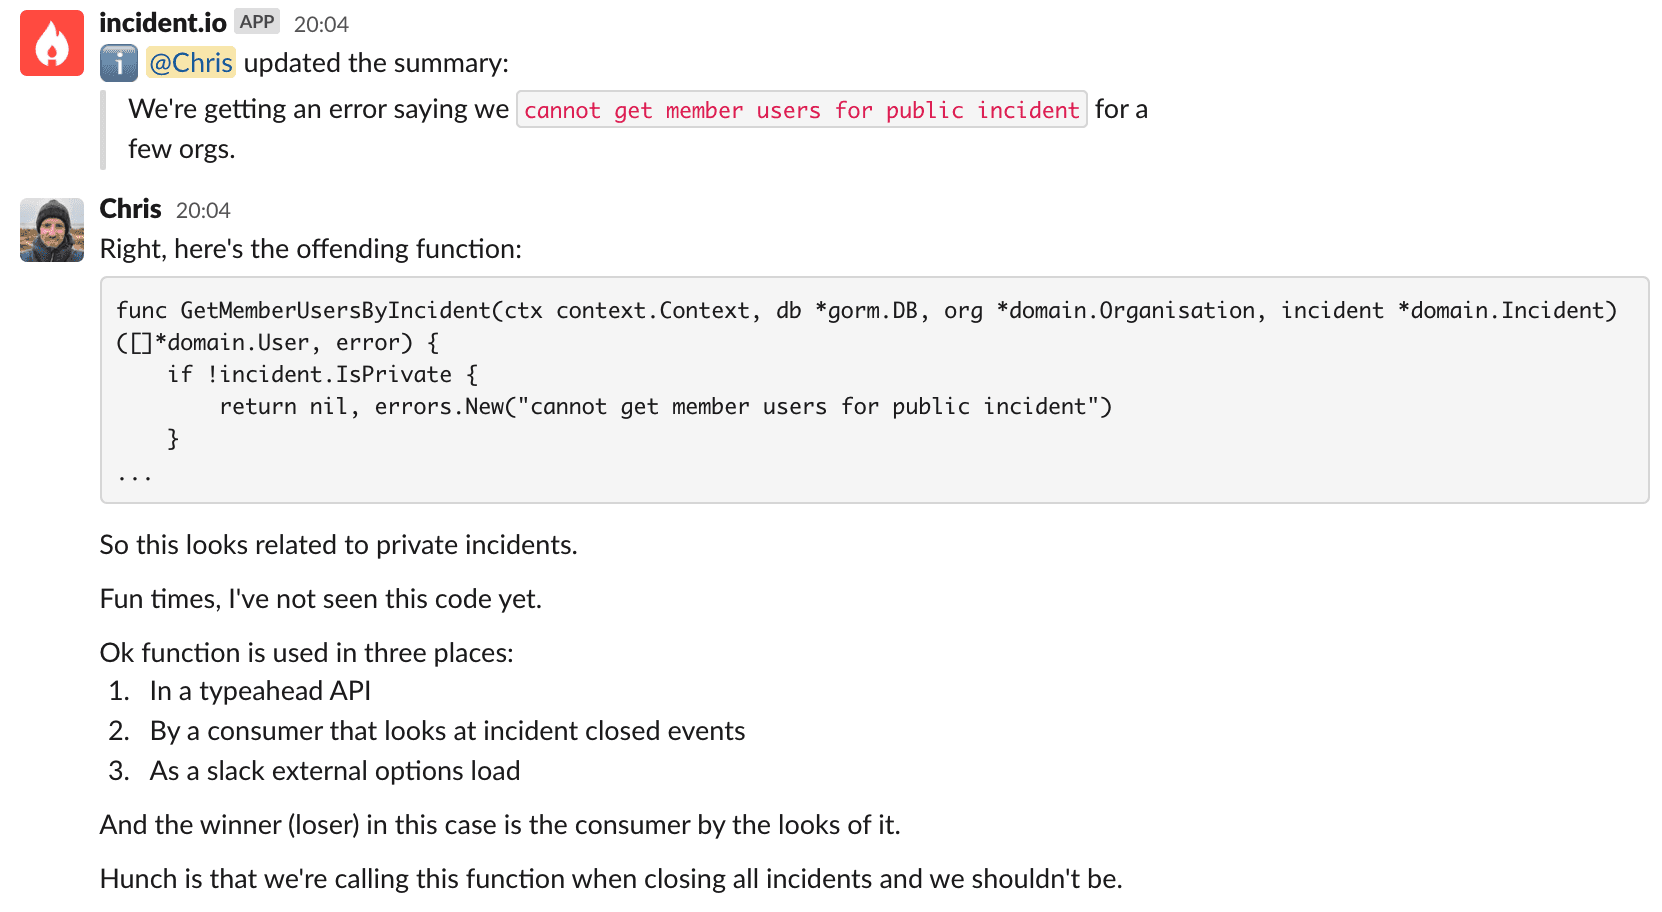
Practically speaking, we advise posting logs, error messages, screenshots of graphs and traces, and exactly what you’re thinking into the channel. If someone joins to help out, they can see exactly where you’ve been and mobilise quickly.

These are also great for new members of your team to upskill on your product and how to debug complex problems (see Learning from your peers)
Showing your working
So you’ve made it this far and you’re convinced this the right thing to do. But what does showing your working mean in practice? If you’re familiar with rubber duck debugging, it’s basically that! If you’re not, the goal of showing your working is to articulate and share your thinking as you go. By clearly articulating the problem and what you’re doing, you’ll actually help yourself solve the problem.
Practically speaking, here’s some useful prompts for sharing:
- Just joined the incident? It’s common to need a few minutes to orient yourself. Avoid the tumbleweed, and let folks know that’s what you’re doing.
- Once you’ve gathered all of the context, share it! Things like the alerts that have fired, the error you’ve seen, or the details of the complaint from a customer.
- If you have a hunch or hypothesis, write it down! “I think I’ve seen something like this when I was working on X. I’m going to take a look at Y to see if I can confirm”.
- If you find anything interesting, whether that’s some specific log lines, an interesting graph, or a particular piece of code, add them.
- When it comes to taking actions, explain what you’re going to do and why. Include things like commands you’ll run or buttons you’re going to press. This might give someone the opportunity to jump in and prevent a mistake, or at the very least it’ll leave a clear audit trail.
This might feel a little uncomfortable at first, especially when it’s 2am and you’re dealing with something alone, but trust us, it’s 100% worth it.