Tell the full story with your incident timeline
September 19, 2024

Post-mortems are incredibly useful, and great post-mortems require someone to build a clear narrative around the incident which can be used as the centerpiece to analyze what happened. But retroactively parsing through hundreds of Slack messages can become a real nightmare - that’s why our generated timeline pinpoints the key moments for you.
This has been one of our core offerings for a long time, but we’ve now overhauled the experience to make it easier for you to tell the full story about what happened during an incident.
Less noise
By default, we’ll now only include incident updates (e.g. severity and status changes) and pinned Slack messages on the timeline to start with. Reducing noise means that responders can easily digest the timeline, but it also makes it easier to start the curation process, because it becomes more obvious about which events are missing in the story.
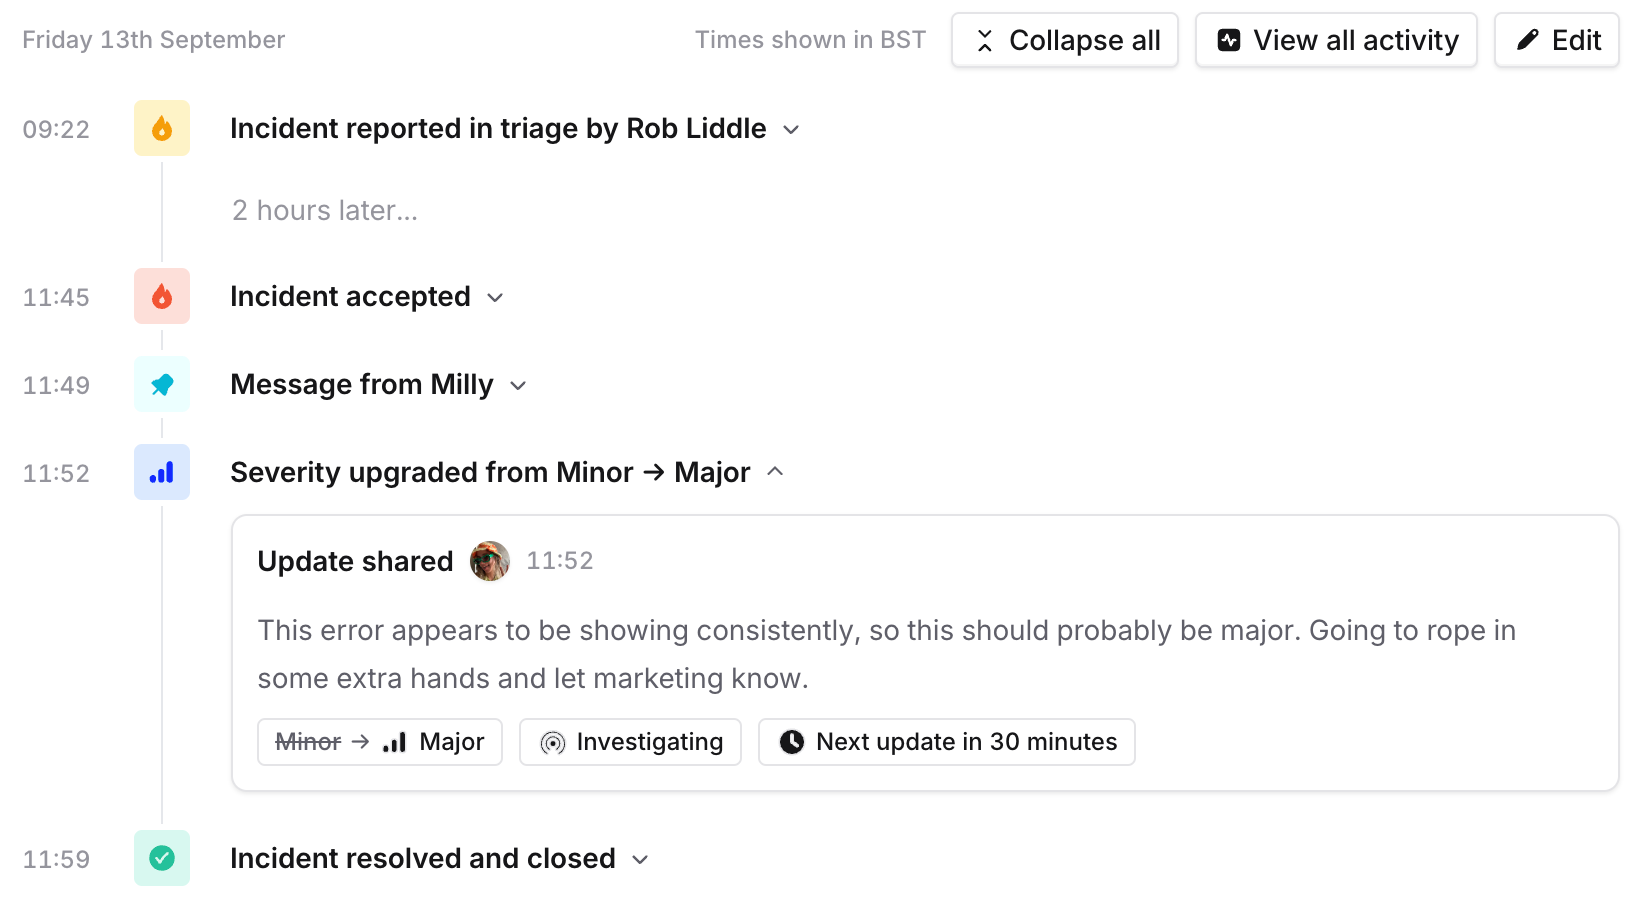
It’s easier to identify important events
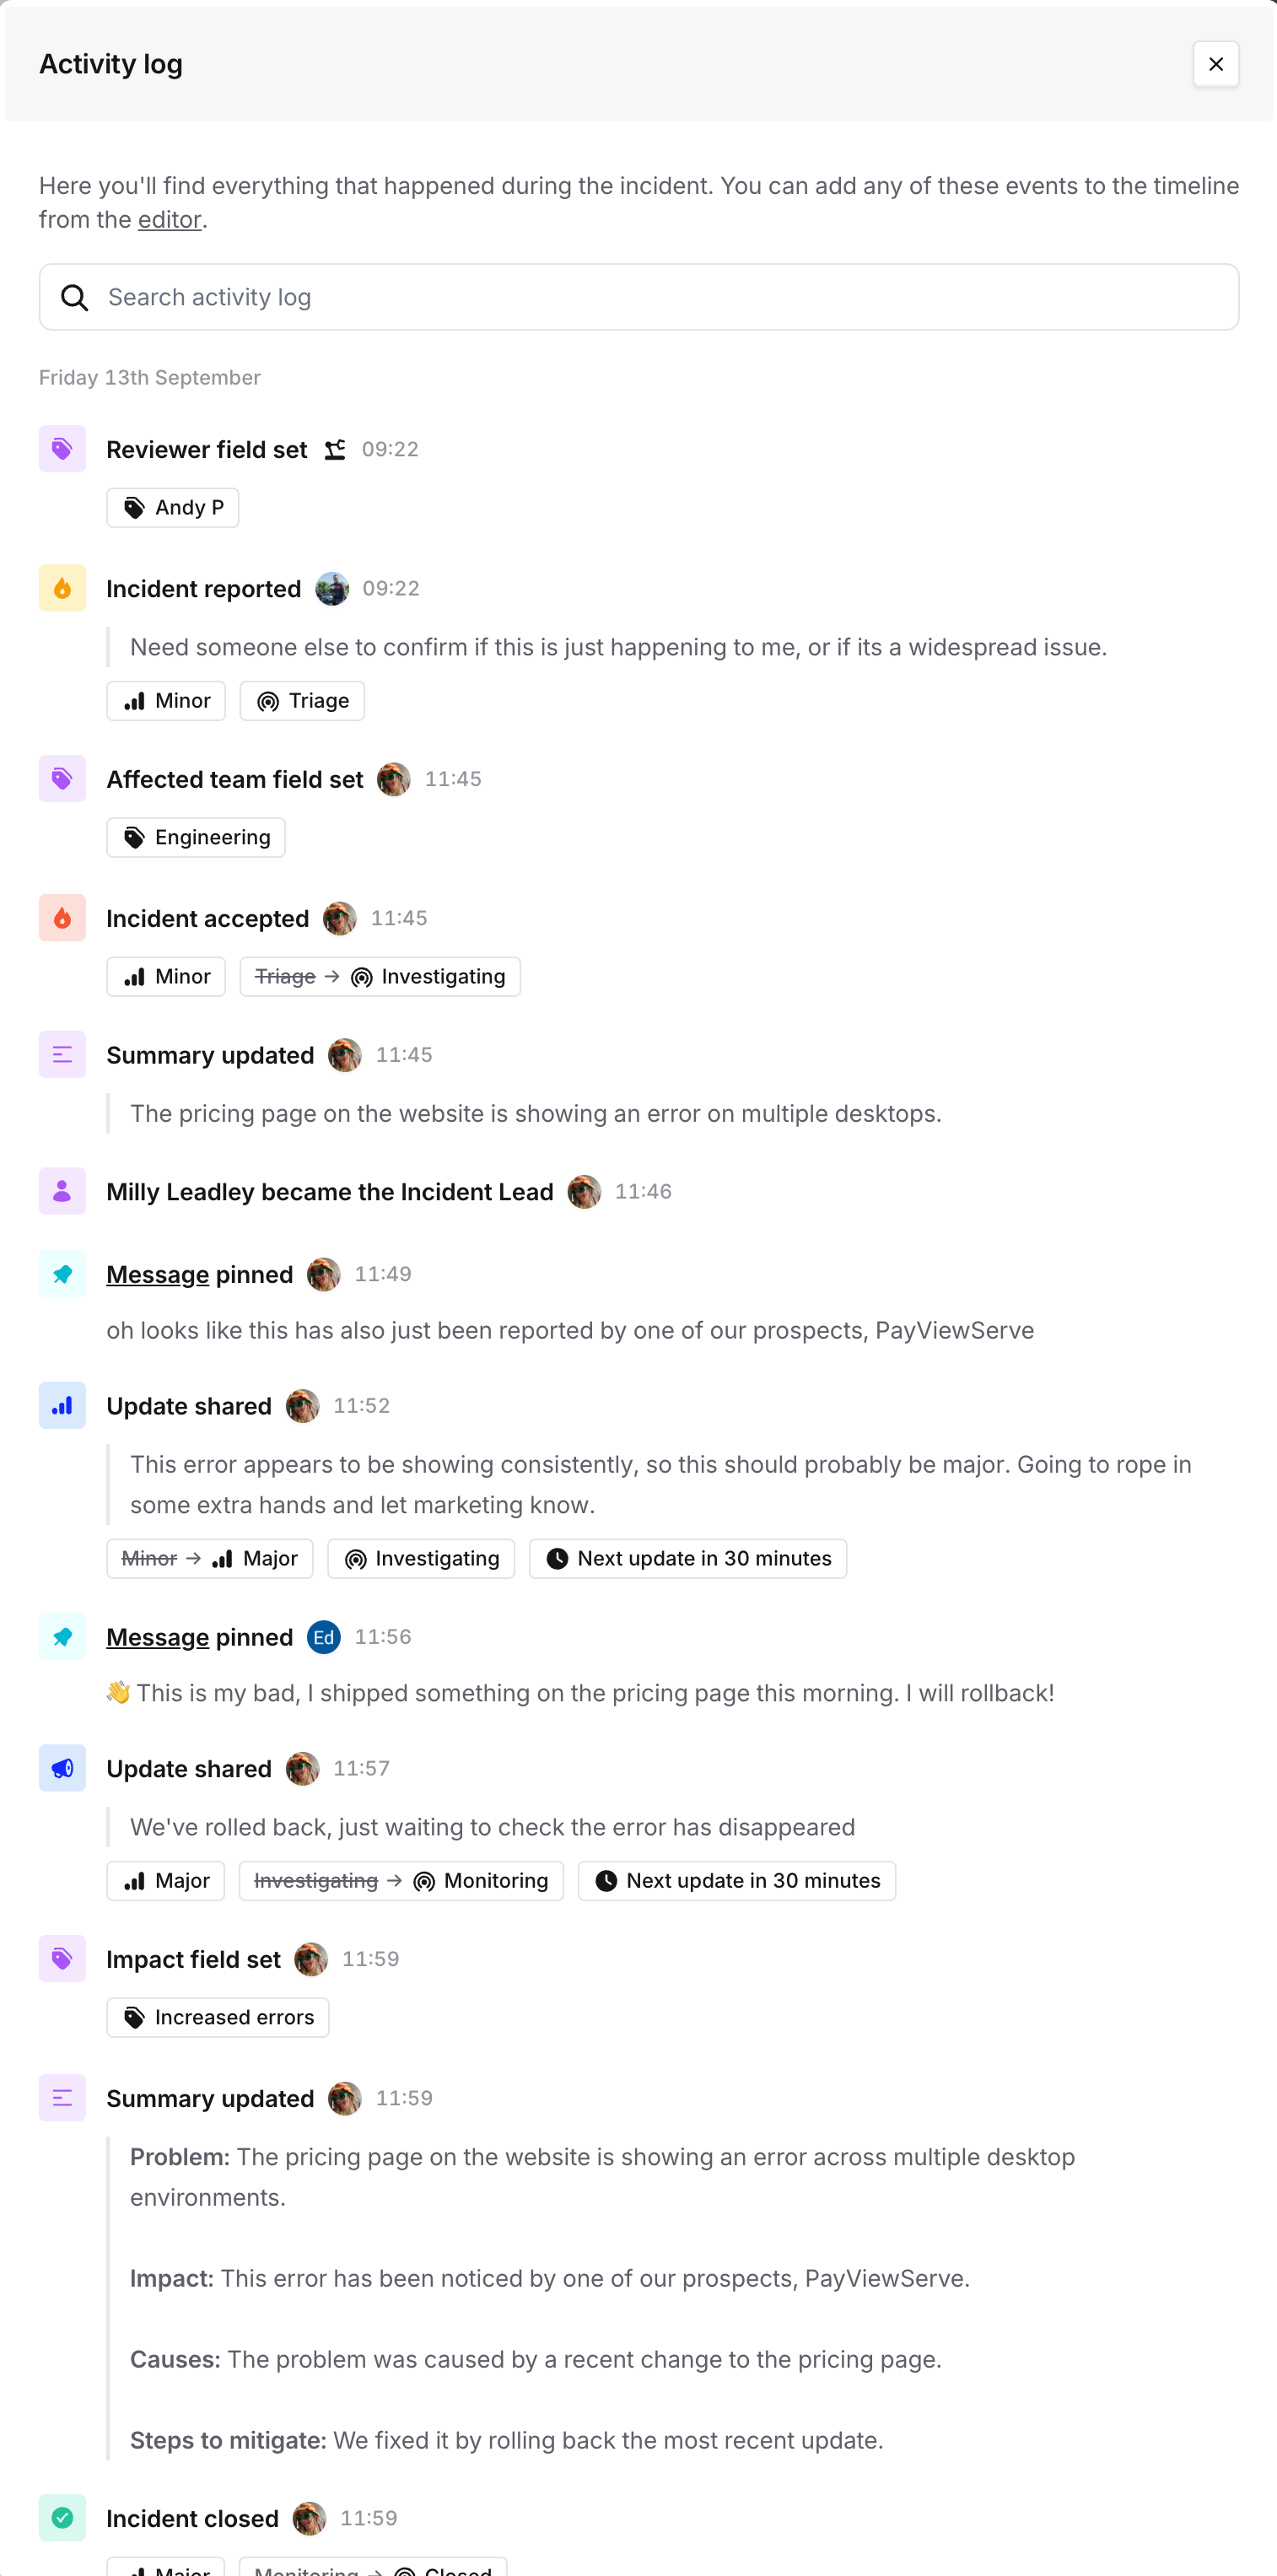
We’ve also introduced an editor, where you can view and search all the activity we tracked during the incident (e.g. role changes, actions, GitHub PR’s, etc). This makes it easier to identify an important moment without having to dig around in Slack to figure out what happened and when!
To proactively add one of these events to the timeline, just click the activity log in the left panel and it’ll appear in the timeline preview on the right.
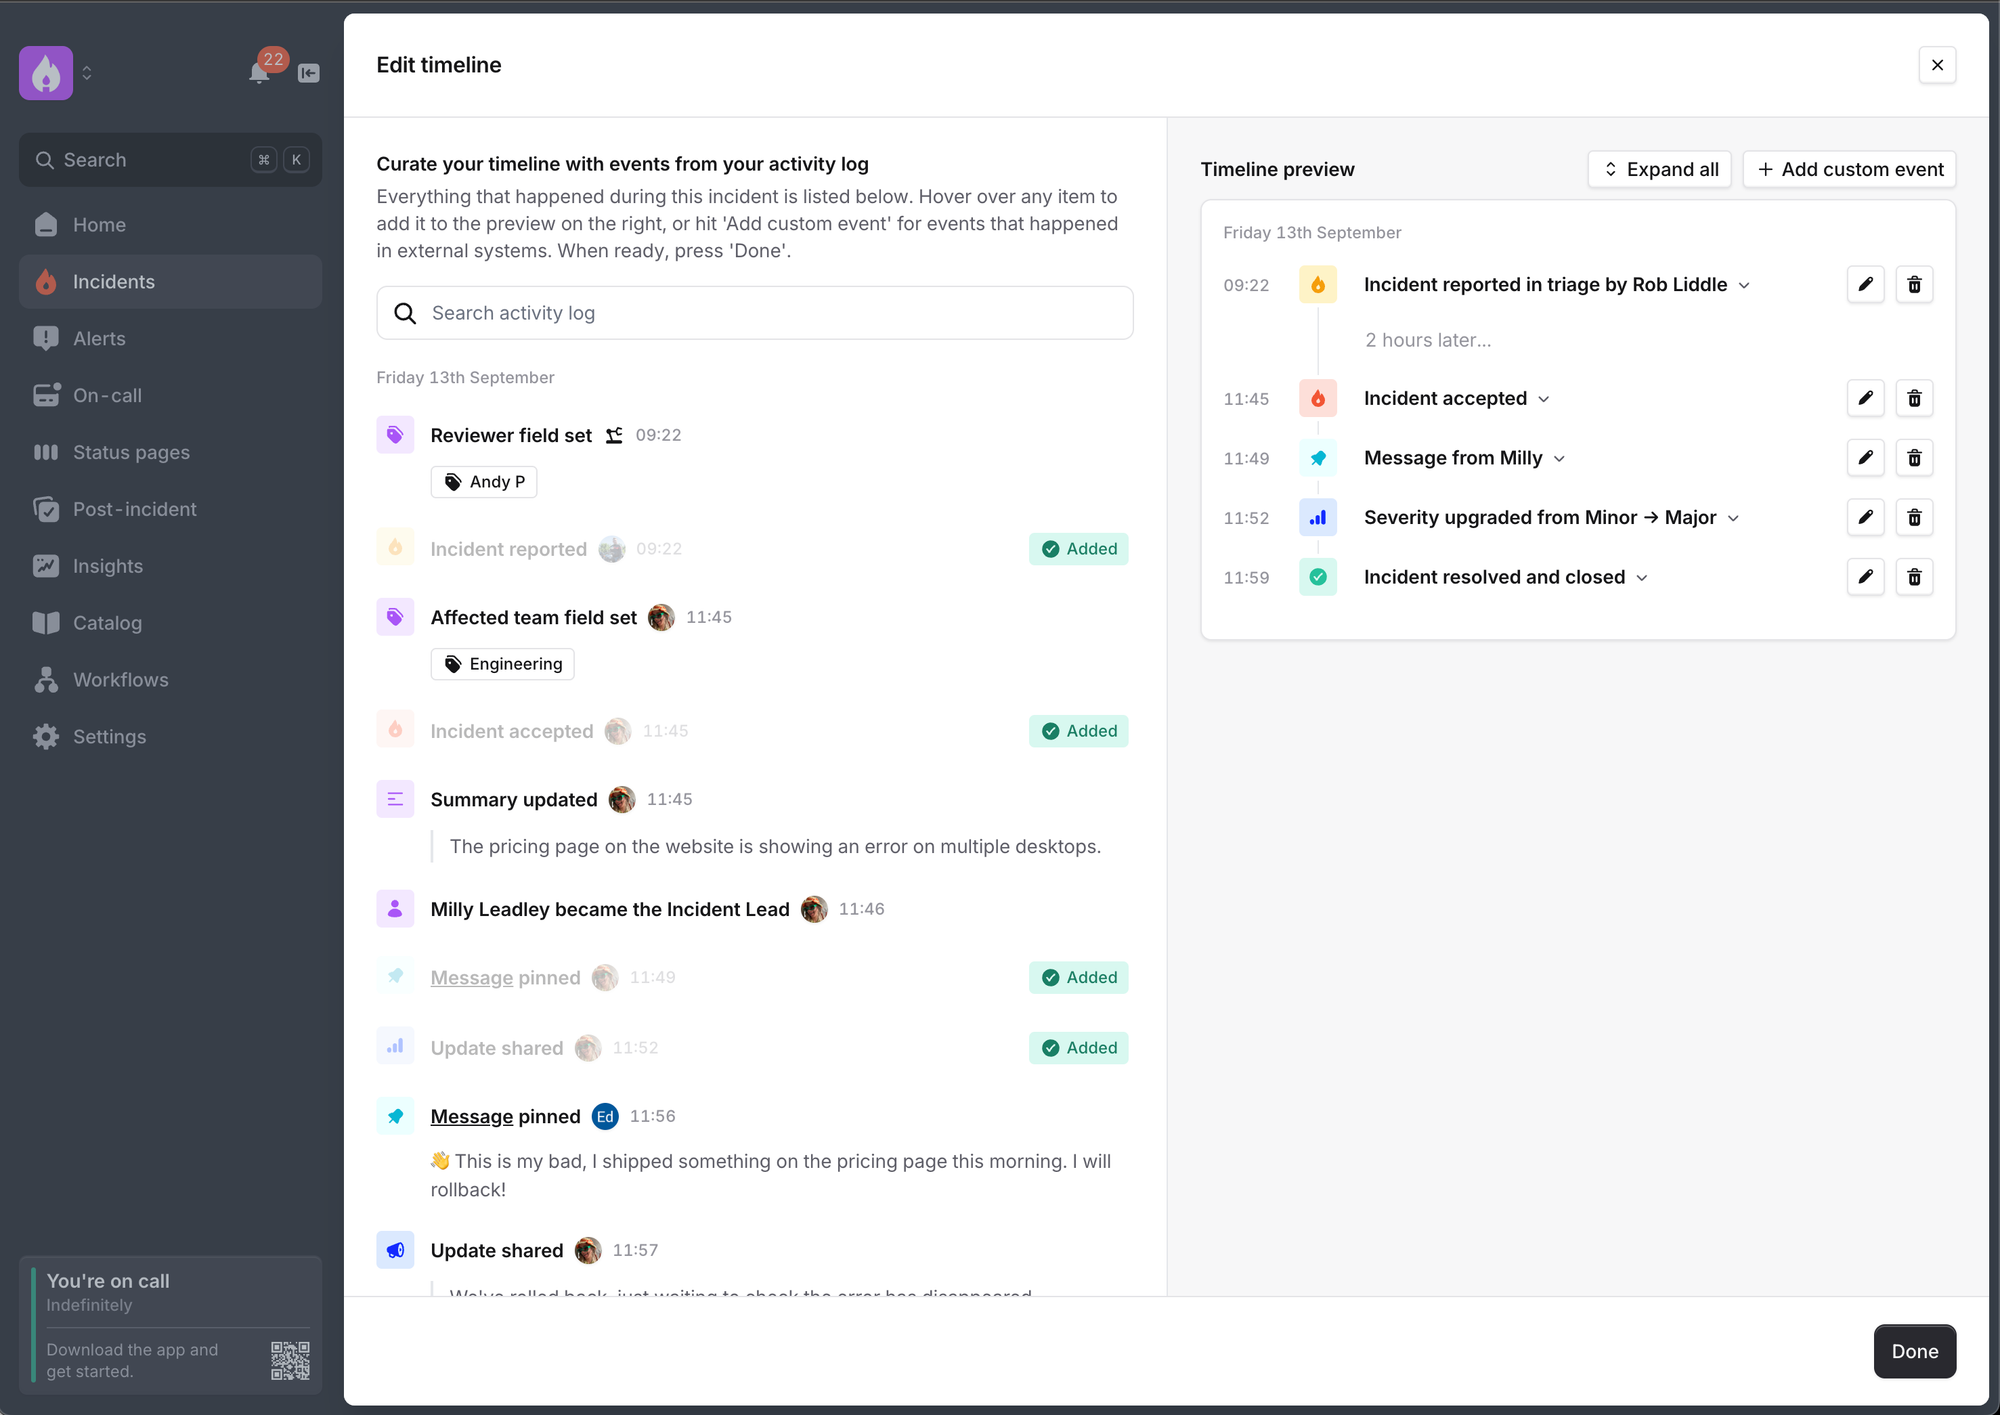
Edit your timeline events
Most excitingly, the timeline is now fully customizable so you can edit the titles of your events, or add a description. This means you can summarise what happened at a particular point in time, or add your own narrative about why a decision was made. At incident.io, we’ve often found that this results in better post-mortems because the timeline reads like a story rather than a log of events.
Note that you can also update the actual timestamp of something on the timeline now! So if a timeline event references a pinned message like “our customer reported this”, you can update the timestamp so it represents the actual time that something was reported, rather than when the Slack message was sent.

Add custom events
You can still add custom events, which can help track things that happened outside of an incident channel, like a deployment or a report from a customer. Most commonly, you might want to record the events that led up to the incident being declared.

Activity log
Lastly, if you still want to view everything that happened in an incident this is still possible. Just hit View all activity from the timeline tab and we’ll show you all the activity, along with who did it. This might be helpful if you want to figure out who set a particular custom field, or which workflow ran.
🚀 What else we’ve shipped
Alert configuration improvements
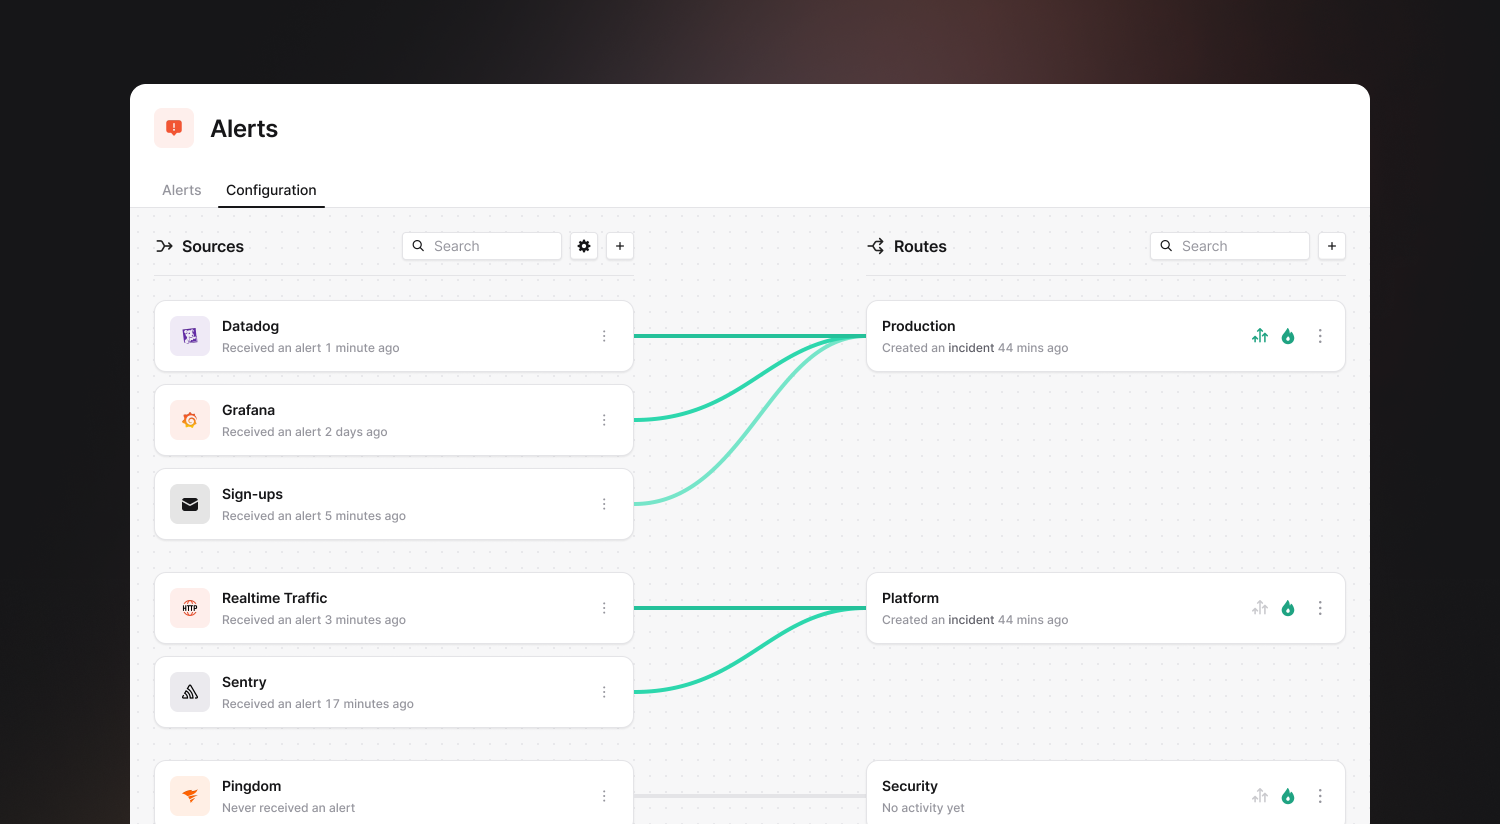
Our Alerts configuration has been enhanced, with sources, routes, attributes, and priorities now in a single configuration tab that more clearly shows the relationships between these resources. Whether your configuration is complex, or simple, it will now be much easier to understand what alerts are going where, which routes are creating escalations and incidents, and if you have any duplication between alert sources. If you hover on a link, we'll also let you know if you are using conditions on your alerts.
So good, you’ll break things on purpose
Ready for modern incident management? Book a call with one of our experts today.
We’d love to talk to you about
- All-in-one incident management
- Our unmatched speed of deployment
- Why we’re loved by users and easily adopted
- How we work for the whole organization


