Meet AI-powered Assistant
January 11, 2024

Delving into your incident history can be a remarkable source of understanding and improvement for your operations. However, identifying patterns, predicting potential trends, or even simply asking detailed queries can become a complex task if you need to first export and then manipulate a CSV.
Up to now, analysis has been possible via our comprehensive Insights charts. Even so, our customers have often asked for new nuanced charts or intricate filters for their reporting. It became clear that we needed a feature that promotes autonomy in analysis, to sit alongside our predefined set of insights charts.
Enter Assistant.
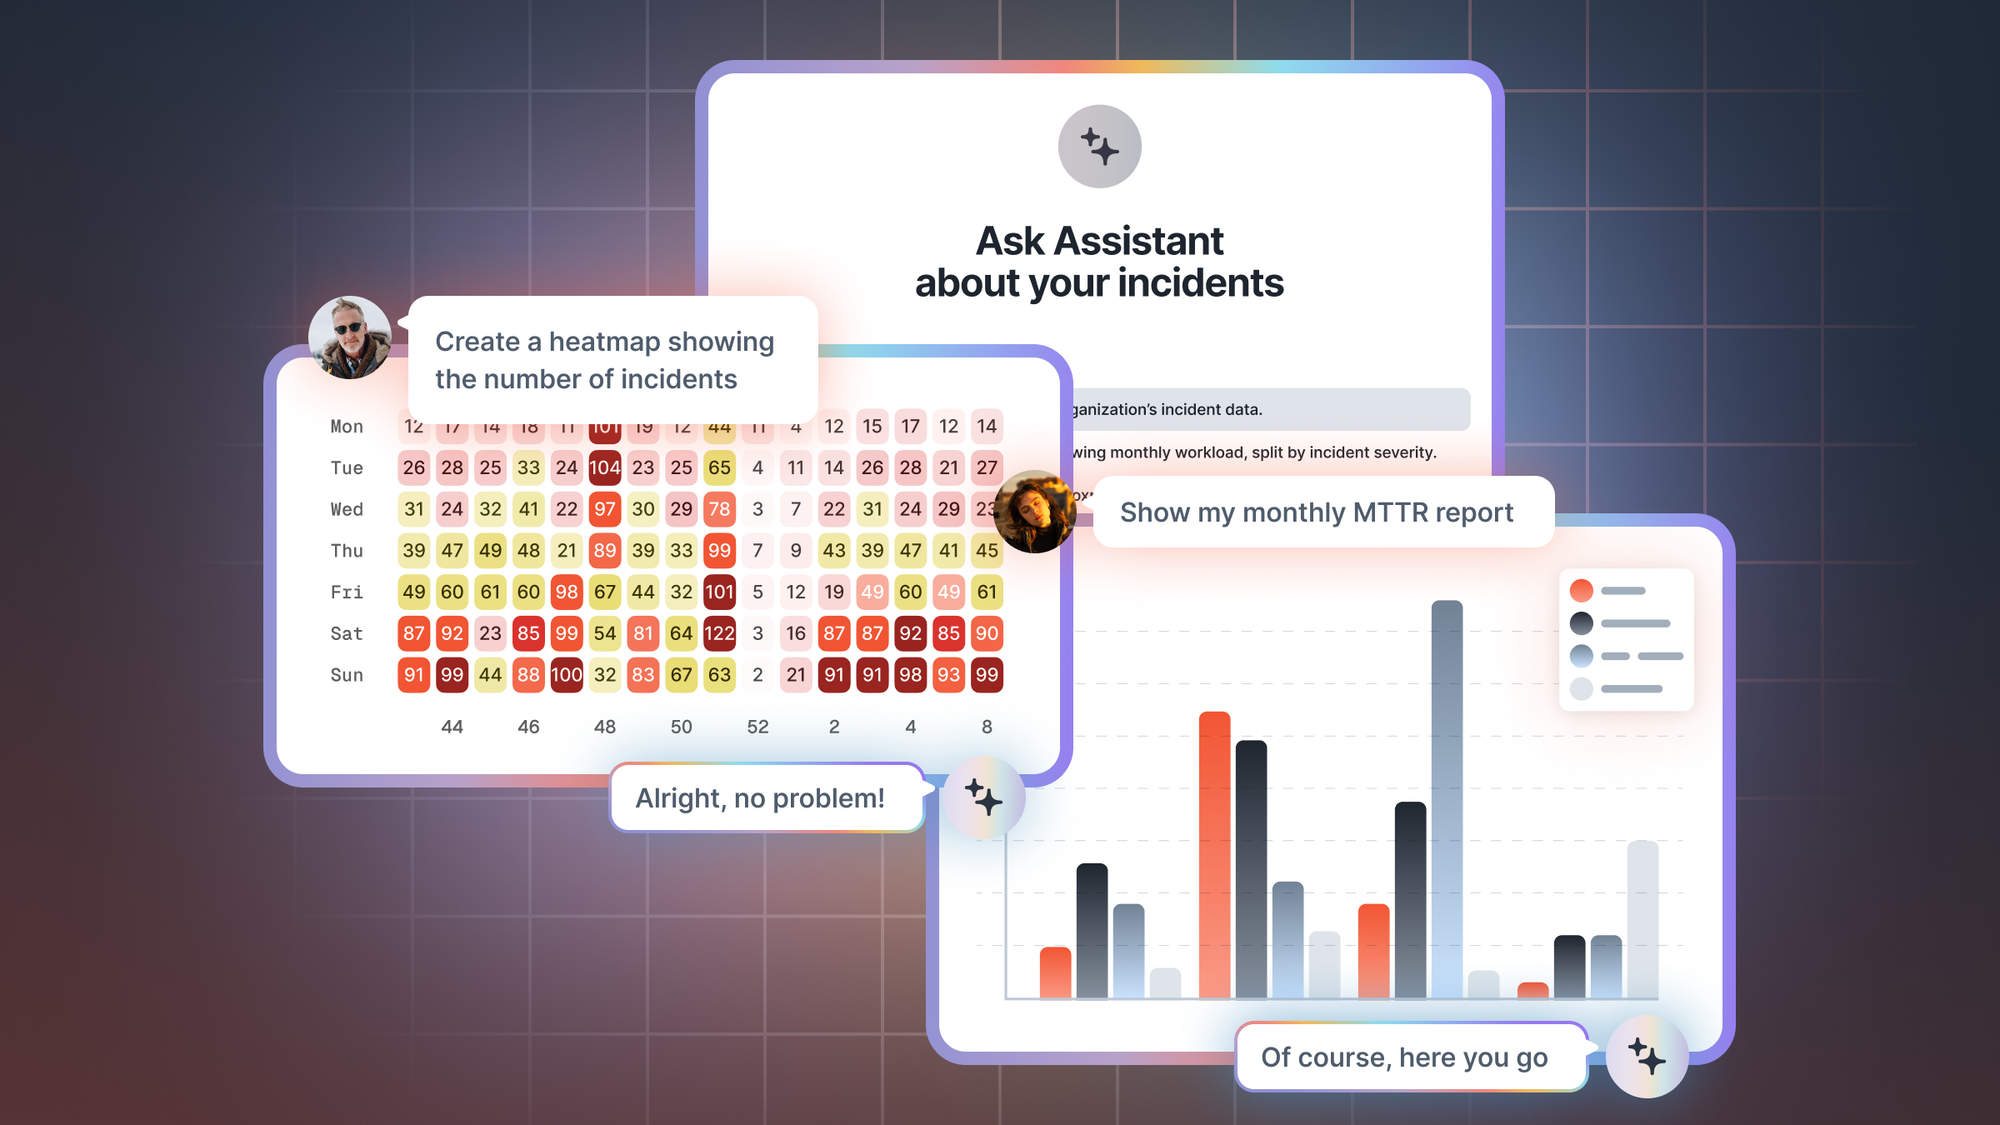
Assistant is our latest AI-powered feature, developed to address these needs. With Assistant, there are no more limitations on the type of analysis or charts you want to build - now you can carry out your analysis, exploring your incident history with a simple conversation.
Use a chat interface to interact with Assistant, start by asking it an interesting suggested question, or bring your own:
"Which weeks this quarter had the most incidents?"
The power then comes by continuing the conversation to iteratively explore deeper, with questions such as:
“Build a heatmap chart of number of incidents by day.”
“Can you identify common root causes for these spikes in incidents?”
“Are we still at risk of these root causes, or have things improved?”
“Which teams or individuals were most affected?”
Watch a 2 minute video of Assistant here.
💬 Interacting with Assistant
Using Assistant is simple; and designed to fit naturally into your workflow. Start by:
- Navigating to Insights
- Clicking on the banner at the top of the page, introduced for Assistant
- An overlay will appear on the right side of your screen → you can also open Assistant from any page via the CMD+K menu
Now it’s time to start the conversation, which can be done in a few ways:
- Click on one of our suggested questions
- Type in your question
- Ask Assistant for three interesting questions - it’ll surprise you how well this works!
Assistant has secure access to all your incidents, excluding private ones (read more in this help article). This means you can dive into a comprehensive analysis of year-on-year trends, catch up with what's happened this week, or even query about a live incident right now.
Assistant has a wealth of metadata about each incident, including custom fields and timestamps. This allows you to refine and segment your analysis, like asking for charts based on your Affected Team custom field, or calculating Time to Resolution (TTR) metrics.
And to make it even more personal, Assistant knows who you are. Try asking a question related to your interactions with incidents, such as "What types of incidents do I usually lead?" or “How do I commonly interact with incidents?”. The analysis adapts to your needs, whether you're asking a company-wide question or personal introspection.

🧩 What can it do?
At incident.io, we've been using Assistant internally and have continued to discover new and valuable ways of leveraging it. Whether it's for quarterly reports, exploring team dynamics, or identifying common causes for incidents, the possibilities are vast and varied. Plus, Assistant's ability to generate diverse visualizations, from bar charts to heatmaps, enriches your investigations further.
Here are some suggestions on how to use Assistant:
- Historical trend identification → Prepare your quarterly reporting to engineering leadership with ease. Visualize trends, identify historical patterns, and provide rich context via custom charts.
- Try asking → "Chart the number of incidents each week for the last quarter."
- End of year review → As you wrap up the year, use Assistant to highlight fun facts and interesting events that occurred during the year. Compile your year-end review and even offer data-backed predictions for the coming year.
- Try asking → "What was the longest-running major incident last year?"
- Balancing your team's load → As a tech lead, you can monitor who among your team is taking on too many incidents. Avoid burnout risks by identifying uneven workloads and utilizing data to balance responsibilities better.
- Try asking → "Which team members have led the most incidents in the past three months?"
- Identify 'hot' times → Analyze what days of the week and times of day incidents most commonly occur. Uncover patterns that may suggest avoidable root causes or reveal opportunities for improving your incident management practices.
- Try asking → "Visualize in a heatmap chart the number of incidents by day of the week."
- Common root cause exploration → Review and understand the triggers for incidents across different teams, providing valuable intel to prevent future incidents or expedite their resolution.
- Try asking → "What are the most common root causes for incidents affecting the team?"
- Understanding your role → Dive into your relationships with incidents. Uncover what types of incidents you are frequently leading or involved in. Reflect on your practices, and identify areas of expertise or opportunities for development.
- Try asking → "What types of incidents do I most commonly get involved in?"
Remember, these are just a handful of the limitless possibilities Assistant offers. With such a tool at your disposal, the only question left is - where will you start exploring?
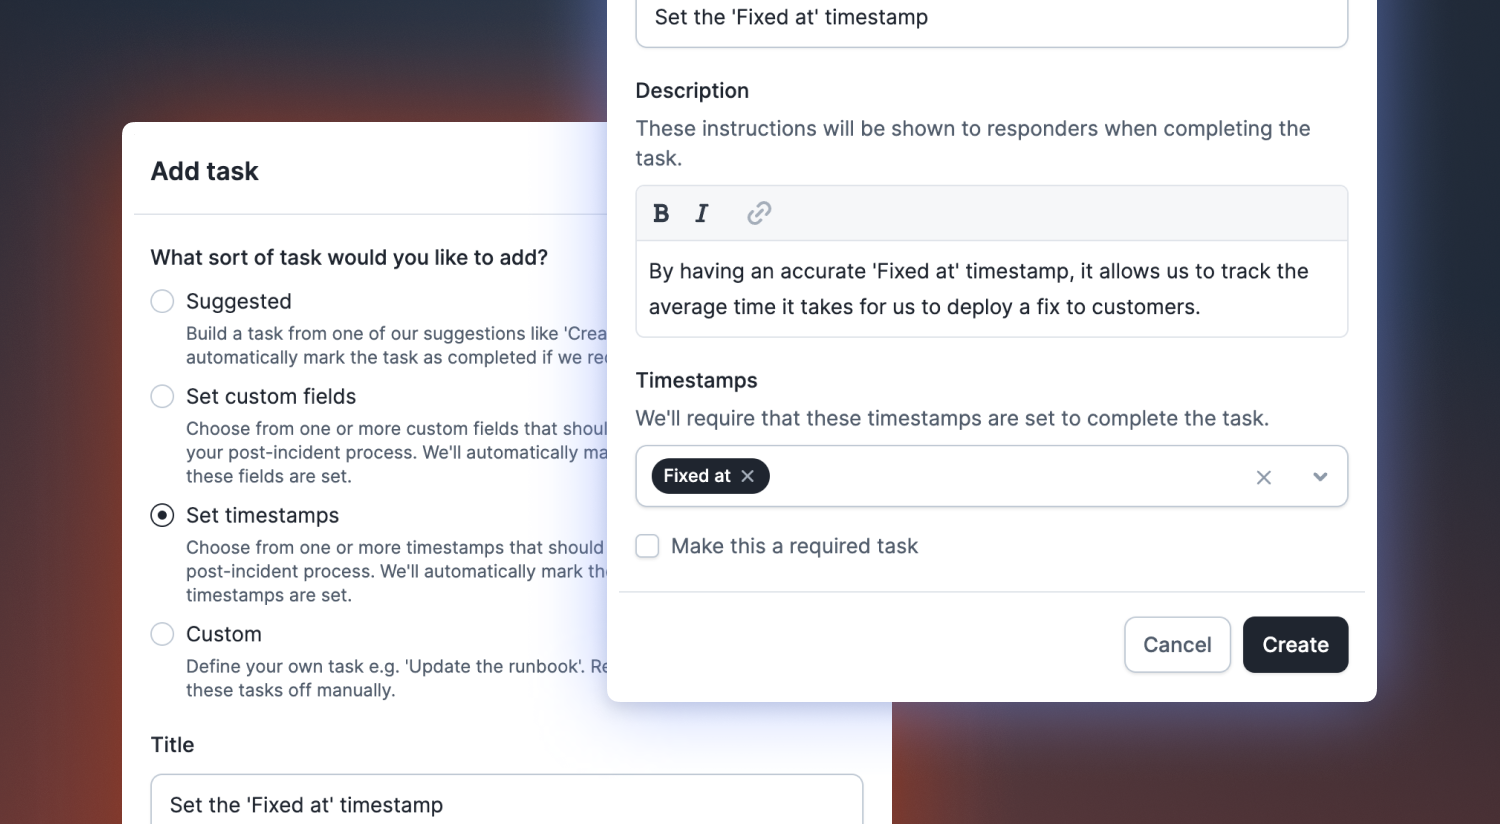
New post-incident task type: Set timestamps
This task will allow you to configure specific timestamps to be set during your post-incident process. This will be useful in capturing timestamps of key moments in incidents, leading to more accurate data in features like the MTTX dashboards in Insights to spot trends in durations of incidents over time.

🚀 What else we’ve shipped
New
- Automated user provisioning with SCIM now supports more providers, including Azure AD
- There is now a workflow step to automatically update or publish an incident to a customer status page
Improvements
- When sharing a post-mortem, you can now write very long messages
- Truncate long summary updates from workflows
Bug fixes
- Linear label groups now cannot be selected when exporting a follow-up
- The section for configuring how status page emails look had disappeared. It's back!
- We’ll now return a nice error message if you try to re-use the name of a Jira issue template
- Wrapped
delete lifecycleoperations in a transaction to prevent errors from occurring halfway through - Fixed the "Create Postmortem" button in the dashboard version of the post-incident flow
- Properly sync channel messages for retrospective incidents when the incident bot is added to the channel
So good, you’ll break things on purpose
Ready for modern incident management? Book a call with one of our experts today.

We’d love to talk to you about
- All-in-one incident management
- Our unmatched speed of deployment
- Why we’re loved by users and easily adopted
- How we work for the whole organization


