Introducing Audit Logs
April 19, 2023

Keeping track of what's happening within a larger organization's setup can be hard. Sometimes there are changes that you weren't expecting or perhaps you spot something that just doesn't seem right. Was it deliberate? By accident? Or even malicious?
Having a log of what changes were made and who made them is key to gaining insight into exactly what happened.
We're excited to share that as of today, customers can now view and export audit logs of important actions to do just that!
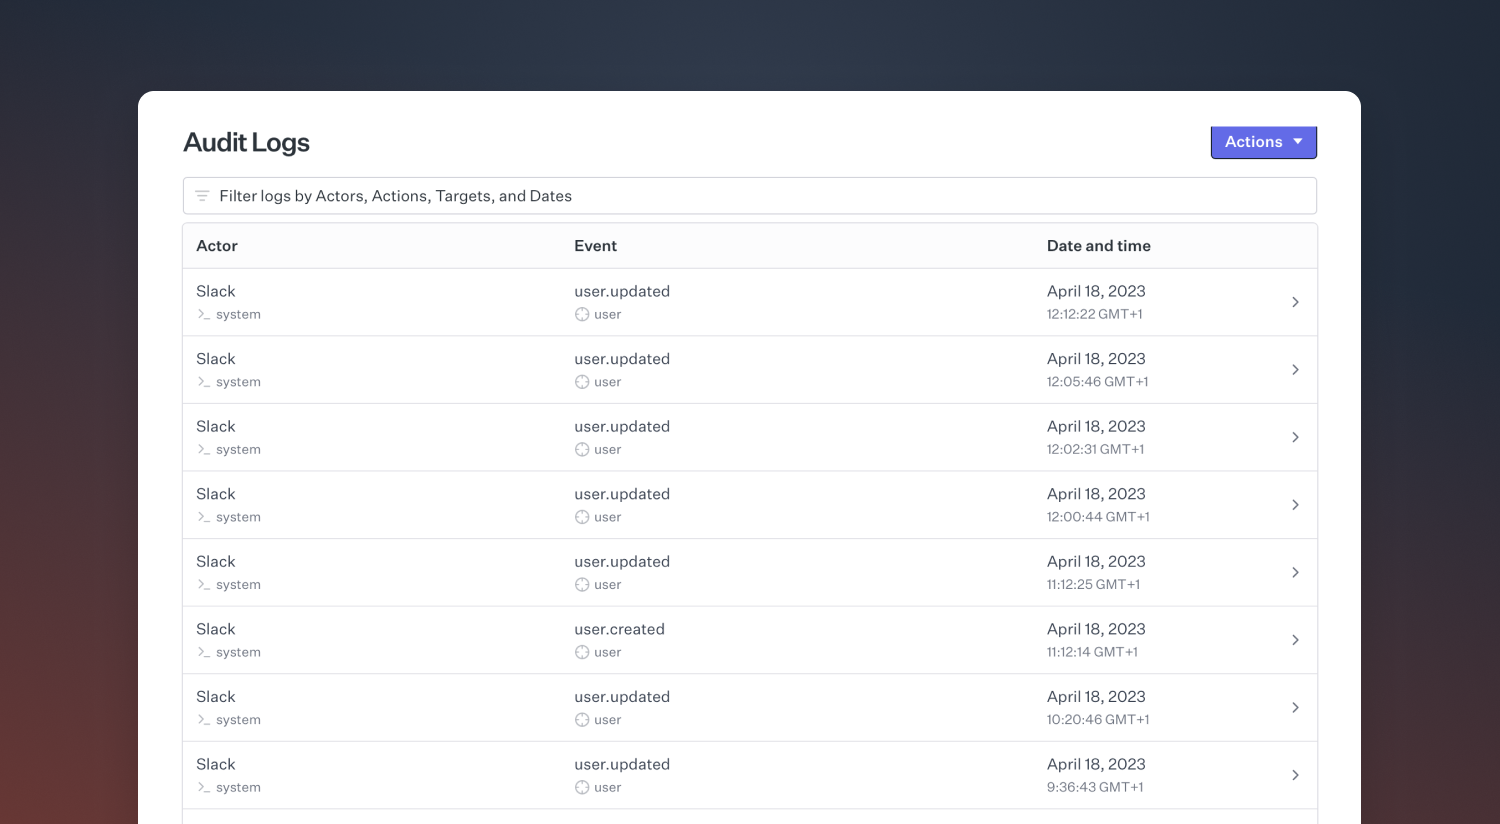
Our audit logs track actions taken within your organization such as user changes, role alterations, workflow edits, and the installation or removal of integrations. We also track when users are granted access to private incidents and even when users attempt to access incidents they are not permitted to.
You can see a full list of the events we currently track by reading the audit logs section in our API documentation.
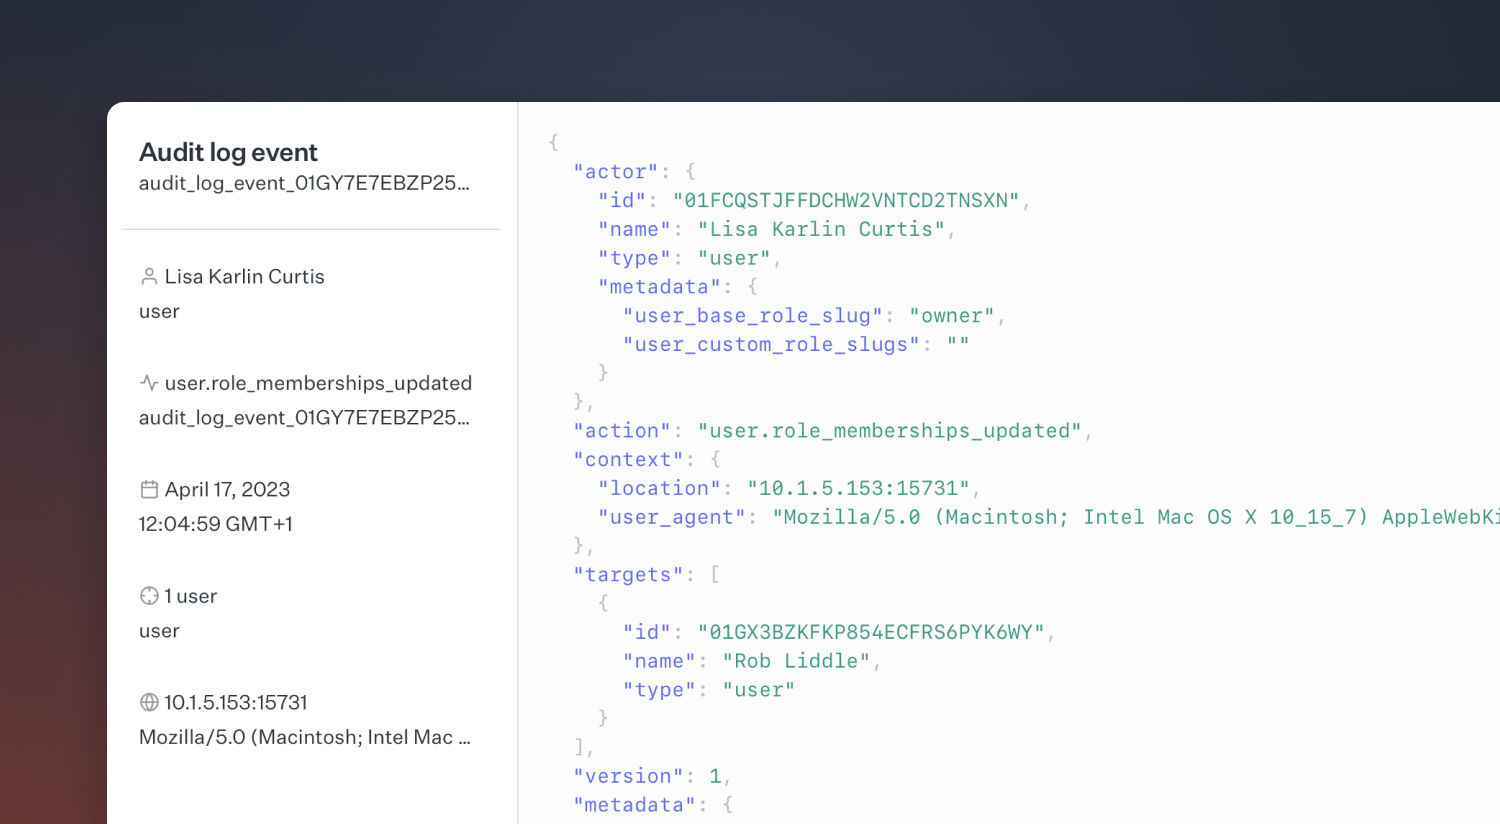
Each audit log entry will be made up of a simple schema detailing:
- the actor who made the change, e.g. a user
- the action that was undertaken
- the target or subject that was altered by this action, e.g. another user
There are a number of ways to view your audit logs either via our simple UI, exporting to CSV, or even streaming events into your Security Incident and Event Management (SIEM) provider such as Datadog, Splunk, or AWS S3.
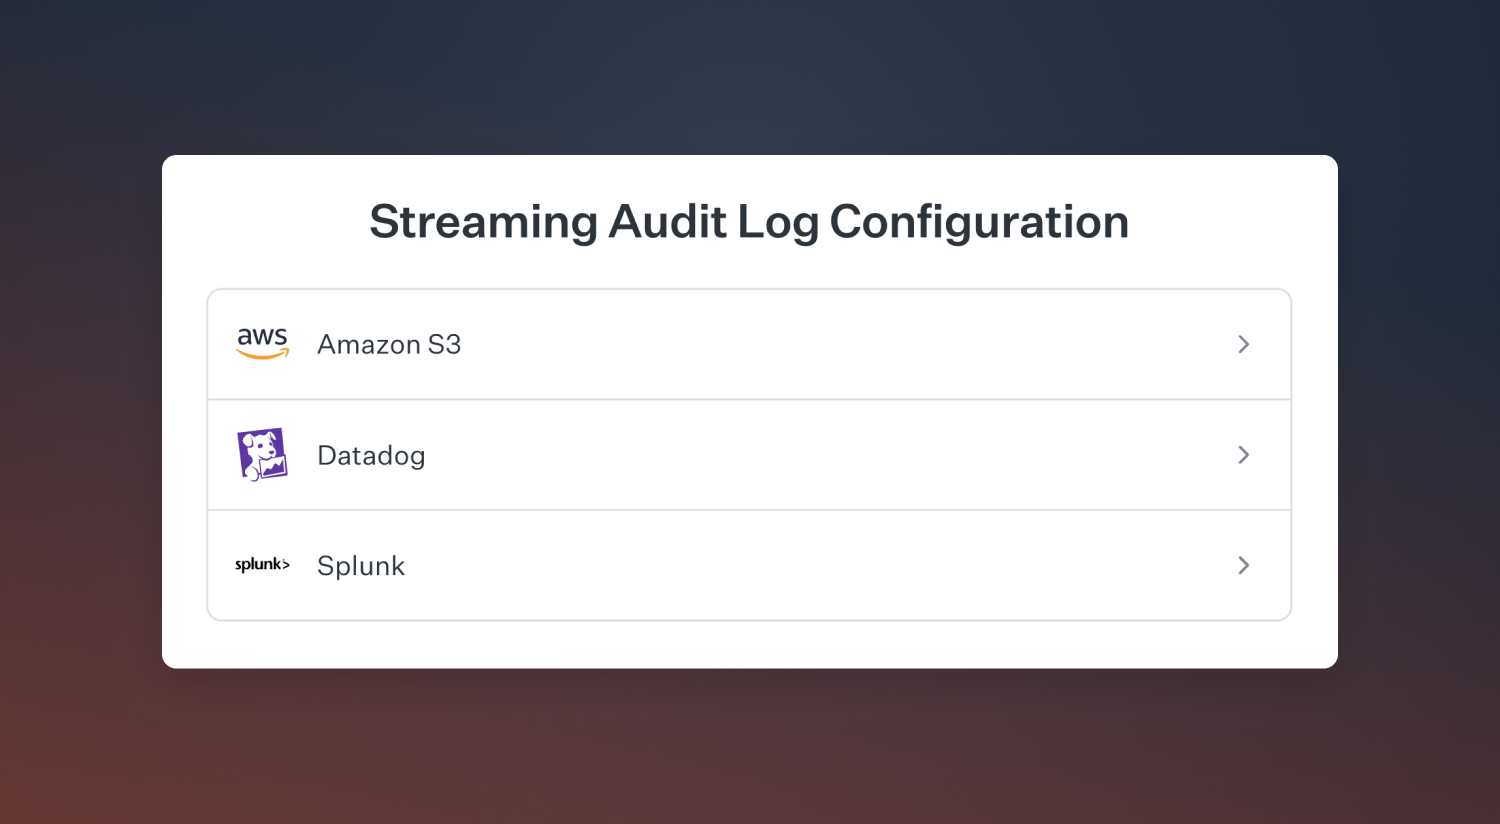
For more information on how to get access audit logs, the types and schema of events, and setting up your own SIEM integration please refer to our help centre article.
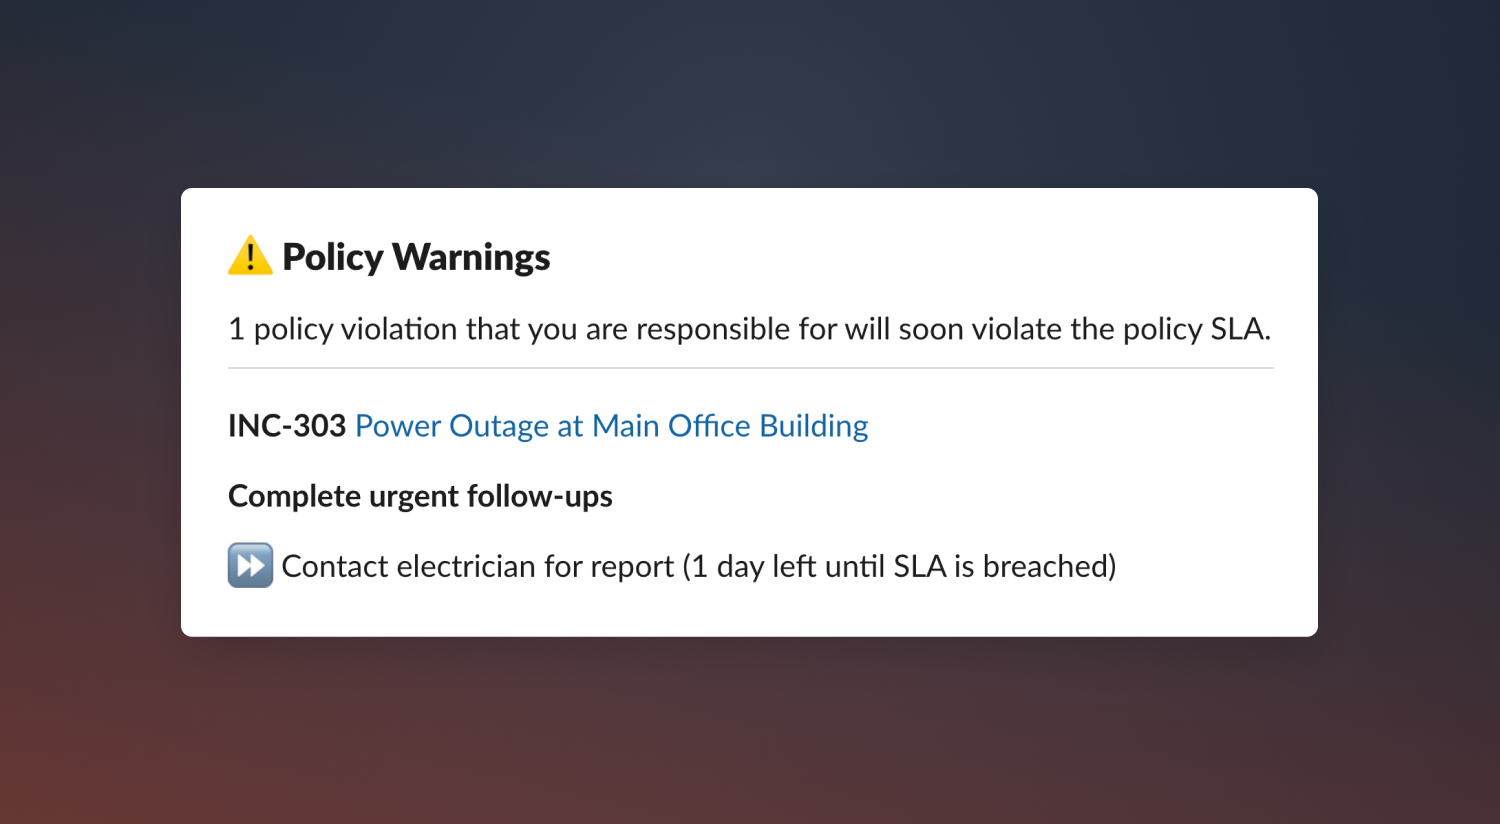
Policy warnings
Policies can now be configured to warn you about upcoming violations, before they happen. This is optional configuration that will nudge the policy's responsible user via a direct Slack message, and highlight upcoming policy violations within the web dashboard.
🚀 What else we shipped
New
- You can now create an incident with a type of "I don't know yet" in the dashboard
- We've added the ability to filter follow ups by created at
Improvements
- We updated our x-axis labels in our Insights charts to better convey the time period the represent
Bug fixes
- We fixed a bug where default values were not actually set when filtering incidents in the dashboard
- We fixed a bug where workflow runs were not being shown on the dashboard
- We fixed a bug where you could not unset roles when incident conditions had been altered
- We fixed a bug where we were not handling certain responses from Zoom correctly when creating a meeting
- We fixed a bug where we did not respect the timezone of timestamps when exporting a post-mortem to Notion
- We fixed a bug where the latest version of a pinned message that was edited was not shown
So good, you’ll break things on purpose
Ready for modern incident management? Book a call with one of our experts today.
We’d love to talk to you about
- All-in-one incident management
- Our unmatched speed of deployment
- Why we’re loved by users and easily adopted
- How we work for the whole organization


