Tracing Gorm queries with OpenCensus & Google Cloud Tracing

At incident.io we use gorm.io as the ORM library for our Postgres database, it’s a really powerful tool and one I’m very glad for after years of working with hand-rolled SQL in Go & Postgres apps. You may have seen from our other blog posts that we’re heavily invested in tracing, specifically with Google Cloud Tracing via OpenCensus libraries. A huge amount of our application’s time is spent talking to Postgres through gorm, so we wanted to get a better view of that in our tracing stack.
Luckily Gorm has perfect hooks for us to pull tracing out of through the Callbacks API, this allows us to provide Gorm with functions that get called at specific parts of the query lifecycle, either allowing you to change query behaviour in a traditional middleware approach, or in our case, pull out data for observability.
func beforeQuery(scope *gorm.DB) {
	// do stuff!
}

db.Callback().
	Create().
	Before("gorm:query").
	Register("instrumentation:before_query", beforeQuery)
Our goal in this post is to introduce tracing spans to our Gorm queries, in order to do that we need to catch both the start and end events, and deal with the spans accordingly. In these examples I’m going to be using the tracing tools provided by go.opencensus.io/trace which feeds into Google Cloud Tracing, but other tracing libraries should behave similarly.
Now we have a function called when a query starts, we need to begin our span:
func beforeQuery(scope *gorm.DB) {
	db.Statement.Context = startTrace(
    db.Statement.Context,
    db,
    operation,
  )
}

func startTrace(
  ctx context.Context,
  db *gorm.DB,
) context.Context {
	// Don't trace queries if they don't have a parent span.
	if span := trace.FromContext(ctx); span == nil {
		return ctx
	}

	ctx, span := trace.StartSpan(ctx, "gorm.query")
	return ctx
}
And then we need to end the span too:
func afterQuery(scope *gorm.DB) { endTrace(scope) }

func endTrace(db *gorm.DB) {
	span := trace.FromContext(db.Statement.Context)
	if span == nil || !span.IsRecordingEvents() {
		return
	}

	var status trace.Status

	if db.Error != nil {
		err := db.Error
		if err == gorm.ErrRecordNotFound {
			status.Code = trace.StatusCodeNotFound
		} else {
			status.Code = trace.StatusCodeUnknown
		}

		status.Message = err.Error()
	}
	span.SetStatus(status)
	span.End()
}

db.Callback().
	Query().
	After("gorm:query").
	Register("instrumentation:after_query", afterQuery)
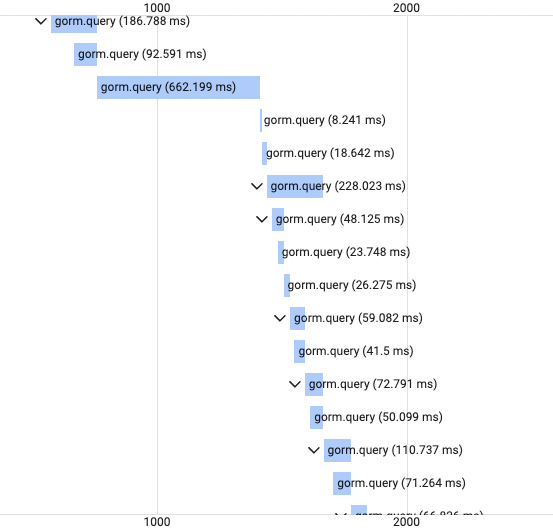
Now we can see all of our gorm queries in our traces, nice!

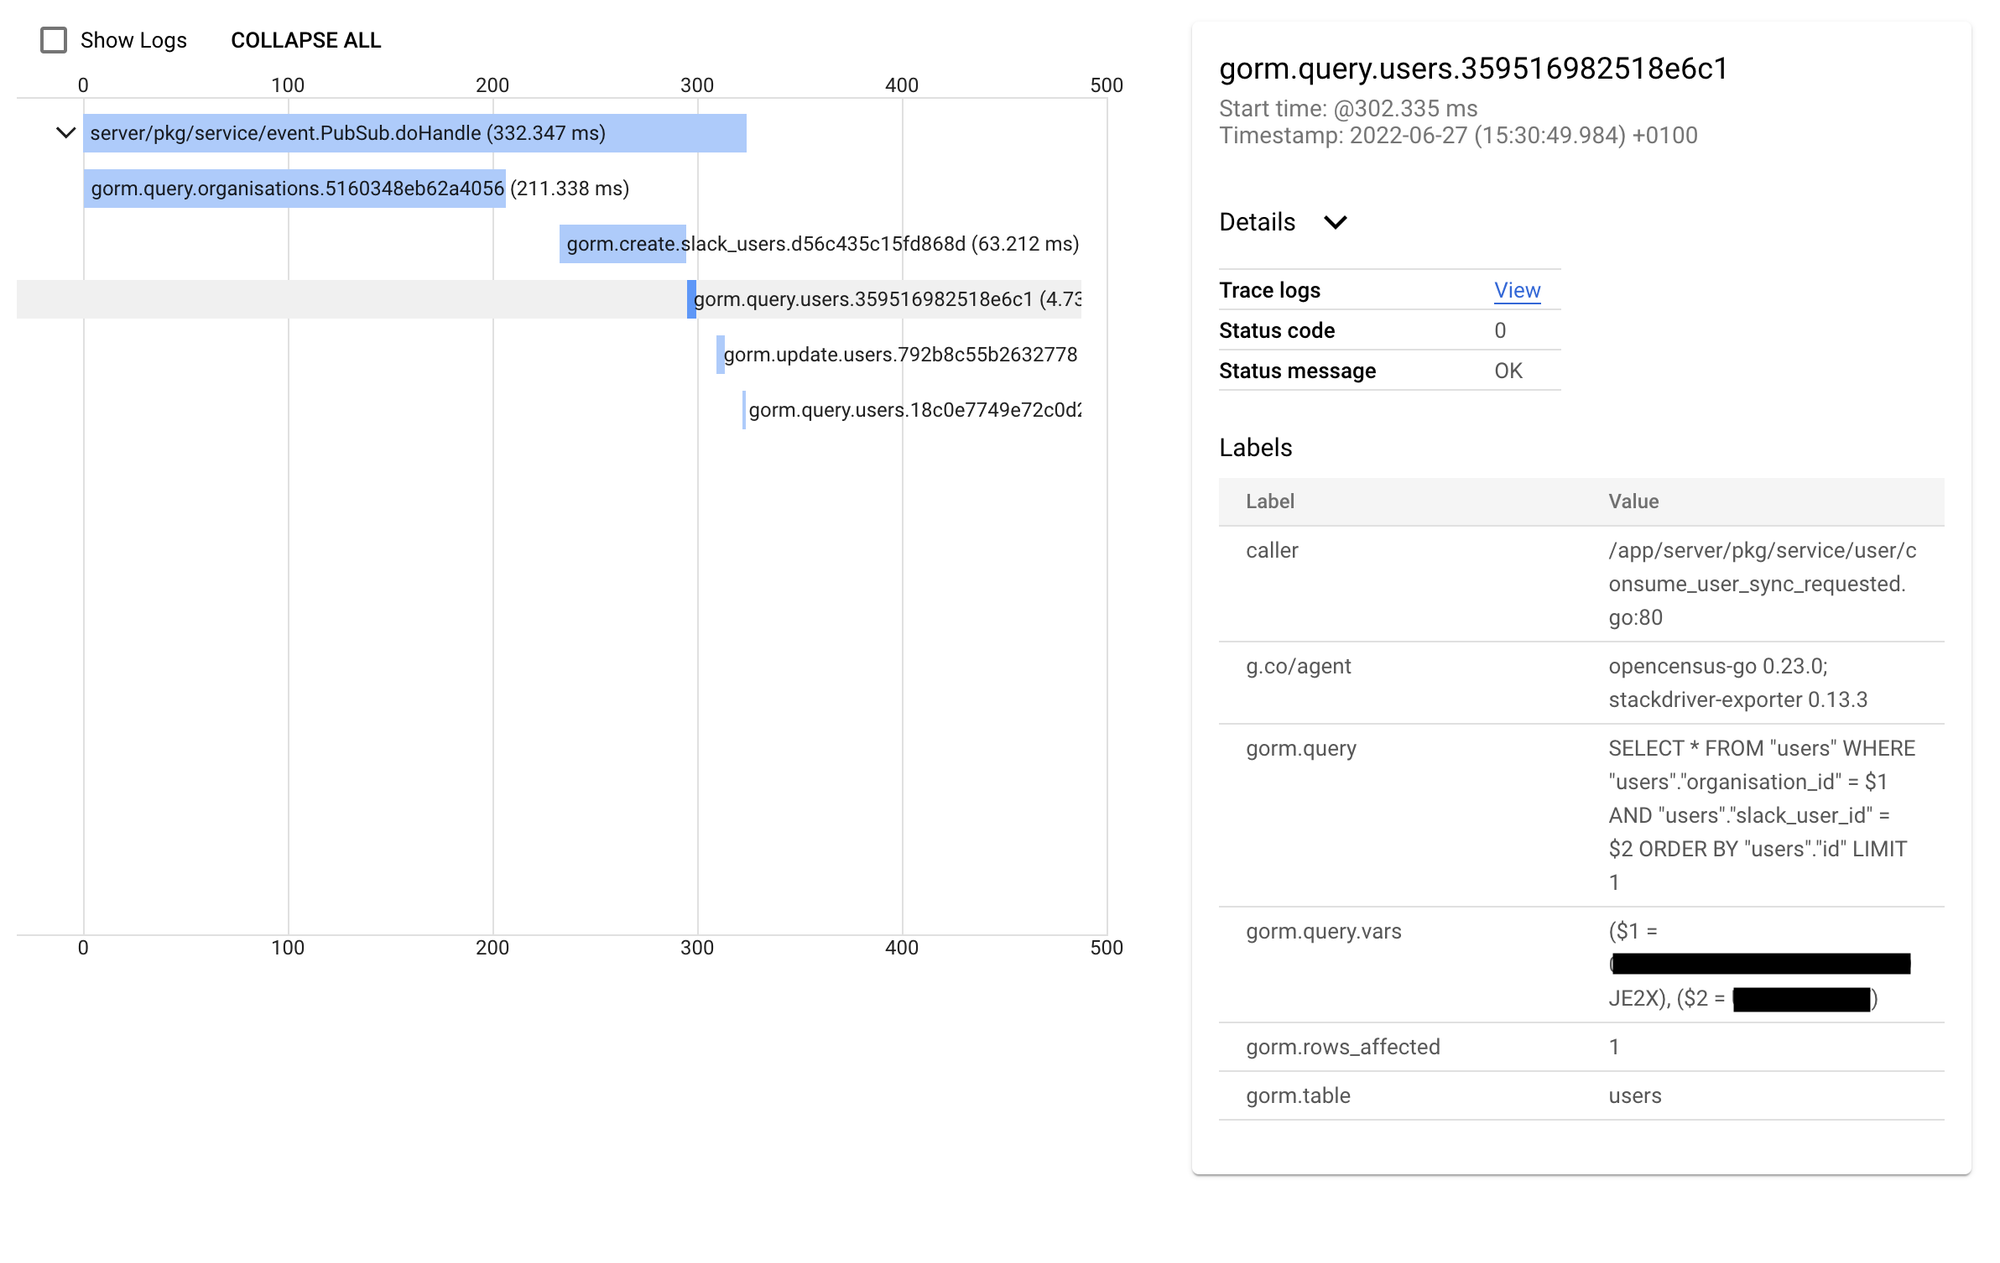
However they’re not super clear about what we’re actually doing, let’s see if we can make these spans a little more informative, by adding:
- table name & query fingerprint¹ to the span name.
- the line of code that called us
- the WHERE params from select queries
- number of rows affected
¹ A query fingerprint is a unique identifier for a query regardless of formatting & variables, so you can uniquely identify queries that will behave the same in your database.
let’s extend our code from earlier:
func startTrace(ctx context.Context, db *gorm.DB) context.Context {
	// Don't trace queries if they don't have a parent span.
	if span := trace.FromContext(ctx); span == nil {
		return ctx
	}

	// start the span
	ctx, span := trace.StartSpan(ctx, fmt.Sprintf("gorm.query.%s", db.Statement.Table))

	// set the caller of the gorm query, so we know where in the codebase the
	// query originated.
	//
	// walk up the call stack looking for the line of code that called us. but
	// give up if it's more than 20 steps, and skip the first 5 as they're all
	// gorm anyway
	var (
		file string
		line int
	)
	for n := 5; n < 20; n++ {
		_, file, line, _ = runtime.Caller(n)
		if strings.Contains(file, "/gorm.io/") {
			// skip any helper code and go further up the call stack
			continue
		}
		break
	}
	span.AddAttributes(trace.StringAttribute("caller", fmt.Sprintf("%s:%v", file, line)))

	// add the primary table to the span metadata
	span.AddAttributes(trace.StringAttribute("gorm.table", db.Statement.Table))
	return ctx
}

func endTrace(db *gorm.DB) {
	// get the span from the context
	span := trace.FromContext(db.Statement.Context)
	if span == nil || !span.IsRecordingEvents() {
		return
	}

	// set the span status, so we know if the query was successful
	var status trace.Status
	if db.Error != nil {
		err := db.Error
		if err == gorm.ErrRecordNotFound {
			status.Code = trace.StatusCodeNotFound
		} else {
			status.Code = trace.StatusCodeUnknown
		}

		status.Message = err.Error()
	}
	span.SetStatus(status)

	// add the number of affected rows & query string to the span metadata
	span.AddAttributes(
		trace.Int64Attribute("gorm.rows_affected", db.Statement.RowsAffected),
		trace.StringAttribute("gorm.query", db.Statement.SQL.String()),
	)
	// Query fingerprint provided by github.com/pganalyze/pg_query_go
	fingerprint, err := pg_query.Fingerprint(db.Statement.SQL.String())
	if err != nil {
		fingerprint = "unknown"
	}

	// Rename the span with the fingerprint, as the DB handle
	// doesn't have SQL to fingerprint before being executed
	span.SetName(fmt.Sprintf("gorm.query.%s.%s", db.Statement.Table, fingerprint))

	// finally end the span
	span.End()
}

func afterQuery(scope *gorm.DB) {
	// now in afterQuery we can add query vars to the span metadata
	// we do this in afterQuery rather than the trace functions so we
	// can re-use the traces for non-select cases where we wouldn't want
	// to record the vars as they may contain sensitive data

	// first we extract the vars from the query & map them into a
  // human readable format
	fieldStrings := []string{}
	if scope.Statement != nil {
		fieldStrings = lo.Map(scope.Statement.Vars, func(v any i int) string {
			return fmt.Sprintf("($%v = %v)", i+1, v)
		})
	}
	// then add the vars to the span metadata
	span := trace.FromContext(scope.Statement.Context)
	if span != nil && span.IsRecordingEvents() {
		span.AddAttributes(
			trace.StringAttribute("gorm.query.vars", strings.Join(fieldStrings, ", ")),
		)
	}
	endTrace(scope)
}
And now we end up with super rich easy to scan spans, making it much easier to understand what our app is spending it’s time doing, yay!

Gorm offers callbacks for a bunch of different bits of the query lifecycle, and you can add specific behaviour for all of them, we currently trace create, delete, update, and query separately, but if you want to go further you can check out the gorm docs! . You can find all of the code from this post here.
Please remember, you could end up tracing some sensitive data if you're not careful. So make sure to sanitise your query vars id applicable. One good practice is to only trace SELECT queries, as they're typically done via IDs, as opposed to any sensitive information.

See related articles

Who's on call? How Claude helped us calculate this 2,500x faster
A look at how on-call schedules work, and how we made rendering them 2,500× faster — through profiling, smarter algorithms, and some Claude.
 Rory Bain
How it feels to run an incident with AI SRE
For the last 18 months, we've been building AI SRE, and one of the things we've learned is that UX matters more than you think. This week, I used AI SRE to run a real incident, and I walk you through it end-to-end.
 Chris Evans
What does using AI for post-mortems actually mean?
Everyone is using AI to help with post-mortems now. We've built AI into our own post-mortem experience, pulling your Slack thread, timeline, PRs, and custom fields together and giving your team a meaningful starting point in seconds. But "AI for post-mortems" can mean very different things.
 incident.io
So good, you’ll break things on purpose
Ready for modern incident management? Book a call with one of our experts today.

We’d love to talk to you about
- All-in-one incident management
- Our unmatched speed of deployment
- Why we’re loved by users and easily adopted
- How we work for the whole organization


