Clouds, caches and connection conundrums
September 26, 2023 — 13 min read

We recently moved our infrastructure fully into Google Cloud. Most things went very smoothly, but there was one issue we came across last week that just wouldn’t stop cropping up.
What follows is a tale of rabbit holes, red herrings, table flips and (eventually) a very satisfying smoking gun. Grab a cuppa, and strap in.
Our journey starts, fittingly, with an incident getting declared... 💥🚨
/inc spike in connection timeouts
The trigger for this incident was a larger-than-normal number of Postgres connection timeouts. This wasn’t something we’d seen with our previous infrastructure, and we’d done plenty of testing beforehand, as you'd expect when migrating millions of requests and huge amounts of data.
Even so, it’s always hard to pre-empt everything, so concerned we’d missed something, we got to work.
When we looked at the number of new connections being opened per second, it was in the hundreds, spiking up and down like crazy.
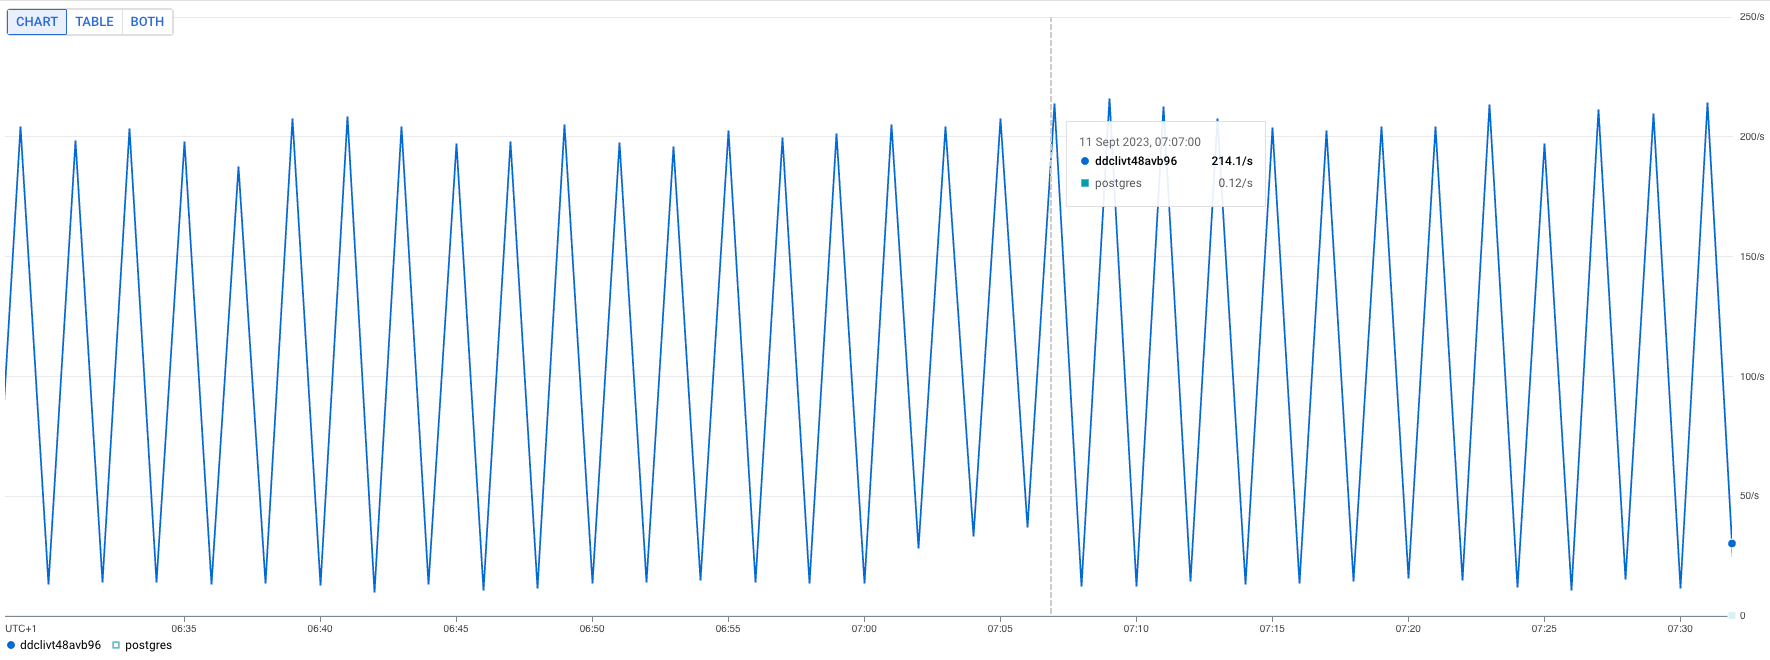
We weren’t quite sure what was happening, but we had a few initial theories. One of those was that there was potentially a race condition where connections were expiring. any goroutines were trying to re-use the same dead connection at the same time and subsequently opening up new connections en-masse.
We figured it was worth trying two things:
- Doubling the maximum connection lifespan from 15m to 30m
- Making connection pools static (always keep N connections open)
Shortly after making those changes, we immediately noticed an improvement. New connections created dropped from ~200/s to ~1/s. Phew, back to normal. Still plenty to investigate, but healthy graphs, at least.
Memcache joins the party
Postgres wasn’t the only part of our infrastructure having a tough time at this point. In our product, we use a memcached instance to hold transient data and speed up some API responses. Usage of this cache was also experiencing sporadic connection timeout issues.
Our memcache client has a default network timeout of 100ms. That’s pretty generous, given that our memcache server is generally <1ms away, but does mean that any TCP packet that's been dropped will probably result in a timeout being hit.
From our perspective, that's fine and actively desirable—we don't want to delay responses on the basis of the cache being unavailable.
We were using a default configuration parameter of 2 idle connections, which is the default, and there was a suggestion here that increasing this value could help with timeouts. We didn’t buy that, especially as that person later follows up, saying that it should work fine with the default value.
Having read the library code, this was also our understanding.
We did notice that there's nothing that validates the health of a connection after checking it out from the pool, which means that if you last shoved a connection back into the pool a couple of days ago, it could still be picked up and we might try to send something down it just to receive a response of “there’s nobody here anymore!” However, we didn’t think this was actually what was happening—it definitely looked more like connection timeouts.
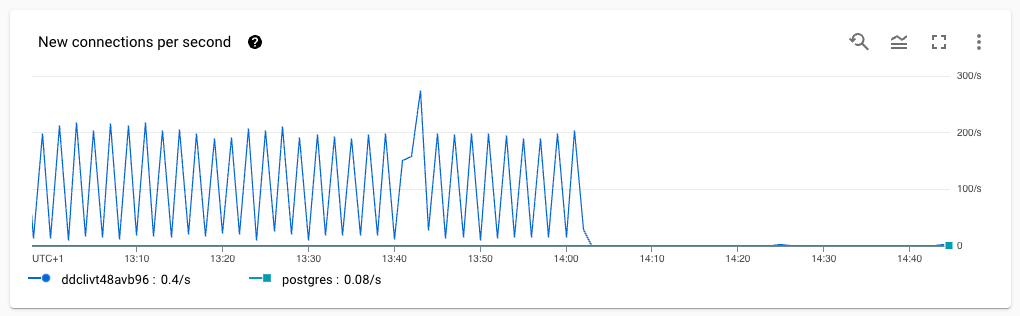
We opted to try increasing the number of MaxIdleConns from 2 to 20. The library says it should be set to “higher than your peak parallel requests,” and we certainly did hit that threshold, so it seemed reasonable to give it an order of magnitude bump and see what happened.
The difference was almost immediate:
However, a few days later, we started seeing many more “read i/o” timeouts. The plot thickens…!
Taking back control
In an effort to reduce unknown variables, we decided to temporarily move away from Google’s hosted memcached to our own, running inside our Kubernetes cluster. This would, in theory, mean even lower latency, fewer network hops, and fewer unknowns or deviations compared to the managed service.
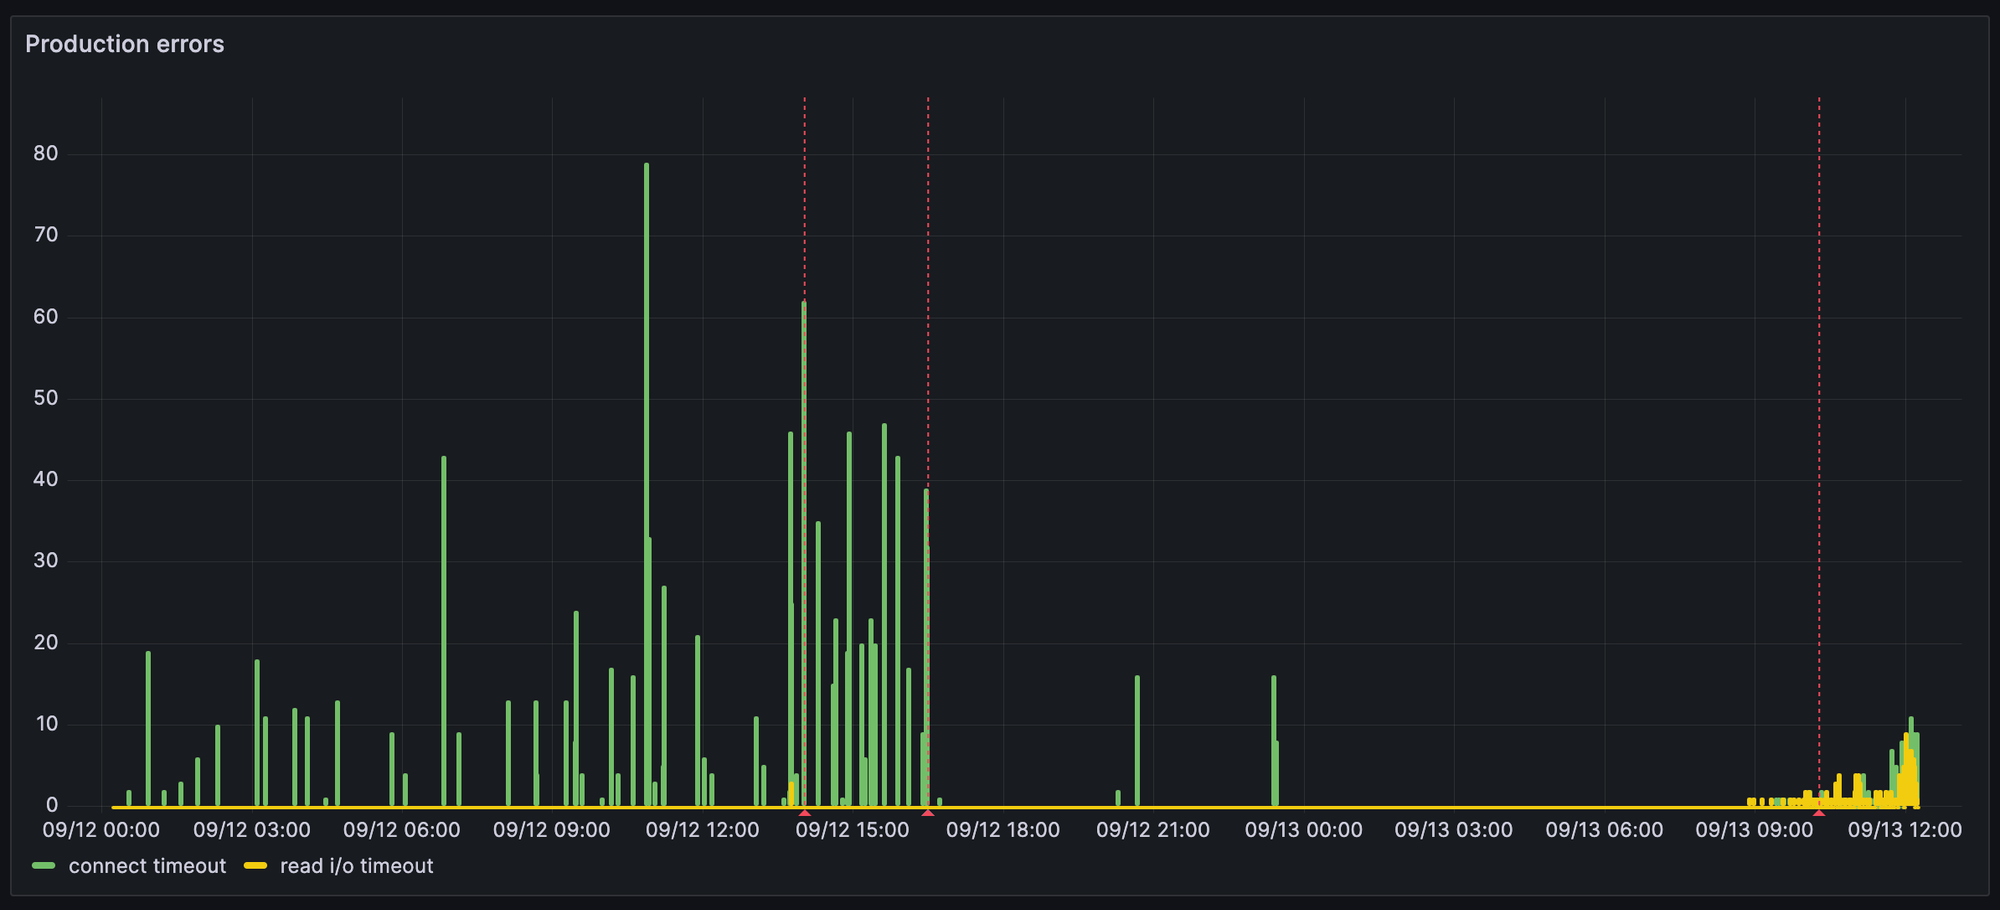
The first blue line is when we made that switch, and you’ll notice it didn’t really seem to make much difference:
That second blue line though, that looks extremely promising. What happened there? Well…
Meanwhile, a few desks away
While all this had been going on, another unrelated issue had cropped up. Thanks to an accidental database join, we’d been making thousands of duplicate network calls to an external third party. Not the end of the world, but not ideal, either.
Guess when the fix for that got merged? You got it—the second blue line in the image above marks when that fix landed in production, and all the database connection and cache issues pretty much disappeared.
This suggested that it was highly likely that there weren’t any fundamental issues with GKE or GCP networking. We therefore figured it was more likely that we'd got ourselves into a really bad place by trying to do so many network calls in parallel as a result of the bad query.
The frustrating question, though, was why? Why would doing lots of external network calls unrelated to our database or our cache lead to an increase in Postgres and Memcache connection and request timeouts!?
This could take a while…
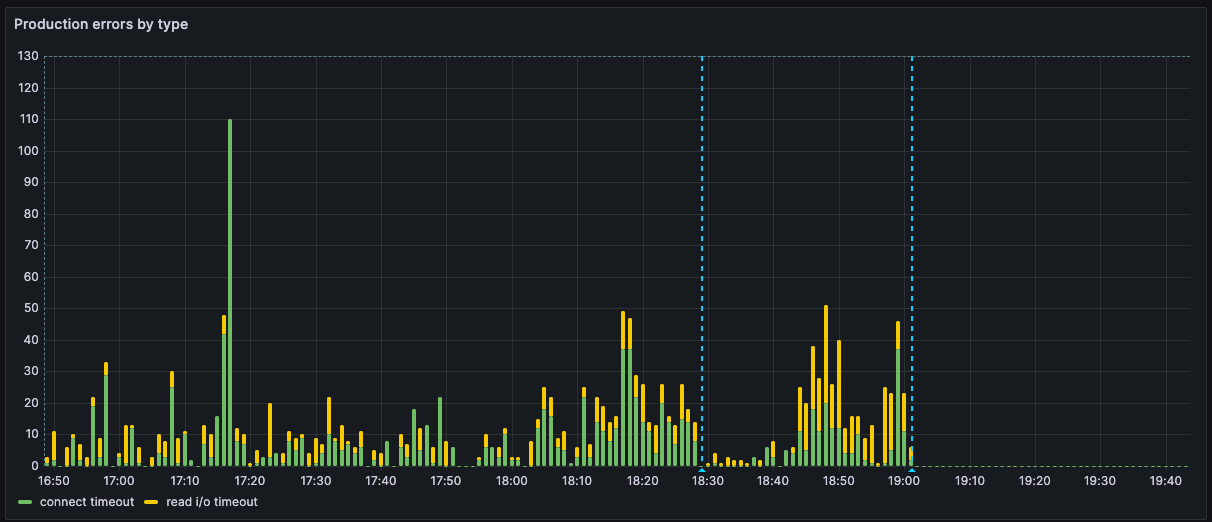
So, although the database seemed OK now, the cache errors still hadn’t gone away entirely, so we dug deeper.
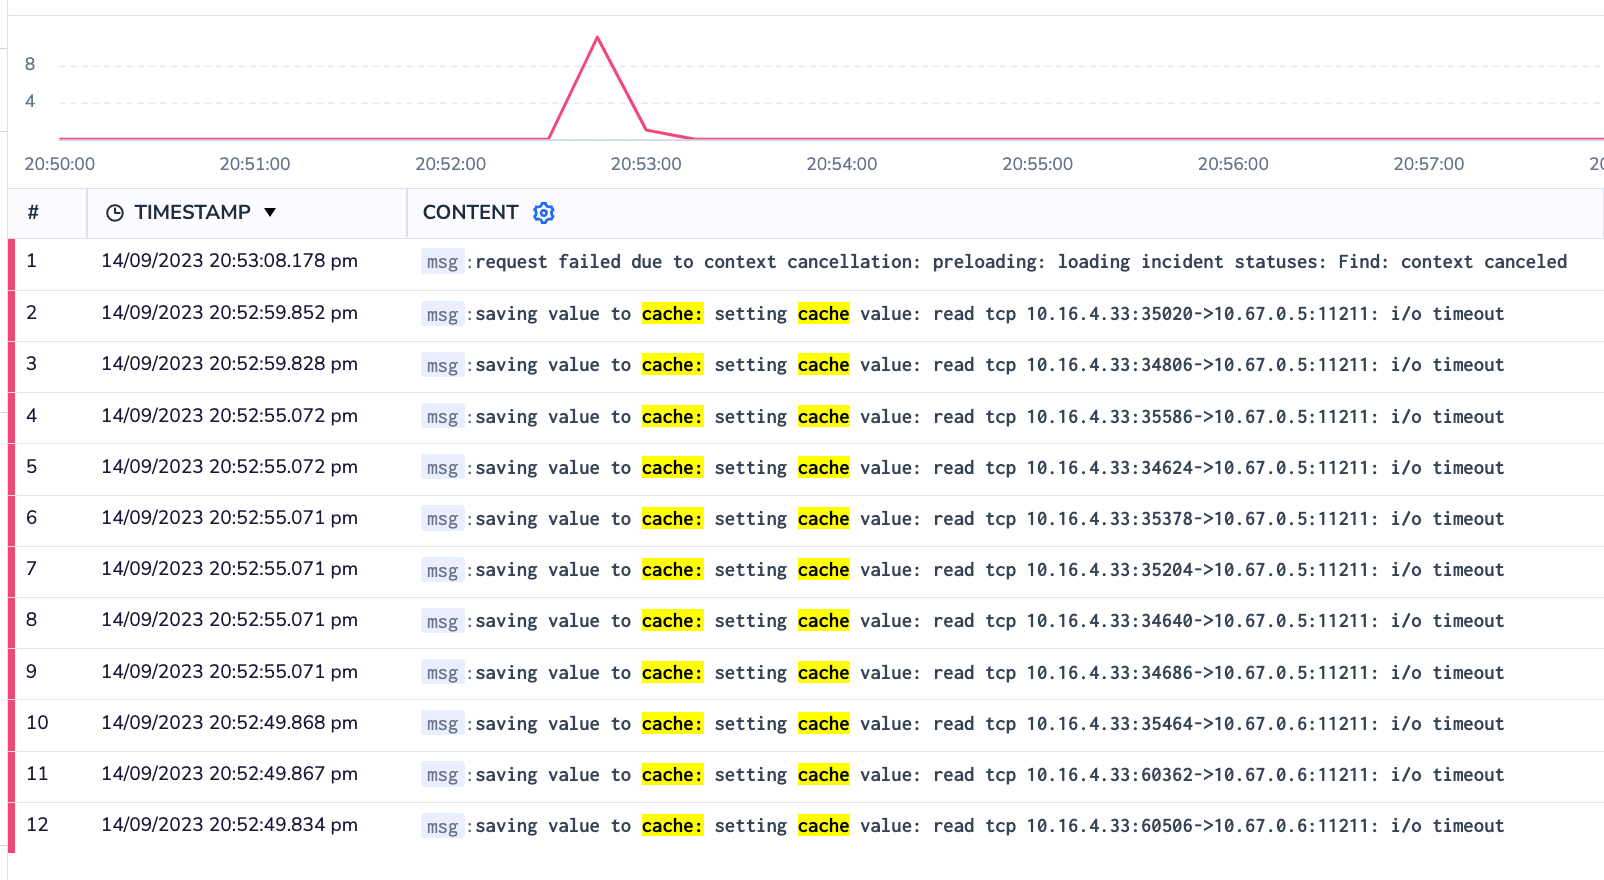
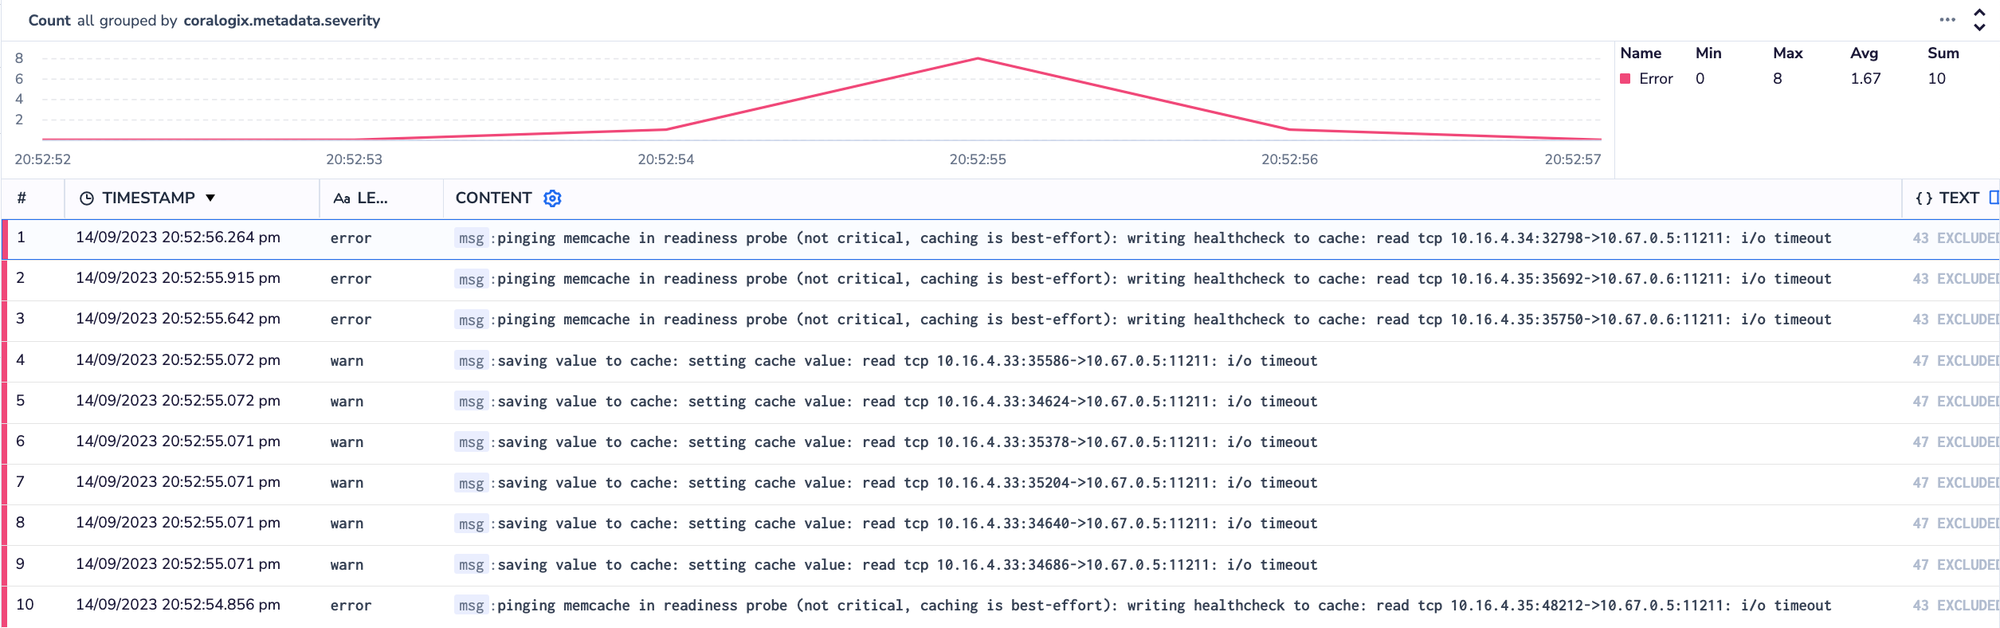
The error itself was pretty straightforward. The app was occasionally experiencing timeouts while setting a value in our cache.
saving value to cache: setting cache value: read tcp 10.16.4.33:35586->10.67.0.5:11211: i/o timeoutIt was specifically hitting this most frequently when caching the list of timeline events for an incident (a record of all the things that happened, from messages to status page updates to code changes). This list includes data from a number of sources and is hit pretty frequently, so we cache it, to ensure users always get a speedy response.
This was only happening for a tiny handful of requests among hundreds of thousands, with seemingly no other consistent pattern when it came to which users, organizations, nodes, or requests it was affecting.
At this point, having made several improvements based on hunches, we still didn’t fully and confidently understand what was happening, let alone what we needed to do to eradicate the last few remaining errors.
We were left scratching our heads and decided to pause for the evening.
As Lawrence very astutely put it at the time:

Unless…
The next day, we took a closer look at the logs for the Kubernetes node which had handled one of the affected requests. We could clearly see multiple cache failures happen during this request, all due to cache timeouts.
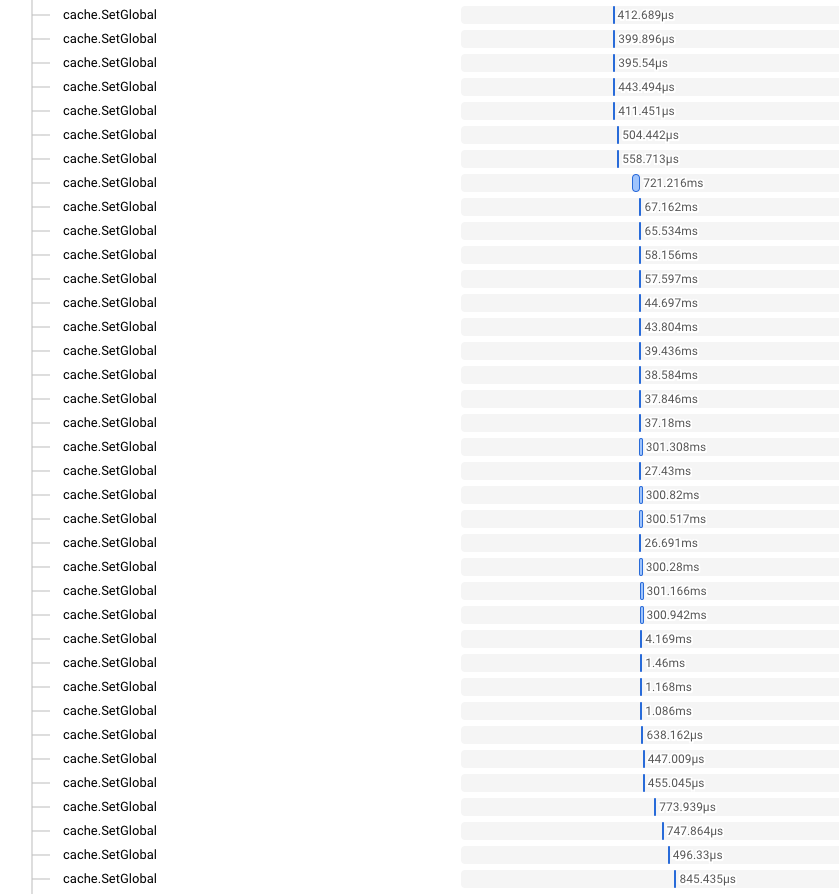
Taking a look at the trace for the request, we could see something pretty interesting. There were a few hundred cache set operations happening, seemingly simultaneously, for one request. There were also a ton of calls to generate URLs for objects in Google Cloud Storage at the same time.
These both make sense—when displaying a timeline, we pull in all the data we need, caching it as we do. For many items, there are also images or attachments we need to fetch. For longer timelines, each page of data is still substantial, so a few hundred items (and therefore a few hundred calls) isn’t all that surprising.
There are two things that are interesting here, though:
- All these calls to update the cache happen abruptly and concurrently.
- The duration of the calls starts at around ~1 ms or less, but as time goes on, they increase by a few orders of magnitude and get significantly more variable.
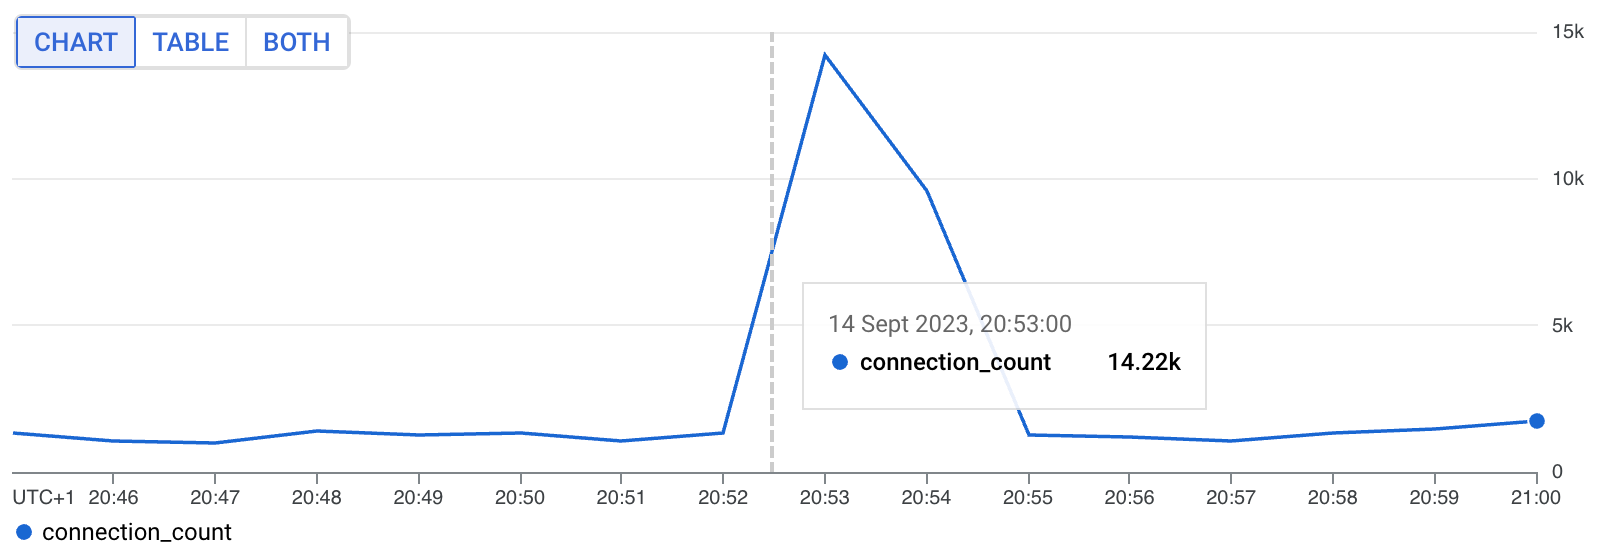
Looking at the node metrics, we also see a pretty big spike in the number of new connections being opened.
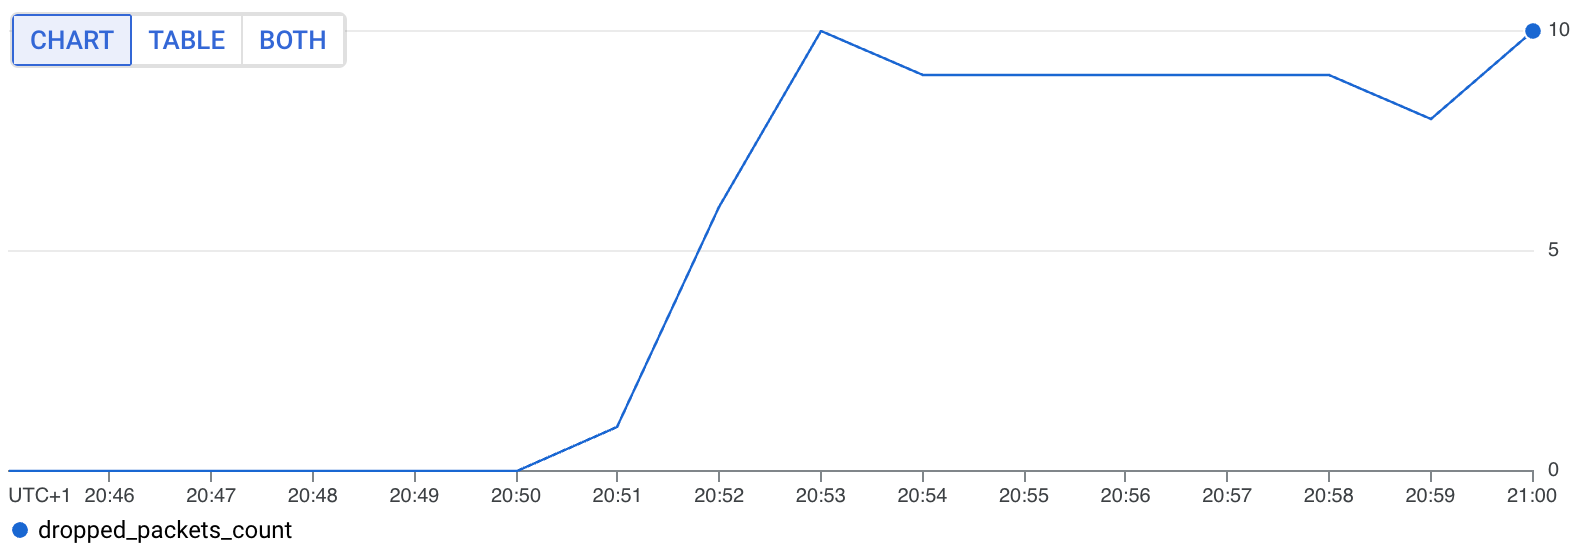
At the same time, we also see an increase in dropped packets on that node.
Looking at the logs for the node more broadly during this window, we can also see that there were even failed health checks because it couldn’t reach the cache (a totally separate request). Something’s definitely up!
OK, so what’s actually going on?
This revelation suggests that this isn't a process-local issue. What we mean by this is the fact that we were having network issues between our Kubernetes node and the cache is not necessarily related to something like having loads of goroutines trying to write to the cache at once (at least not directly); it's something affecting the node (VM instance) as a whole.
This didn’t make a lot of sense at first. We’ve got a super simple GKE setup, and we haven’t seen this type of behavior in similar clusters that we’ve worked with in the past. The only relevant configurable behavior on a cluster like this was that we had Dataplane V2 turned on
Still, at this point, even that deserved scrutiny and so we set about scouring the docs. Shortly after, we spotted what looked very much like a smoking gun:
In certain cases, GKE Dataplane V2 agent Pods (anetd) can consume a significant amount of CPU resources, up to two or three vCPUs per instance. This occurs when there's a high volume of TCP connections being opened and closed rapidly on the node. To mitigate this problem, we recommend implementing keep-alives for HTTP calls and connection pooling for the relevant workloads.
Now we had a workload (anetd) to look at, we looked at the logs but sadly there was nothing obvious there. We did see a decent jump in CPU, though:
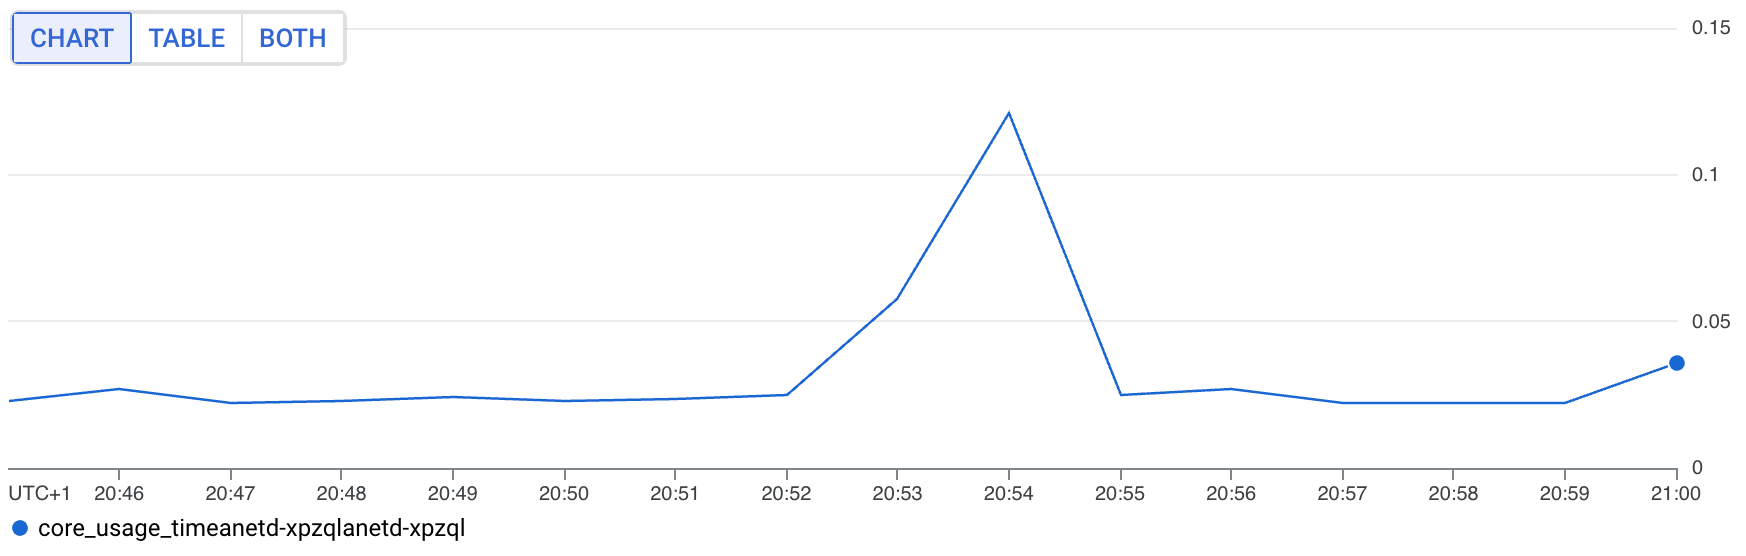
When you consider that this is not a consistent issue, and the fact that these metrics are counters, so will be smoothed out by the window function, it's very possible, even likely, that for a couple of seconds the anetd pod was indeed really busy.
If you think about it, it all starts to line up pretty much perfectly with what we’d seen and done up until this point:
- We mostly fixed the DB timeouts by fixing our connection pooling, so that it wasn't opening hundreds of connections per second.
- We mostly fixed the cache timeouts by increasing the connection pool size from 2 to 20; therefore massively reducing the number of new connections which need to be opened.
- The runaway query incident made things worse by spawning thousands of goroutines, which opened connections to fetch data from external providers.
- Regardless of our mitigations, the problem persisted. Specifically when making lots of external requests in parallel. Less frequent, but not eliminated.
Why not just turn off Dataplane at this point?
We did consider turning off Dataplane V2. However, this wasn’t an appealing option for a few reasons:
- It would just be patching over an issue that we were triggering, and can likely fix ourselves quickly and now, with relatively little effort.
- It's not a simple switch to flick. We’d have to create a new cluster and move workloads into that. We could do this in a zero-downtime fashion, but it's still non-trivial and we have other fish to fry!
- It’s likely that Dataplane V2 becomes a non-optional default for Autopilot clusters in the future. We’d also like to be able to take advantage of some of the benefits, like putting strict network policies in place.
What did we learn?
So many things, but a few key takeaways for us included:
- Remember to not focus your hypotheses too quickly. Whenever we spot network timeouts like this, we should remember to look at overall system activity (not necessarily the same pod, but anything running on the same node). Often errors and their impact are limited to a single request, but not always. It’s something we’ve actually written about before but always good to have a reminder!
- Limit outbound network concurrency. We need to be more careful going forward with ensuring more sensible concurrency limits for outbound network calls. Previously our primary constraint was provider rate limits, but there are times where we can be within rate limits but still impact a node, if we’re not careful.
Hopefully you enjoyed following us down the rabbit hole on this one and although these bugs are always a little frustrating it’s always nice to get to the bottom of them and share what we learned.
Also, if you have expertise in GCP, Kubernetes and building strong infrastructure foundations for fast moving product teams, we’re actively looking to hire our first few Platform Engineers to focus on this kind of challenge full time. Check out the job posting here.

Ben Wheatley
Site Reliability Engineer
See related articles

We rebuilt our post-mortems from the ground up
Today we're launching our new post-mortems experience, and I want to walk you through what we've done and why.
 Pete Hamilton
March 17, 2026

Bloom filters: the niche trick behind a 16× faster API
This post is a deep dive into how we improved the P95 latency of an API endpoint from 5s to 0.3s using a niche little computer science trick called a bloom filter.
 Mike Fisher
November 14, 2025

My first three months at incident.io
Hear from Edd - one of our recent joiners in the On-Call team - how have they found their first three months and what's it been like working here.
 Edd Sowden
September 1, 2025
So good, you’ll break things on purpose
Ready for modern incident management? Book a call with one of our experts today.
We’d love to talk to you about
- All-in-one incident management
- Our unmatched speed of deployment
- Why we’re loved by users and easily adopted
- How we work for the whole organization


