New: AI-native post-mortems are here! Get a data-rich draft in minutes.
How we page ourselves if incident.io goes down

Picture this: your alerting system needs to tell you it's broken.
Sounds like a paradox, right? Yet that’s exactly the situation we face as an incident management company. We believe strongly in using our own products - after all, if we don’t trust ourselves to be there when it matters most, why should the thousands of engineers who rely on us every day?
However, this poses an obvious challenge. The moment we need our own product most – when incident.io itself is having an incident – is when it’s least likely to be working. So, what do you do?
Every serious infrastructure, alerting, and observability provider wrestles with this challenge and it's something we get asked by customers regularly, so in this post, I'll go through exactly how we've thought about it.
We ended up building what amounts to a dead man's switch for our on-call system, to ensure we can use our product as much as possible, while never missing a page.
We’ve never needed to lean on this as a result of our own systems going down, but we take our responsibilities seriously. It’s important to know we have a plan, even in a worst-case scenario.
But first, let's talk more about what we'd actually be getting paged for…
Daily operations
Let me show you an example of what it looks like here when our incident response process goes smoothly.
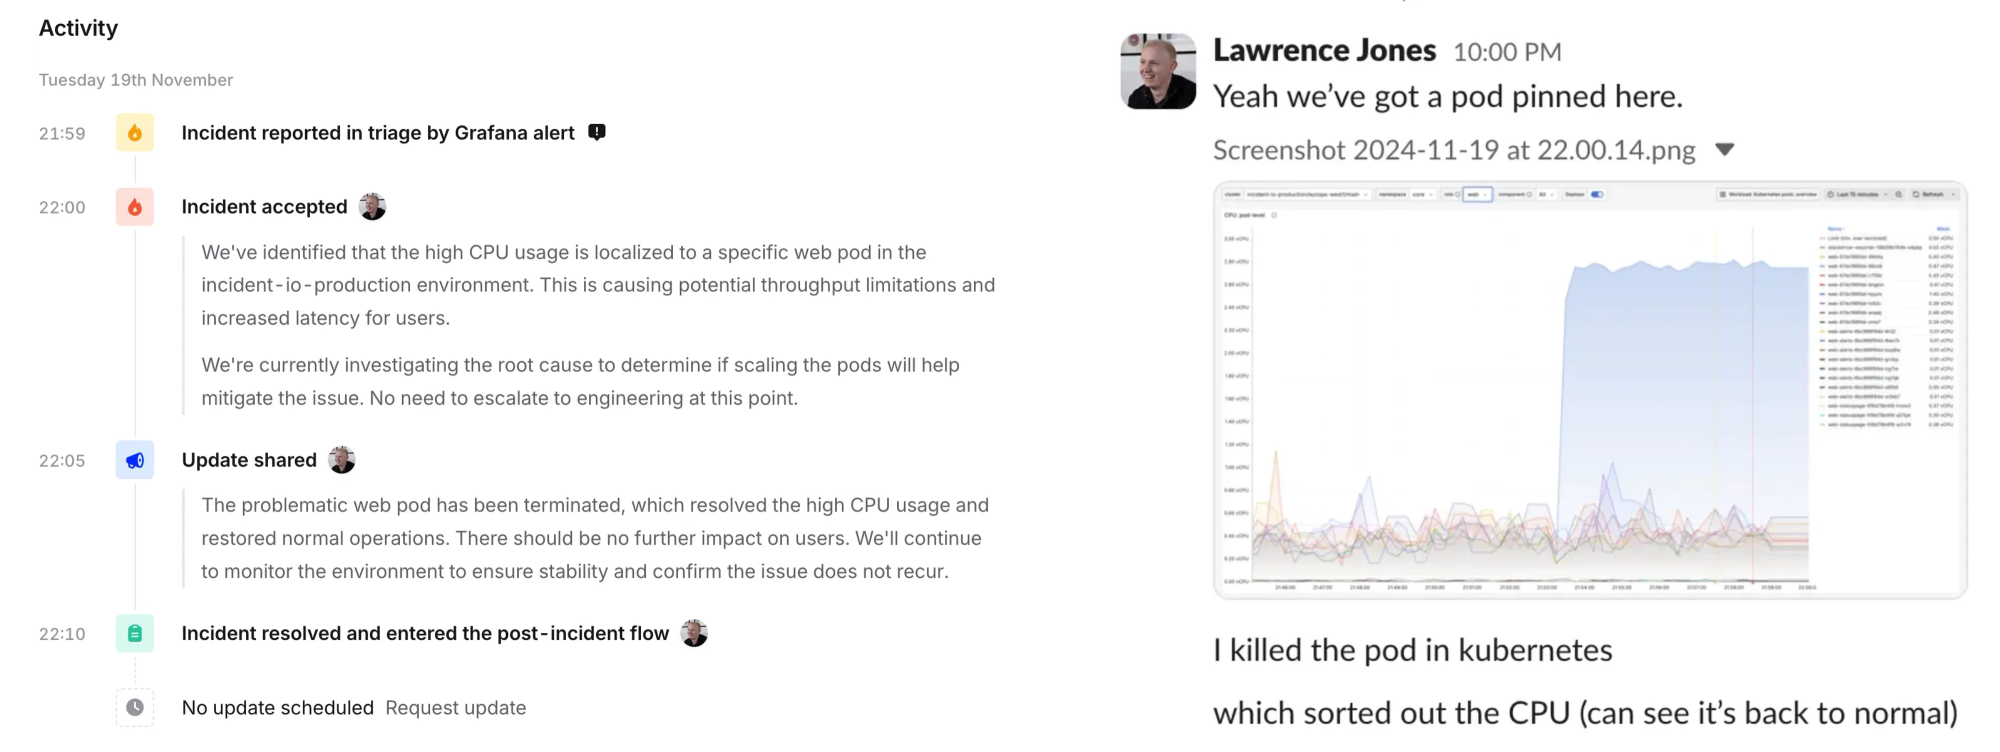
Last week at 21:59, one of our Grafana alerts fired because it detected high CPU usage in our production environment. Within seconds, our system processed the alert and paged me (I was on-call last week) through the incident.io mobile app.
This looked like:
21:59:11- Grafana alert detects high CPU usage, triggers an incident21:59:12- Our alerting platform pages me, my phone rings21:59:31- I acknowledge the page22:00:13- I jump into the incident channel, and confirm high CPU on one of our pods22:02:18- I terminate the high CPU pod (mitigating impact)22:10:33- I wrap up, share an update, and close the incident
The whole thing took about 10 minutes from start to finish. We identified a web pod that was consuming excessive CPU, terminated it (Kubernetes started a fresh one for us), and confirmed the metrics had returned to normal. Pretty standard stuff.
This is how it looks in our system:

What's interesting here isn't the incident itself - these kinds of small operational blips happen to every service - but rather how the alerting flow worked. Let's break it down:
- Grafana spots something wrong and sends an alert to incident.io
- Our system processes the alert and triggers the appropriate escalation path
- The on-call engineer (me, in this case) gets a high-urgency notification
- We jump into a dedicated incident channel to debug and resolve
This is the "happy path" - our alerting system doing exactly what it's designed to do. But here's where it gets interesting: what happens if the thing that breaks is incident.io itself?
When things go wrong
During one of our recent game days (yes, we regularly break our systems on purpose), we simulated exactly this scenario.
We’ve built our systems for substantial scale and burst scenarios, so we flooded our alert ingestion pipeline with over 100x of our normal load to stress the system. Soon enough, our internal alerts started firing:
🚨 Alert route HandleEvent worker nearing capacity (>75%)
We're using >75% of the worker capacity for processing alert events in the alertroute package.
At this point, if we kept up the test, we'd hit capacity and alerts would start backing up in the queue.
"So what?" you might ask. Well, remember that these alerts trigger pages, and pages notify engineers. If alerts are delayed, then pages are delayed and when your systems are down, every second counts.
This is the uncomfortable reality of building an incident response product: the moment you most need to notify your own engineers is exactly when your notification system might be struggling.
We've invested heavily in observability and tools like our smoke testing framework to catch these situations early, but ultimately, no matter how reliable you believe your system is, you still need a plan for when it degrades substantially or fails outright.
What we need is something called a…
Dead man’s switch
There’s a morbid term that’s found it’s way (perhaps regrettably) into software engineering:
A dead man's switch (DMS) is a switch that is designed to be activated or deactivated if the human operator becomes incapacitated, such as through death, loss of consciousness, or being bodily removed from control.
It’s a bit dramatic, but the analogy transfers quite well to how you solve the same problems in systems design. We use a DMS to build safeguards that trigger automatically when a primary system fails to check-in.
It's exactly what we need: a backup system where external providers page our engineers if, for any reason, our primary paging system fails to do so.
Here's how we implemented it:
- Every alert we receive gets sent to both incident.io and a backup provider (applying a 1 minute delay)
- When our system successfully pages someone (and they acknowledge it), we automatically acknowledge the corresponding backup alert
- If our system fails to page someone within 1 minute, or they don't acknowledge it in time, the backup alert pages us
When an engineer acknowledges a page in our system, here's a simplified outline of how we prevent the backup system from paging us unnecessarily:
def acknowledge(escalation):
    # Only ack backup escalations if the escalation has been acknowledged in our system.
    if not escalation.is_acknowledged():
        return

    # Find the alert that triggered the escalation.
    alert = find_alert(escalation.alert_id)

    # Sometimes we'll acknowledge alerts quickly, and find that
    # backup systems haven't yet processed the alert yet.
    #
    # It's important we ack the backup alerts, to avoid getting
    # paged twice, so we give them a 10 - 15s grace period.
    for attempt in range(10):
        if alert.has_backup_alerts():
            break
        sleep(1)

    # Ok, all our backup alerts have been created, ack them
    # so they don't page us!
    for backup_alert in alert.backup_alerts():
        ack_in_backup_system(backup_alert)
This creates a simple dead man's switch: backup providers will only page us if we fail to successfully notify an engineer through our own alerting platform.
Luckily, we’ve never needed it as a result of our systems going down, but very occasionally someone will fails to ack a page within 60s, which results in regular testing of this approach. It doesn’t happen often, but as with all backup systems, it’s good to know it’s working should we need it in a worst case scenario.
When you really, really can't afford to miss a page
There's something delightfully absurd about dogfooding your product when it’s worst moments will coincide with your greatest need of it. But when you're an incident response company, that's exactly what you should be doing.
We've invested heavily in making incident.io reliable and we've got redundancy built into every level of our stack, comprehensive monitoring, and a battle-tested on-call system.
However, if we're doing right by our customers, we have to assume we've missed something, that unexpected events can and will happen, and plan accordingly. When customers depend on you to help them manage their worst days, you can't just say "oh, it'll be fine"!
We have an entirely separate backup system and we test it with every single alert we receive for our own alerting platform. If you don’t use incident.io yet, hopefully whoever you rely on does this too — if not, that’s probably an important and interesting conversation worth having!
This might all seem like overkill, but we think it’s important and helps us (and you) sleep better at night (well, until we get paged, anyway…).
This post is part of our Building On-call series, where we share the challenges and solutions we've found while building our on-call product. If you're interested in more behind-the-scenes looks at how we handle these challenges, do check out the rest of the series!

More from Behind-the-scenes building On-call

Behind the scenes: Launching On-call
We like to ship it then shout about it, all the time. Building On-call was different.
 Henry Course
Building On-call: Our observability strategy
Our customers count on us to sound the alarm when their systems go sideways—so keeping our on-call service up and running isn’t just important; it’s non-negotiable. To nail the reliability our customers need, we lean on some serious observability (or as the cool kids say, o11y) to keep things running smoothly.
 Martha Lambert
Building On-call: The complexity of phone networks
Making a phone call is easy...right? It's time to re-examine the things you thought were true about phone calls and SMS.
 Leo Sjöberg
So good, you’ll break things on purpose
Ready for modern incident management? Book a call with one of our experts today.

We’d love to talk to you about
- All-in-one incident management
- Our unmatched speed of deployment
- Why we’re loved by users and easily adopted
- How we work for the whole organization


