Pager load
On-call rotas are disruptive, and it's important to minimise disruption where possible. This guide talks a lot about healthy on-call culture – shift swapping, compensating appropriately, etc – but when you're managing a team, it can be difficult to know when on-call has become painful.
By tracking frequency of pages and contextualising those pages for the type of disruption they caused the person, you can catch increases in pager load before they become harmful, and take proactive action to ease the pressure.
Last 30 days
If you're responsible for a team and want to understand on-call pressure, you can start by visualising pager load from the last 30 days.
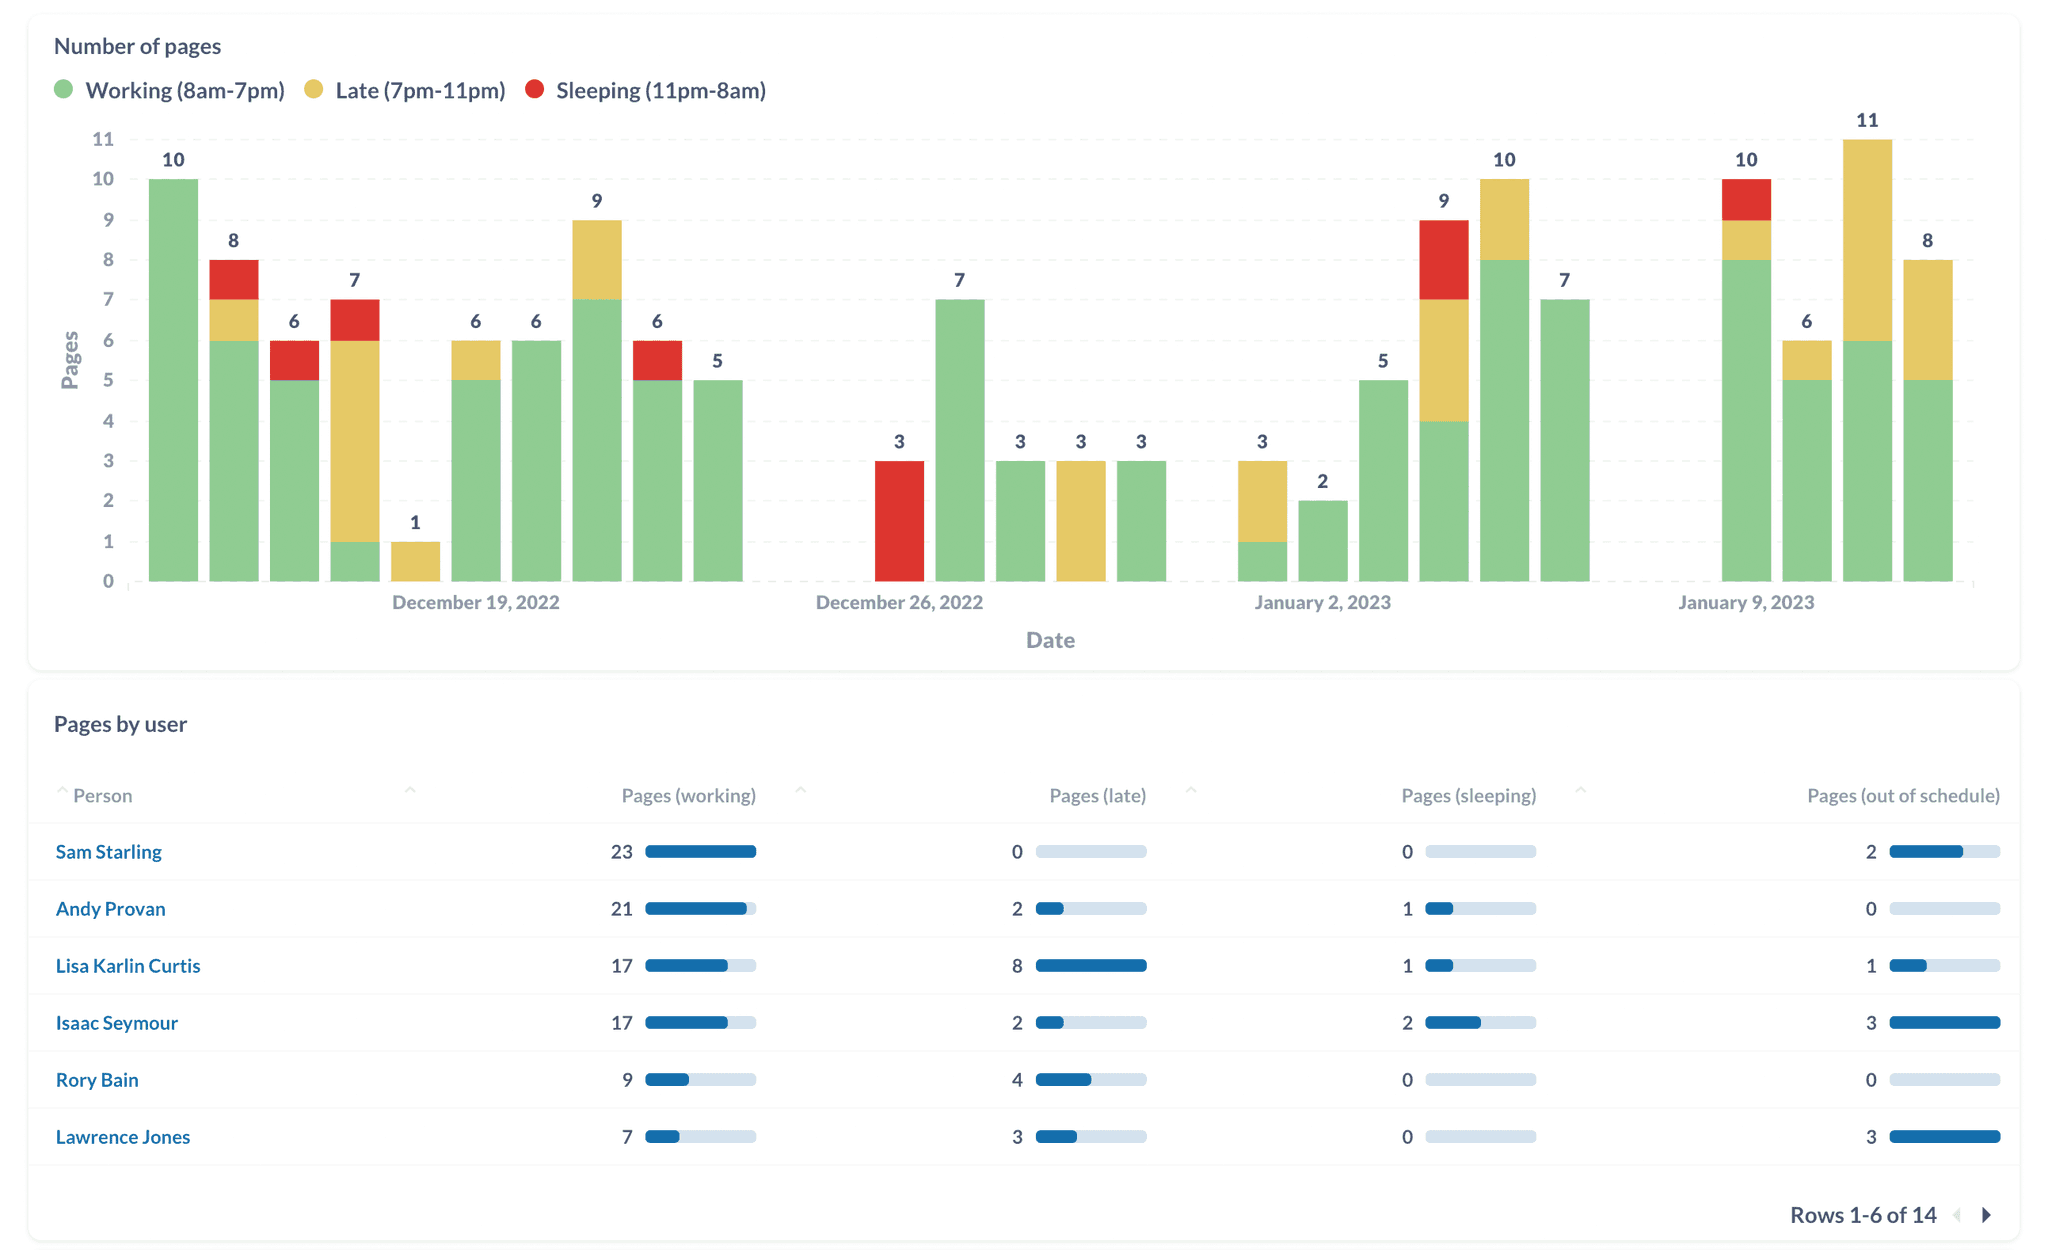
Here's what that looks like for the incident.io team:

First thing to note is that pages are categorised by when they occurred in the recipients timezone. That's because not all pages are equal: being woken at 2am is very different to an in-working-hours 10am page when you're already in the office.
With that in mind, we're looking for spikes of late or sleeping pages to help catch if an individual has been significantly disrupted. In the example graph, we can see:
- December 26th, with 3 pages all during sleeping hours (11pm-8am) which were received by a single person.
- January 4th and 5th saw high numbers of late and sleeping pages, which is concerning as consecutive days should be considered worse than independent events.
For December 26th, the team proactively assigned cover for Alex when they arrived in the morning, having caught that he'd been paged several times in the night.
Filter for individuals
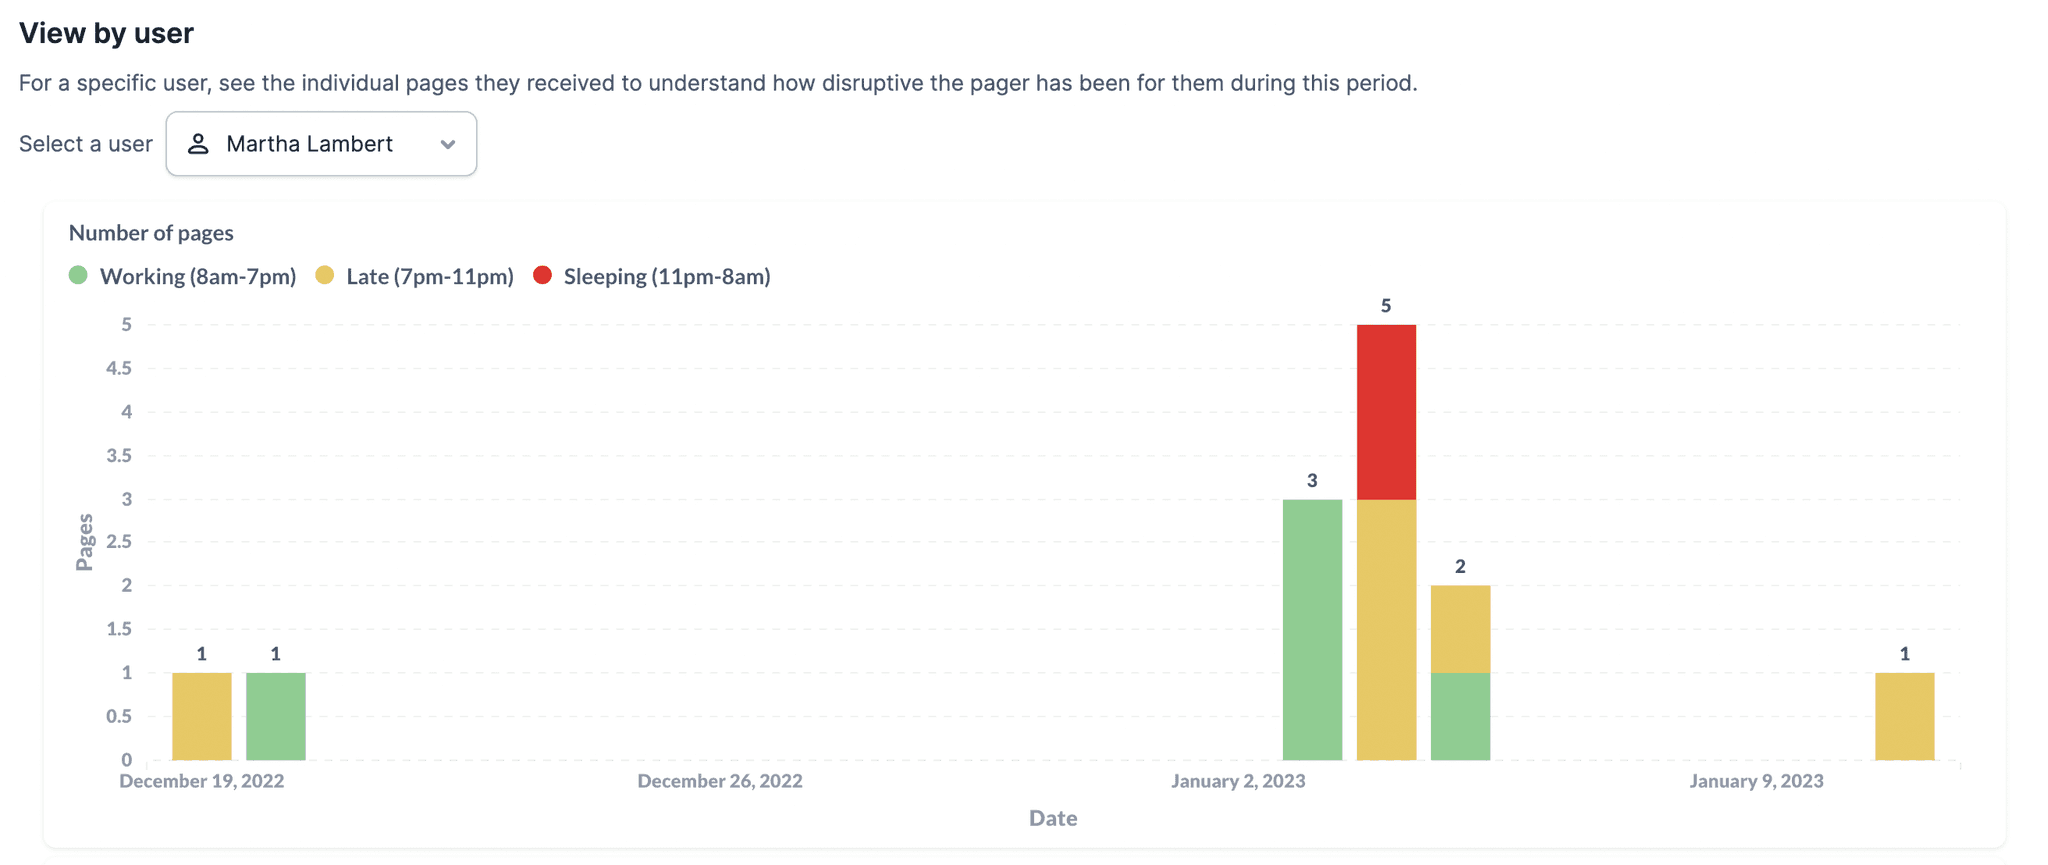
Looking at January 4th and 5th, Martha was on the pager. We can apply a filter to see only Martha's pager volume, which helps understand patterns for the individual:

As we did for Alex, the team proactively covered Martha after the successive days of unsociable pages. But as a manager, you'd want to check-in to ensure Martha had taken time to recover. Additionally, knowing the level of disruption can help explain why a project is delayed, or other impacts on normal business.