What does good incident management look like?
Metrics beyond MTTx: Measuring the quality of your incident management processes
Introduction
Metrics like Mean Time to Detect, Acknowledge, and Recover (often grouped as “MTTx” metrics), along with uptime, are widely used to assess incident management performance. These metrics are popular because they’re well known, easy to calculate, and intuitive: if my MTTx goes up, that’s bad; if it goes down, that’s good.
But MTTx metrics can be misleading, especially when used in isolation to evaluate overall incident management performance. Definitions of “fixed” or “resolved” vary both within and across organizations, making MTTx metrics difficult to compare. Additionally, their detachment from the broader incident response process makes it hard for them to reflect how effectively an organization manages and learns from incidents.
Measuring quality, not just time
If the answer isn’t MTTx, it begs the question: what does “good” incident management look like? What metrics can help us track the quality of our incident management processes? And how do these metrics vary across different company sizes?
We need metrics that are actionable — ones that define what "good" looks like and highlight areas for improvement. However, many organizations fall short here. In our recent survey, nearly half of respondents reported that their incident management metrics are calculated and reviewed, but no actions are taken based on them.
Defining what “good” looks like
We’ve analyzed over 100,000 incidents — from Fortune 500 enterprises with thousands of employees to 10-person startups — and identified a set of industry benchmark metrics.
These metrics are:
- Measurable: Easy to track using your existing incident management processes.
- Comparable: Benchmarked by organization size for fair, like-for-like comparisons.
- Quality indicators: Going beyond speed, offering benchmarks to see how you stack up against peers.
While it’s impossible to capture the perfect numbers for every organization and context, these benchmarks are designed to be directionally accurate and help guide you in the right direction.
We’ve intentionally used the term “good” to describe these benchmarks — this is based on our hands-on experience with building an incident management product (and dealing with incidents ourselves!). We recognize the inherent subjectivity but believe these benchmarks offer practical value regardless.
Our incident benchmarks
We’ve grouped our benchmarks by each stage of the incident lifecycle, with recommendations on how to improve for each:
- Alerting & on-call
- Incident response
- External communications
- Post-incident
Our methodology
We’ve grouped (most) benchmarks in this report into 1 of 3 buckets based on customer size: <250, 250-999, and 1,000+ employees. We’ve done this to show the trends based on company size, and to provide you with a relevant peer group to benchmark yourself against.
Within each bucket, we take the median of the per-customer metrics across all customers in that bucket, as it’s the easiest way for you to benchmark yourself against your peer group.
But what about calculating per-customer metrics? While some — like the percentage of escalations occurring outside working hours — don’t rely on averages, most do.
The mean is useful for capturing skew, but it’s highly susceptible to outliers — making it less useful for understanding typical performance. This is especially relevant for behavioral metrics (like most in this report), as human behavior naturally includes outliers.
Take the following benchmark metric: "How often are updates being shared in incidents?". If measured, for major & critical incidents, using:
- Median: the 25th, 50th, and 75th percentiles are every 20, 30, and 100 minutes.
- Mean: the 25th, 50th, and 75th percentiles are every 60, 310, and 1200 minutes.
We recommend aiming for internal updates every 15–20 minutes, but the mean won’t tell you whether you’re consistently achieving this—it only highlights how extreme your outliers are.
That doesn’t mean you should ignore outliers—far from it. But for benchmarking, the median is more useful. A helpful exercise is tracking the 90th/95th percentile alongside the median to see if the gap between them is growing or shrinking over time.
As a result, for any per-customer benchmarks in this report where we take an average (e.g. average time to mobilize) we take the median.
Alerts & on-call
1.1 Time to mobilize
Why is it important?
Historically, organizations have tracked measures like mean time to acknowledge (MTTA). While useful, it doesn't do a good job of highlighting how long it takes responders to actually get to their laptop, log in to Slack/Teams, and be in a position to start dealing with the issue.
Median time to mobilize, or MTTM, is a measure that more accurately captures the ‘lag time’ of starting your incident processes. It measures the time between an alert firing and the first human message being sent in a Slack/Teams incident channel, rather than just the time between the alert and someone acknowledging a page.
What does “good” look like?
On average there is a 4-5 minute delay between the first alert of an incident firing and first message being sent by a human in Slack or Teams.
How you perform against this metric will vary based on SLAs you have defined, the timezones you operate in, and a number of other factors. We’d suggest using it to understand your organizational dynamics and as an input to changes, rather than setting any specific targets.
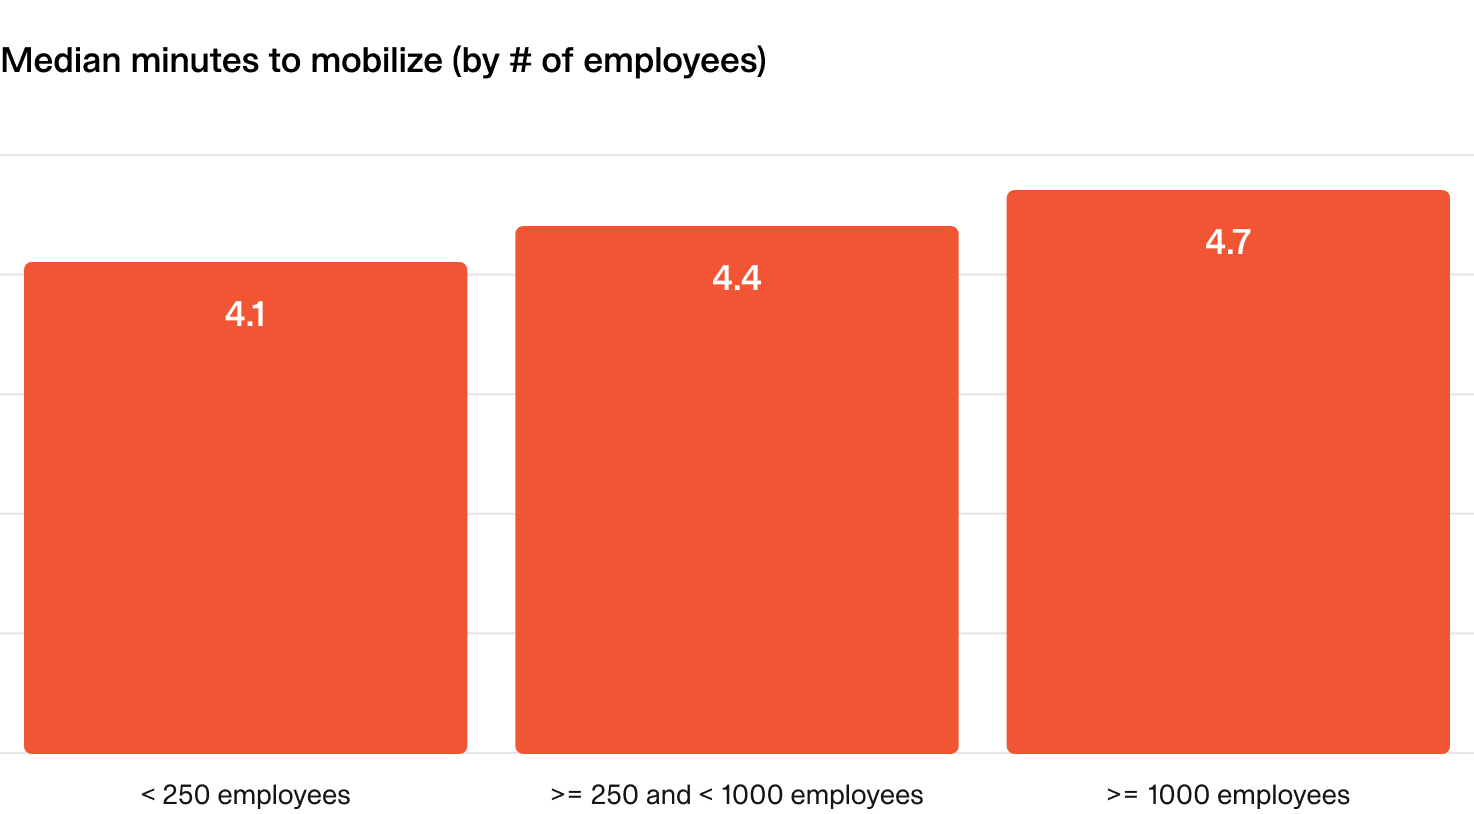
Interestingly, this varies between companies of different sizes, with larger organizations tending to take longer to mobilize on average.
By this definition, incident.io responders mobilize in ~1.5 minutes, meaning there is a ~90s delay between an alert indicating something is broken to a human engaging in the incident response process. Not too shabby!
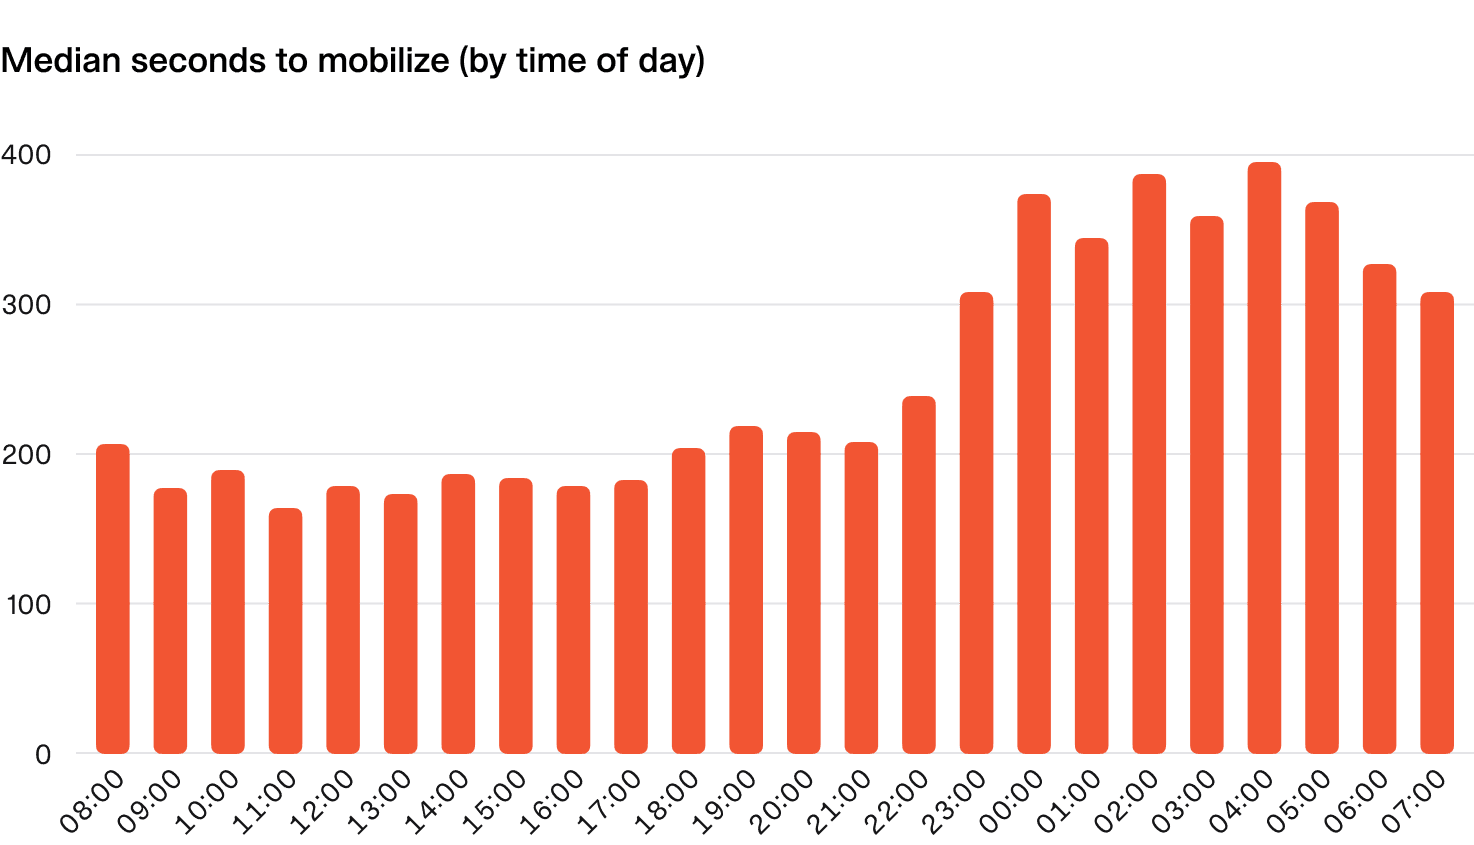
As you might expect, there’s a noticeable difference in the median time to mobilize at different times of the day, with overnight incidents taking nearly twice as long to get the incident response process going in earnest.
How can I improve?
- Communication: It's crucial to ensure the data reflects reality. Since this metric depends on capturing the first message in the incident channel, confirm that people are actually sending it instead of silently jumping into debugging. And if they’re not, making the change isn't just about adjusting behavior to fit a metric—communicating progress is a key part of effective incident management.
- Overrides: Mobilization time can suffer if the person on-call isn't available to respond promptly—whether they’re commuting or out running errands. Encouraging the use of overrides is an easy win. On-call should accommodate life, and overrides make that possible. At incident.io, we use them extensively, thanks to our request cover feature.
- Alert fatigue: A high volume of paging alerts can lead to burnout, fatigue, or outright ignoring alerts. Regularly reviewing the quantity and timing of alerts can help identify if this is happening. There’s no silver bullet, but consistent monitoring signals when it’s time to improve your alerting.
- Align to time zones: Leveraging time zones can significantly improve mobilization time, though it's not always easy for every organization. When first responders are working during their daytime hours, response and mobilization tend to be much faster.
1.2 Escalations outside of working hours
Why is this important?
Unfortunately, you can’t control when things break and when you’re going to get paged.
Having a pulse on how many pages happen outside working hours is helpful for spotting problems that may contribute to poor on-call experiences and burnout.
There are many factors which influence this metric, like how often issues are correlated with change events, or where in the world your customers are compared to your engineering team.
What does “good” look like?
If you notice more than 20% of pages are occurring outside of working hours, you may want to take a closer look at what’s driving the incidents, and whether your teams are managing the load ok.
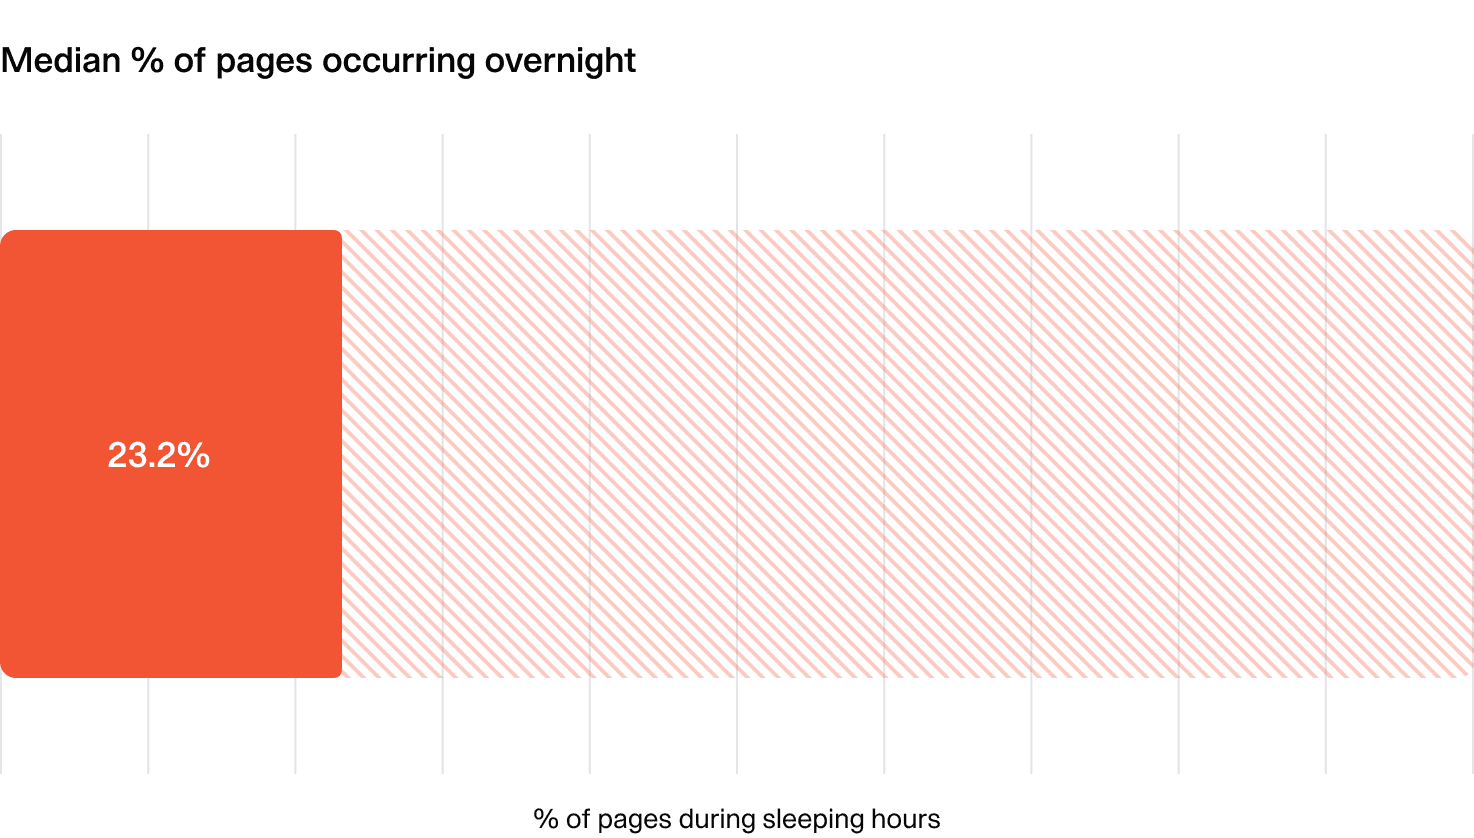
At incident.io, we see approximately 36% of pages happening overnight. Clearly this is higher than the numbers above, but with an engineering team in London, and the majority of our users in the US, and many of our alerts being tied to user actions and errors, this makes sense.
How can I improve?
- Investigate your alerts: There’s no single right answer, but your top priority should be identifying the root causes of alerts and exploring ways to reduce their volume.
- Spread the load: If reducing alert volume isn't feasible and you're facing a high number of out-of-hours pages, focus on distributing the workload more evenly. This could mean adding more responders to the rotation or shortening rotation lengths to keep the load manageable.
1.3 Alerting signal-to-noise
We define “noisy alerts” as alerts that don’t signify something meaningful happening. We can bucket alert noise into two sources:
- Alerts that fire but don’t lead to incidents
- Incidents that are triggered by alerts but are subsequently declined or canceled
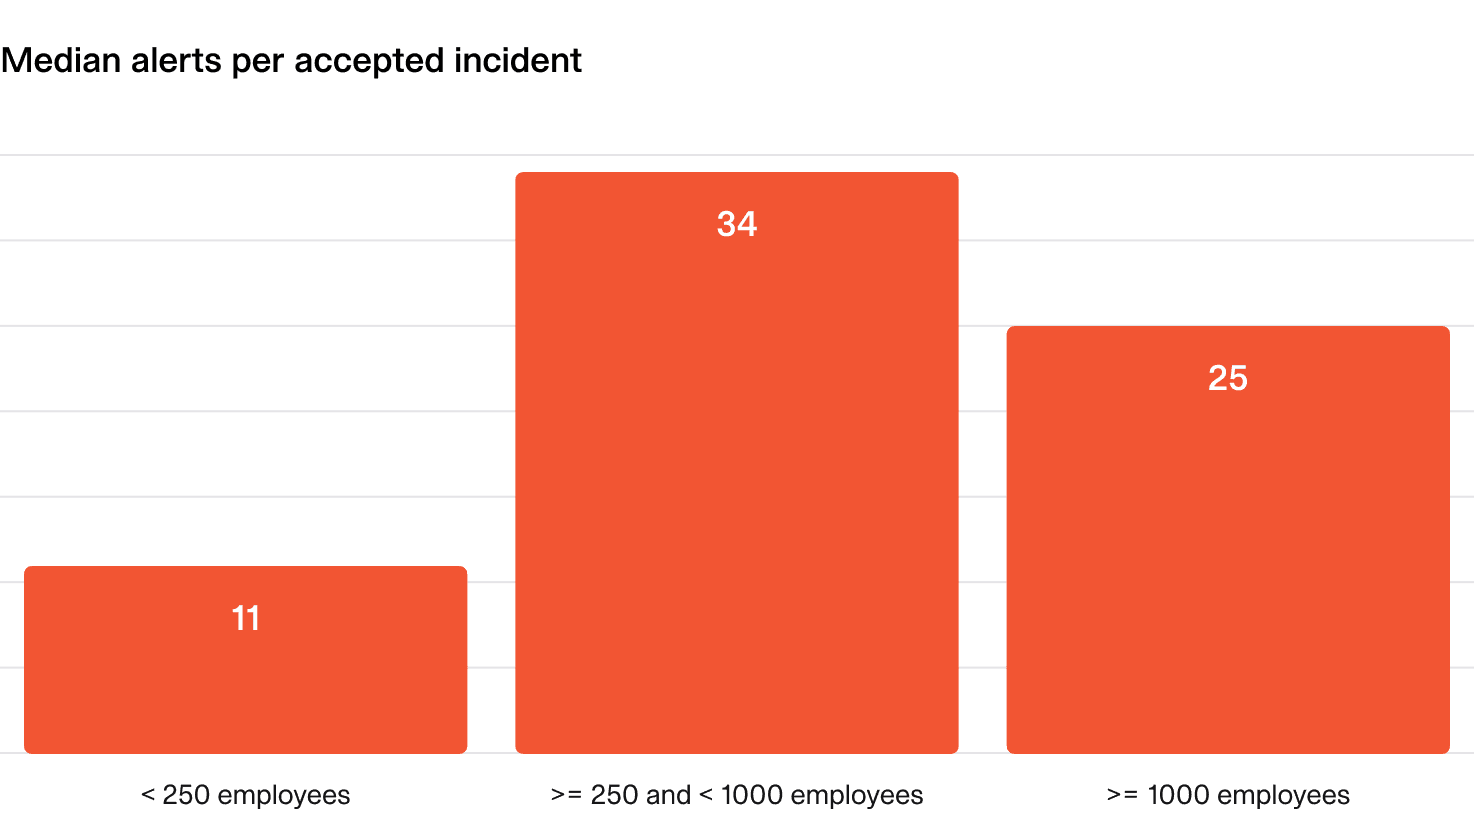
Calculating a single metric here can be challenging, but for simplicity we combine both these stages into one metric: how many alerts fire for each accepted incident?
Why is this important?
False positives can drain your team’s energy and time. Ideally, every alert should signal a real issue worth investigating. In other words:
- If alerts rarely lead to incidents, are they useful at all?
- If incidents are frequently declined or canceled, why are the alerts firing?
What does “good” look like?
In a perfect world, every alert would signal a real incident, and every incident would be covered by an alert — a 1:1 ratio. But in reality, things are messier.
As a rough benchmark:
- Smaller organizations: (<250 employees): 5-10 alerts per accepted incident.
- Larger organizations: 20-40 alerts per accepted incident.
How can I improve?
- Review your alerts: It may seem obvious, but regularly assessing your alerts is key. Start by identifying false alarms and evaluating whether they provide any meaningful signal. If they don’t, they should be considered for discussion and potential removal.
1.4 Escalating escalations
Why is this important?
If escalations are frequently missed by the first responder and continue up the escalation chain, it may indicate inefficiencies such as:
- On-call configuration issues: For example, people setting up email as their notification mechanism rather than a loud push notification.
- The wrong people being contacted first: The first responder is afraid/doesn’t want to answer the page.
- Poor on-call availability: People frequently out of signal/cell service.
Optimizing escalation paths can ensure that:
- Unnecessary escalations are minimized.
- The right people are notified first.
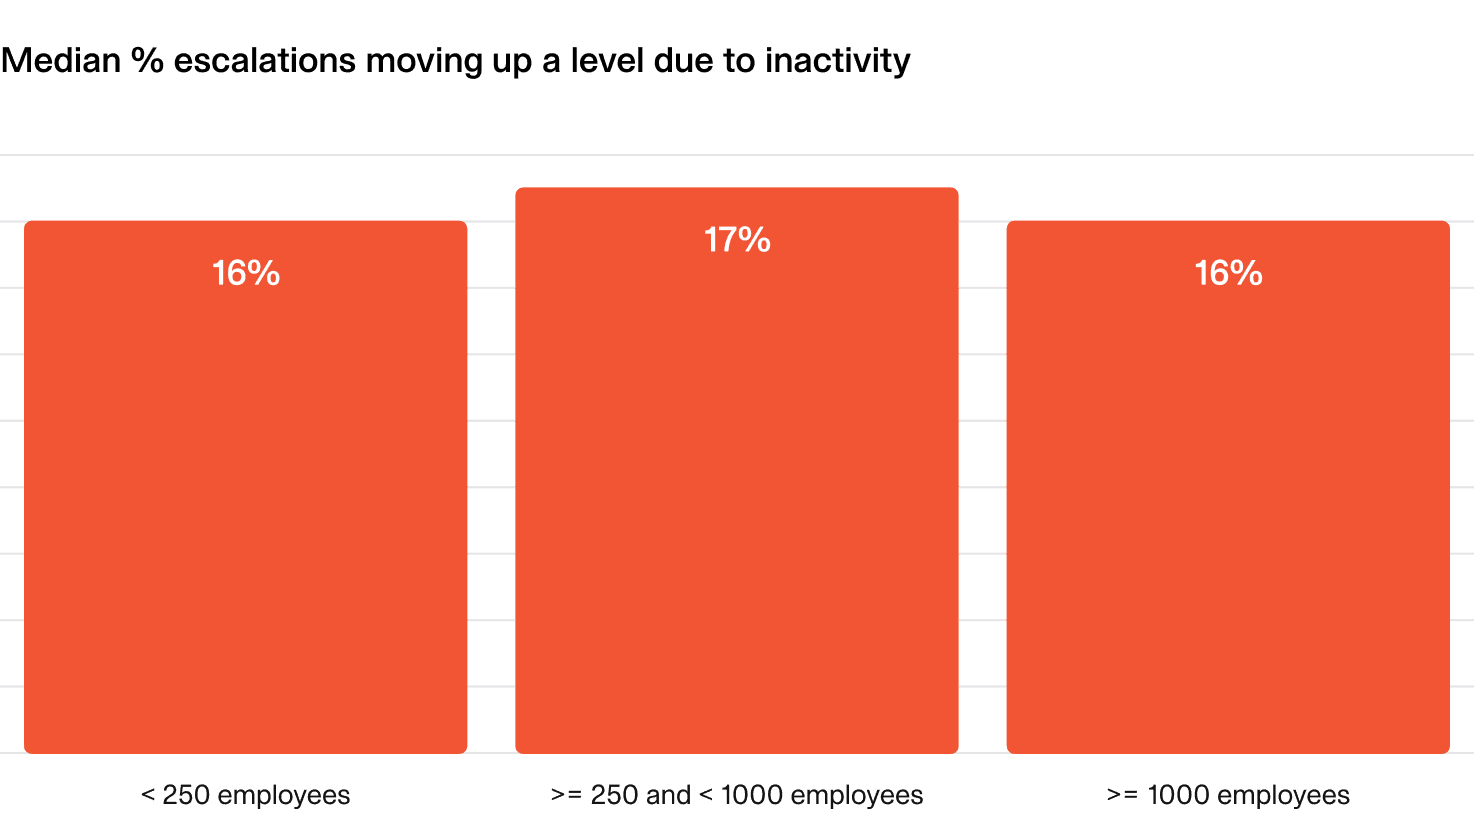
What does “good” look like?
Ideally, all escalations are acknowledged by the person who’s paged and escalations up the chain are an active choice to bring in additional support.
In reality, people will be unavailable some of the time, cell service isn’t perfect, and drift around on-call configuration is a fact of life.
Ideally, fewer than 20% of your escalations should be missed by the first line on-caller.
How can I improve?
- Check notification setups: Ensure all on-callers have the right notification methods in place to avoid missed alerts. If we had a dollar for every missed page being because someone set up email as their only way to get paged!
- Introduce on-call handovers: It's surprising how often alerts are missed simply because someone didn’t realize they were on-call. Regular handovers help on-callers stay informed and prepared. Syncing shifts to personal calendars can also provide helpful reminders.
- Use short-term cover: If pages are missed due to temporary unavailability, encourage on-callers to arrange short-term cover. Whether it's a 30-minute break while commuting or running errands, having an easy way to get cover can be a massive help. Traditional on-call tools haven’t made this simple—but our cover request feature changes that!
Incident response
2.1 Time to triage and to confirm incidents
This metric is a measure of how long it takes to determine if an incident is “real”. It reflects how efficiently your team can respond to, triage and recognize issues, and tracking it can help you identify delays in your incident response.
We count the start time here as the point at which an alert fired, and the end time as the moment an incident moves out of a “triage” status, showing that the issue has been confirmed as a real incident.
Why is this important?
Quickly determining whether something is truly an incident is key to good incident management.
It reflects the team’s ability to make fast (and ideally accurate) judgments — a skill influenced by factors like expertise, observability, and experience.
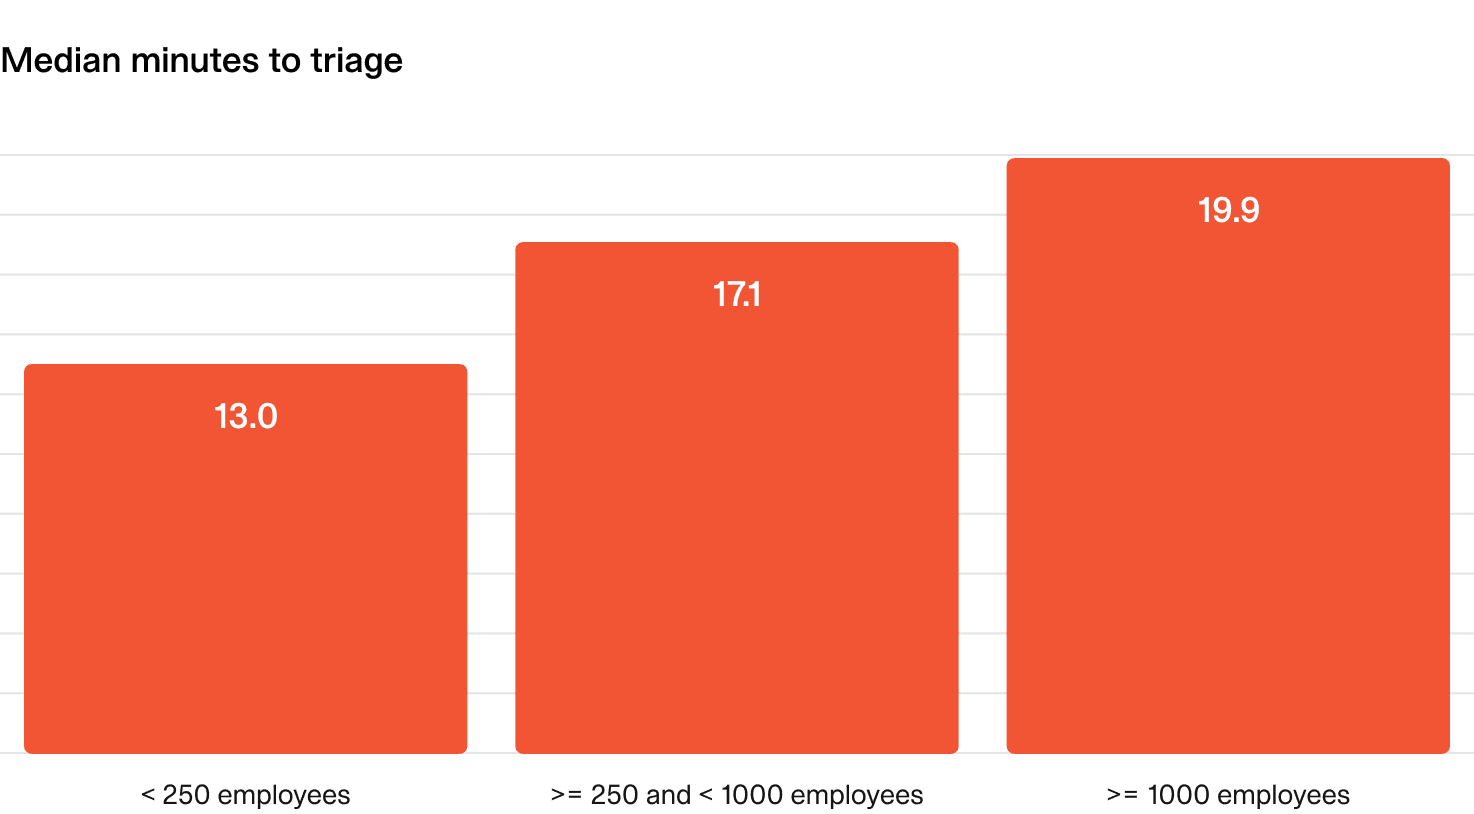
What does “good” look like?
- Small to mid-size companies: Aim for under 15 minutes.
- Large companies: Up to 20 minutes.
How can I improve?
- Gain experience: There’s no substitute for hands-on experience. Understanding how systems work—and how they fail—comes with time. Encouraging a culture where incidents of all severities are declared helps responders gain valuable exposure and build confidence.
- Share incident debriefs: Sharing insights from past incidents helps the entire organization learn and improve. Regularly distribute write-ups, record debrief meetings, and host internal talks to ensure key lessons are accessible to everyone.
- Escalate when needed: Sometimes, the quickest way to resolve an issue is to involve someone with deeper experience. Rather than struggling through a lengthy debugging session alone, knowing when to escalate can save time and lead to faster resolutions.
2.2 Speed to identify critical incidents
In an ideal world, if an incident is a high severity, we want to know about it as soon as possible so we can respond appropriately. In reality, many incidents start as lower severity and get “upgraded” as the full extent of the issue becomes clear or as the duration of the impact increases.
This metric looks at how long it took for critical incidents to reach their final severity status.
Why is this important?
When incidents have significant impact, we’d like to know about them as soon as possible so we can respond proportionately.
Delays here can mean slower escalations, high impact on customers and introduce brand reputation risk.
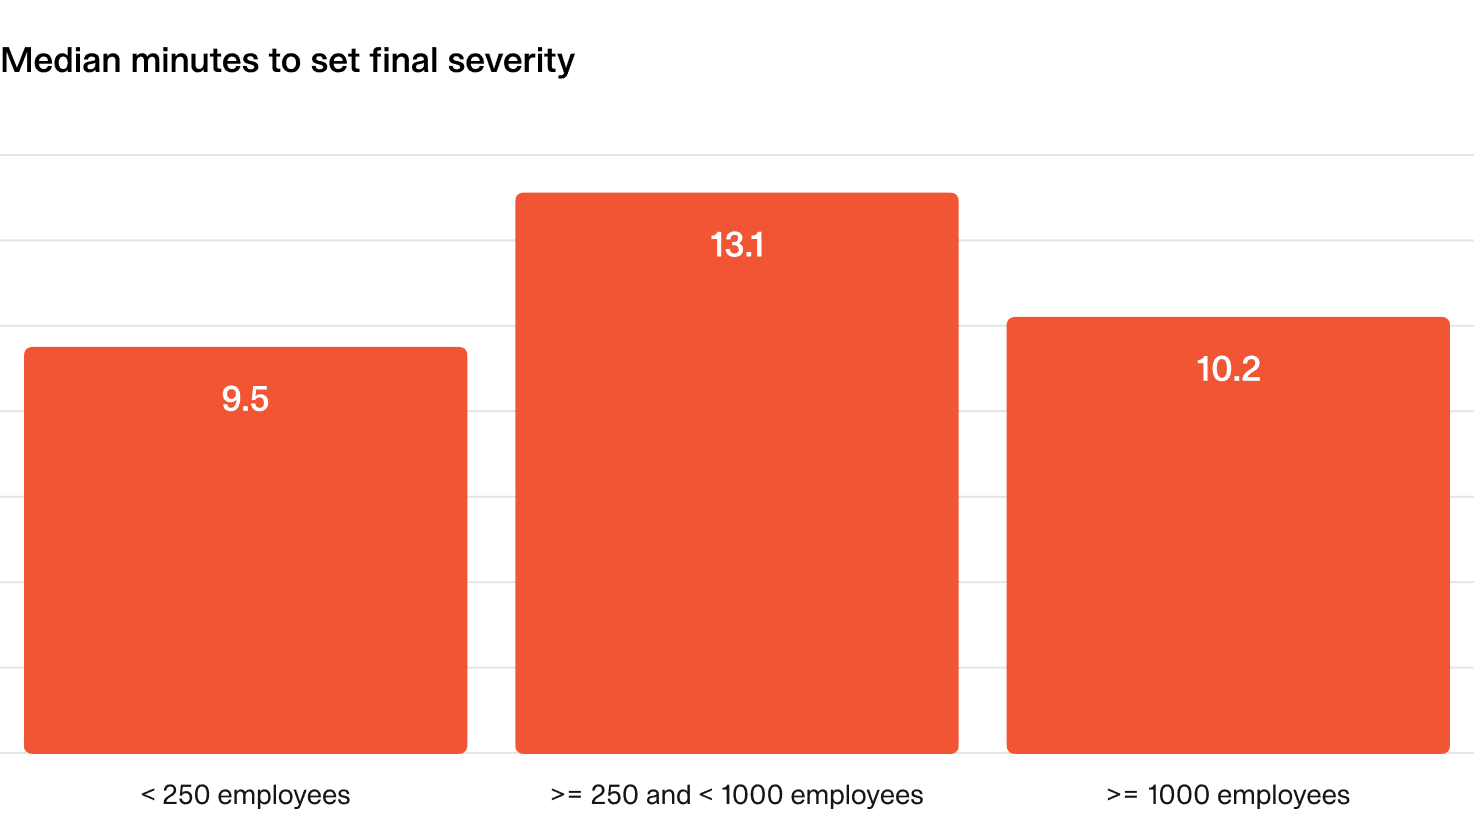
What does “good” look like?
- The median time to identify a critical incident should be under 10 minutes.
- No critical incident should take more than 20 minutes to identify.
How can I improve?
- Encourage proactive reporting: Foster a culture where team members feel comfortable flagging potential high-severity incidents early, even if they lack complete information. Early action can prevent prolonged impact.
- Incorporate customer signals: Monitoring customer support tickets, views on your status page and social media can help spot signs of a critical incident that may not yet be detected or known internally.
- Refine your escalation processes: Establish guidelines for escalating incidents and encourage responders to upgrade severity levels quickly when necessary. Regular training can help teams recognize critical signals faster.
2.3 Speed to assign an incident lead
Why is this important?
By default, the incident lead is responsible for coordinating the response and handling communication. Assigning a lead at the start of an incident helps bring the situation under control faster, and reassures the rest of the organization that the situation is being handled.
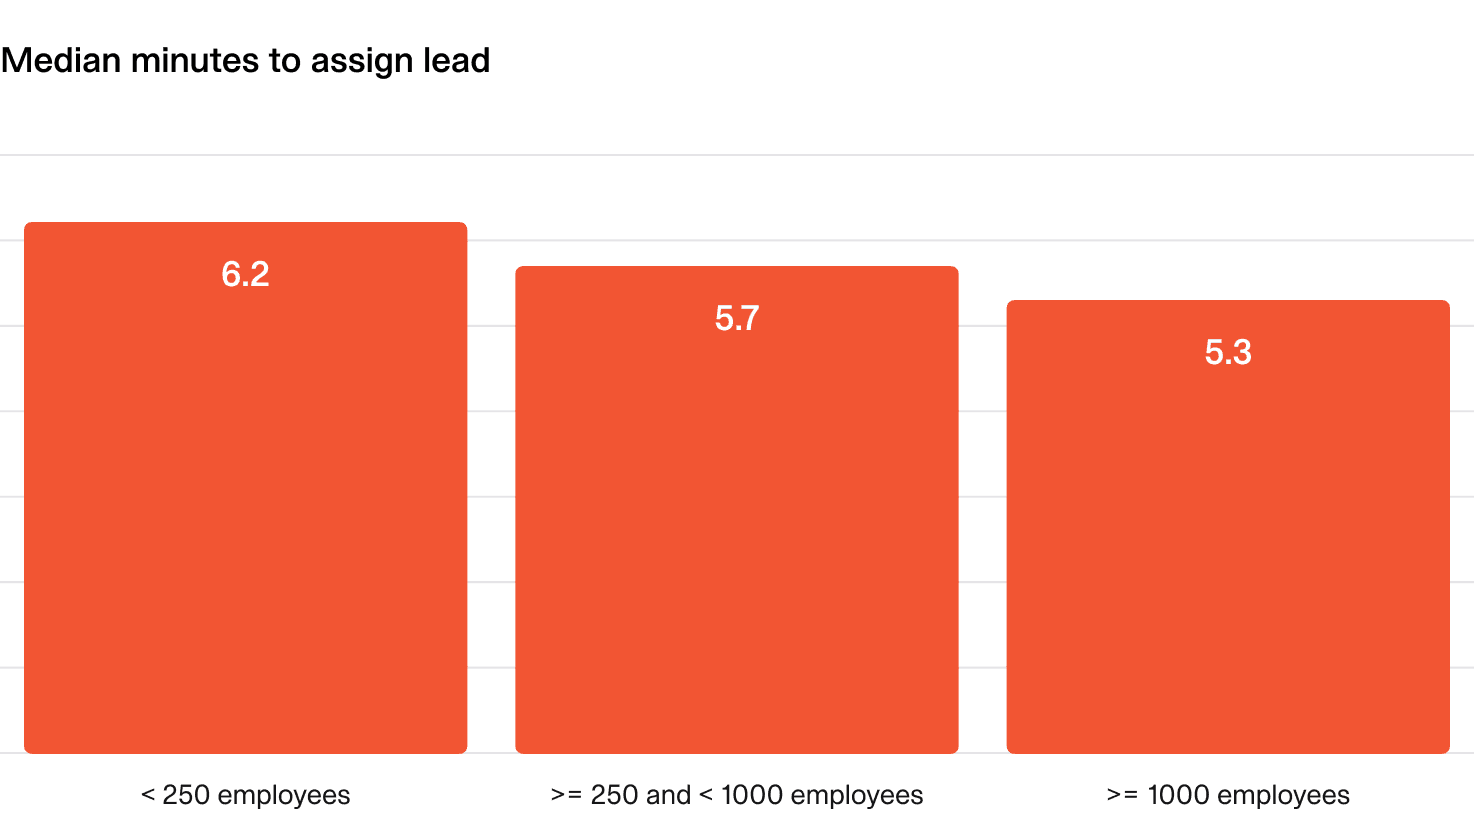
What does “good” look like?
Regardless of the size of organization, you should be assigning an incident lead within the first 5 minutes of the incident being declared.
How can I improve?
- Clarify the process: Set expectations on timelines around assigning an incident lead and emphasize its importance in incident response.
- Send reminders: Leads often jump into action but forget to announce their role, and timely nudges/reminders can help!
- Automate lead assignment: Consider a “first responder is the lead” approach, where the first person to join or communicate in the incident is automatically assigned. Automation can streamline this process and reduce delays.
2.4 Regularity of internal updates
Providing regular updates during an incident can be challenging, but it keeps everyone aligned and helps improve the speed and quality of the response.
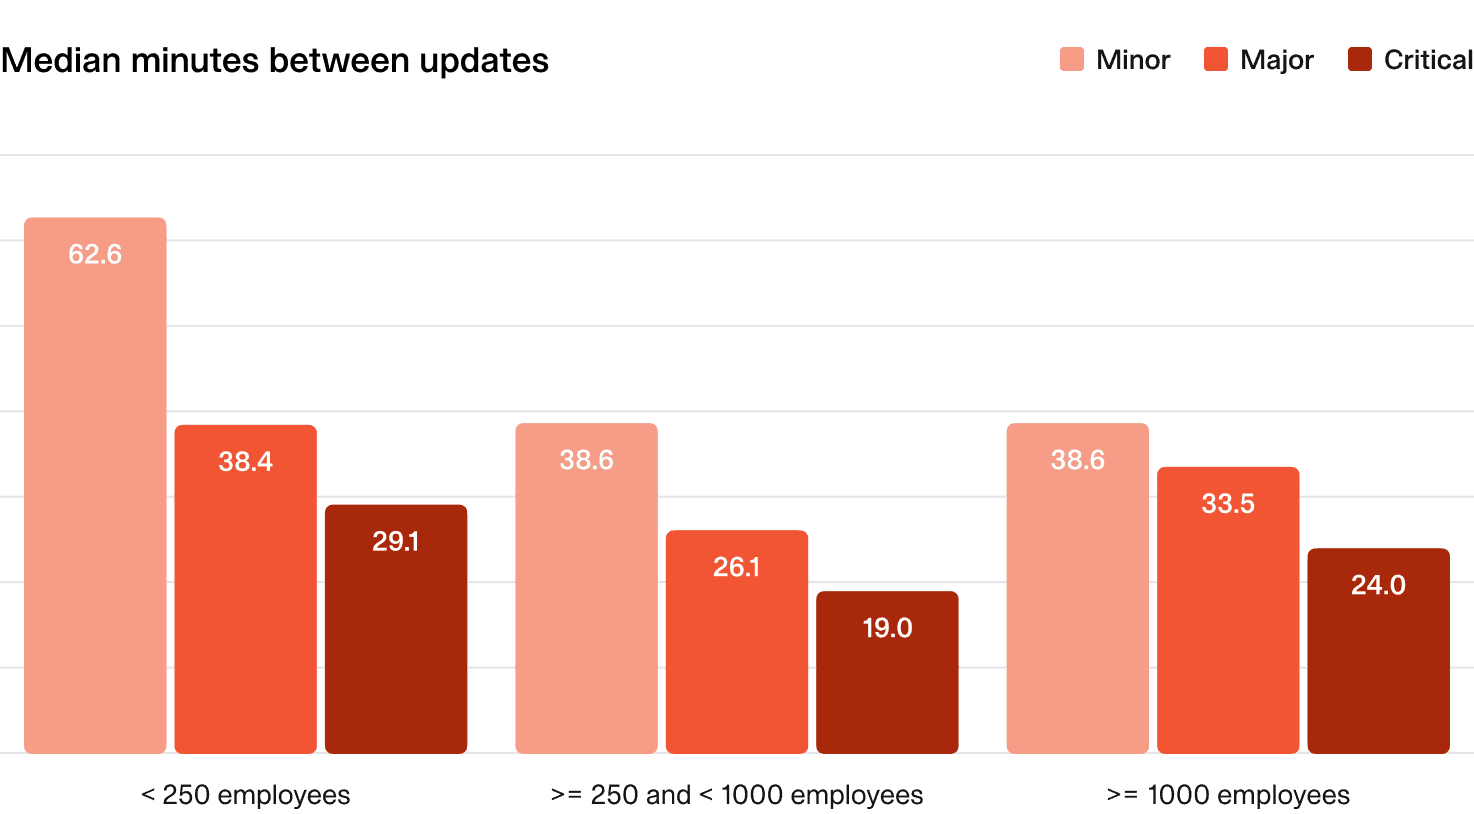
We looked at all incidents, broken down by severity, and established the median time between updates.
Why is this important?
Frequent updates ensure everyone knows the status of the incident, especially when it’s resolved. Clear communication reduces confusion and improves coordination.
Naturally, incident severity plays a role as well—the more severe the incident, the more crucial it is to provide frequent updates.
What does “good” look like?
- Minor incidents: Update every 60 minutes.
- Major and critical incidents: Update every 15-20 minutes.
How can I improve?
- Practice makes perfect: Encourage update sharing across incidents of all severities to build good habits during high-pressure situations. Regular practice helps responders become more comfortable with the process, and what you do in the small things translates to what you do in the larger ones.
- Set expectations: Establish guidelines on update frequency and content, ensuring responders know when and what to communicate during incidents.
- Automate update reminders: Use tools (like incident.io!) to send automated nudges to incident responders, reminding them to provide timely updates. This helps maintain consistency without adding cognitive load.
- Use templated updates: Provide pre-defined templates for different incident types and severities to make it easier for responders to deliver clear, consistent updates quickly.
- Assign a communication lead: Designate a specific person or role responsible for sharing updates during major incidents to ensure consistency and avoid gaps in communication.
2.5 Aggregate time spent on incidents
Given the choice, most would prefer their teams were spending time on planned, value-adding work for their organization rather than responding to incidents.
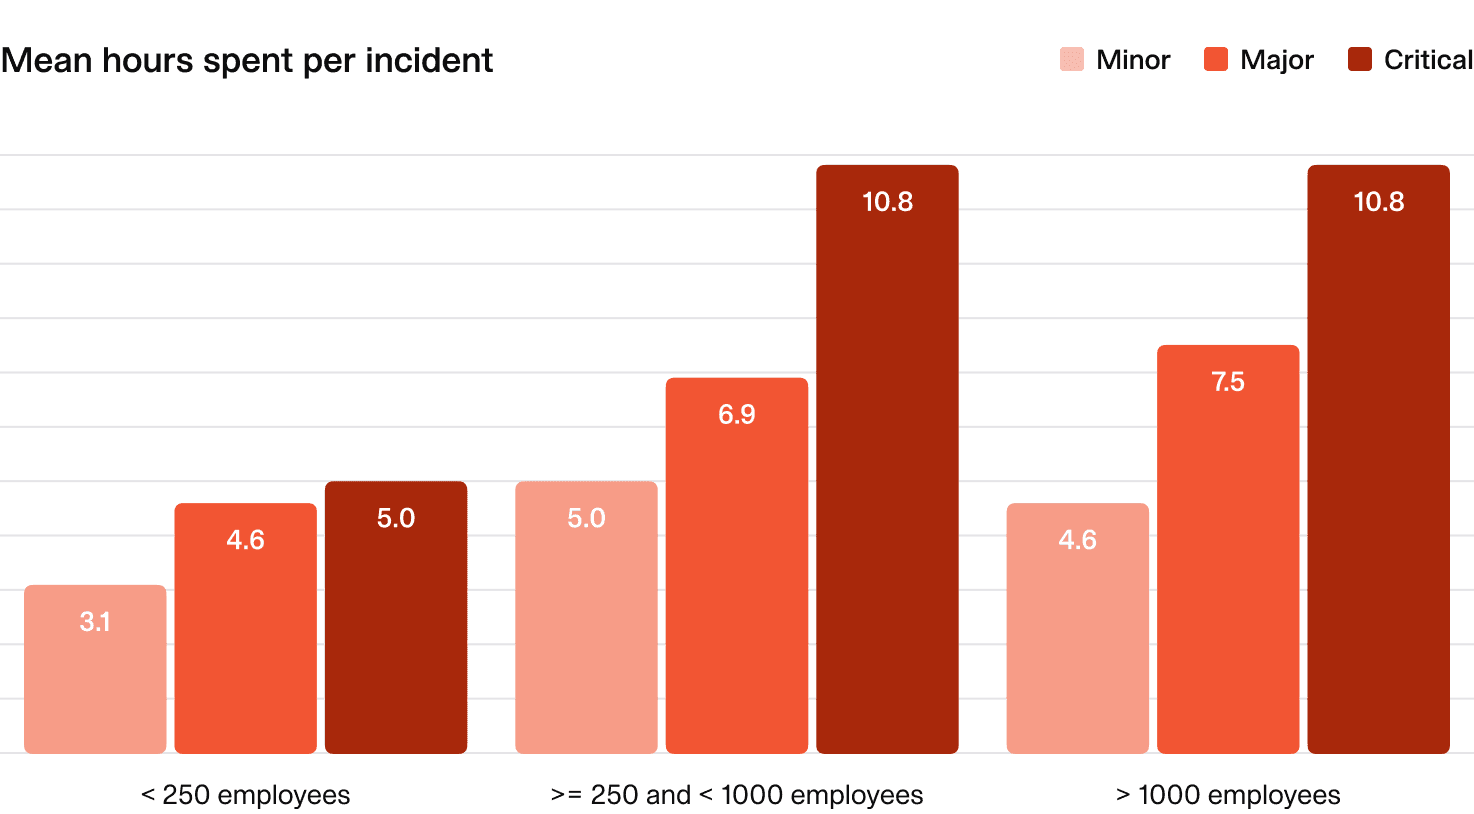
Here, we break down the aggregate number of people-hours spent per incident by organization size and incident severity. There's too much nuance here to set benchmarks or suggested targets, so the data here is shared for information and insight only. Given this metric isn't being used for benchmarking, we show the mean hours spent per incident — not the median.
Why is this important?
Understanding the time (and cost) spent on incidents helps you gauge the impact on productivity and resources.
This can vary based on company size and incident severity.
What does the average organization look like?
- Mid-sized and large companies:
- Major incidents: About 8 people-hours on average (a full workday).
- Critical incidents: Even longer.
- Smaller companies:
- Spend less time on incidents across all severities.
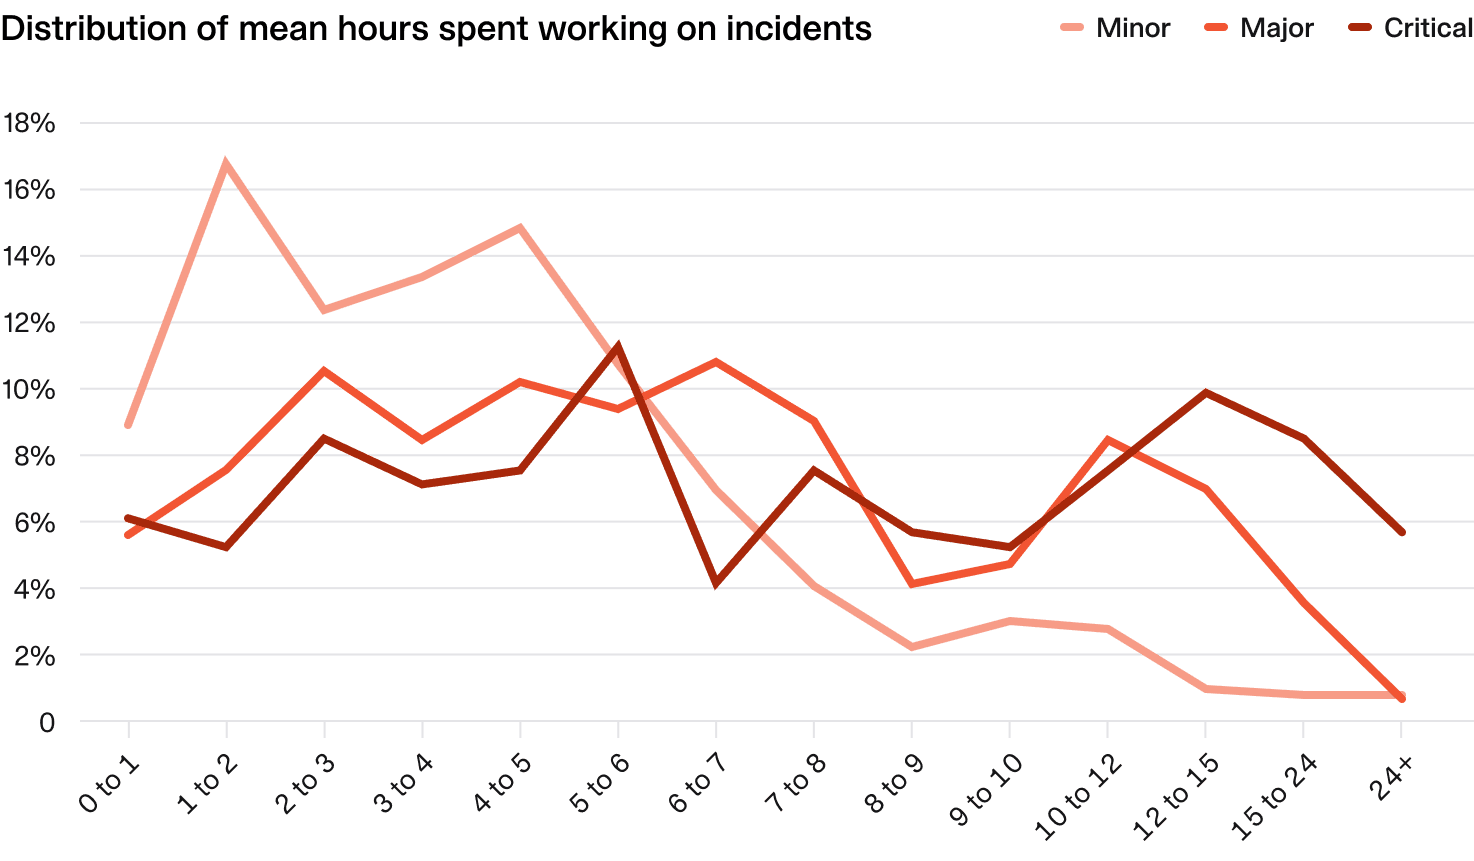
When looking at the distribution of mean hours spent on incidents by severity, a clear trend is seen where most minor incidents are worked on for < 8 people-hours (a full workday).
For major and critical incidents however, there is more variability, with these often spanning multiple workdays worth of workload.
How can I improve?
- Work faster, with fewer people: We’re joking, of course. While there’s no magic formula to speed things up, reviewing incident debriefs may to help identify where time is spent. Look for opportunities to streamline or automate routine, time-consuming tasks to improve efficiency without adding pressure.
2.6 Time spent outside of working hours
Why is this important?
While the ideal target is zero, incidents don’t always respect working hours. Keeping an eye on after-hours work helps you manage team burnout and workload balance.
Again, there’s too much nuance here to set benchmarks or suggested targets, so the data is here is shared for information only.
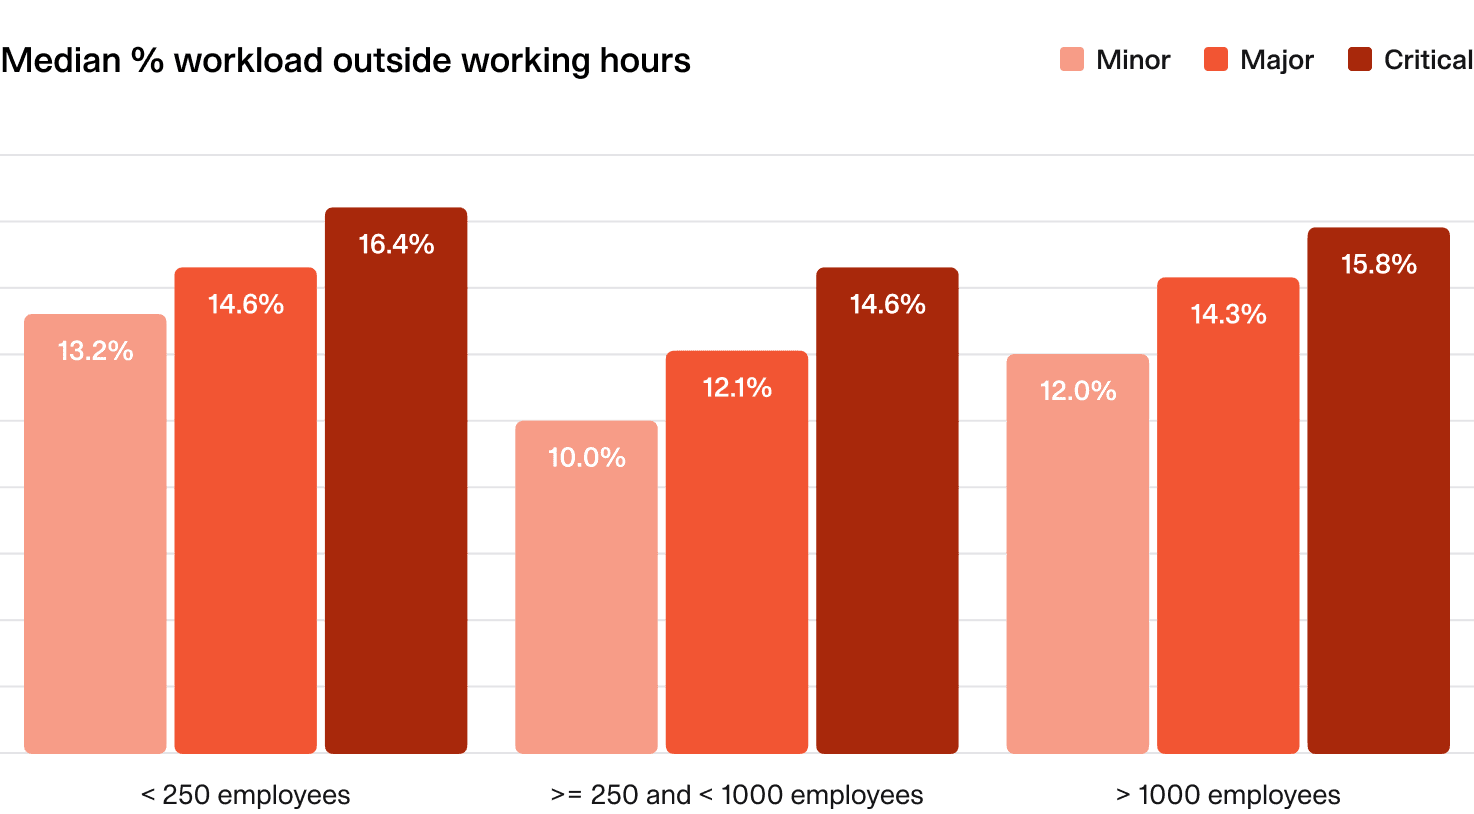
What does the average organization look like?
- Time spent on incidents outside working hours doesn’t vary much by severity, though you might expect more severe incidents to require more after-hours work.
- Smaller organizations tend to have slightly higher after-hours involvement (likely skewed by startups!).
We recommend monitoring this closely and investigating if the average exceeds 15-20%.
How can I improve?
- Monitor team health: It’s reasonable to assume nobody wants to be working outside of working hours, so improvement here revolves mostly around ensuring people are being protected from over-work. Monitoring pages and incidents happening out of hours can help, alongside proactively suggesting cover to ensure no-one is being overworked.
- Look for common causes: In some instances, there may be correlated causes or events that are driving incidents to happen at a specific time of day. Diving into the details may reveal opportunities to improve the underlying systems.
- Foster a culture of escalation: Encourage team members to escalate issues earlier rather than waiting until after hours to seek help. Creating a culture where early intervention is valued can prevent small issues from becoming larger, late-night problems.
- Optimize on-call schedules: Ensure on-call rotations are well-structured to distribute after-hours workload evenly. Consider shorter rotations or rotating shifts across global teams to reduce the burden on specific individuals.
2.7 Distribution of responsibility & key-person risk
Why is this important?
Relying on a small group of people for incident response can lead to burnout and key-person risk.
While dedicated incident teams (e.g. SREs) can work in some setups, distributing the workload helps build resilience and prevents individuals from becoming overburdened.
What does “good” look like?
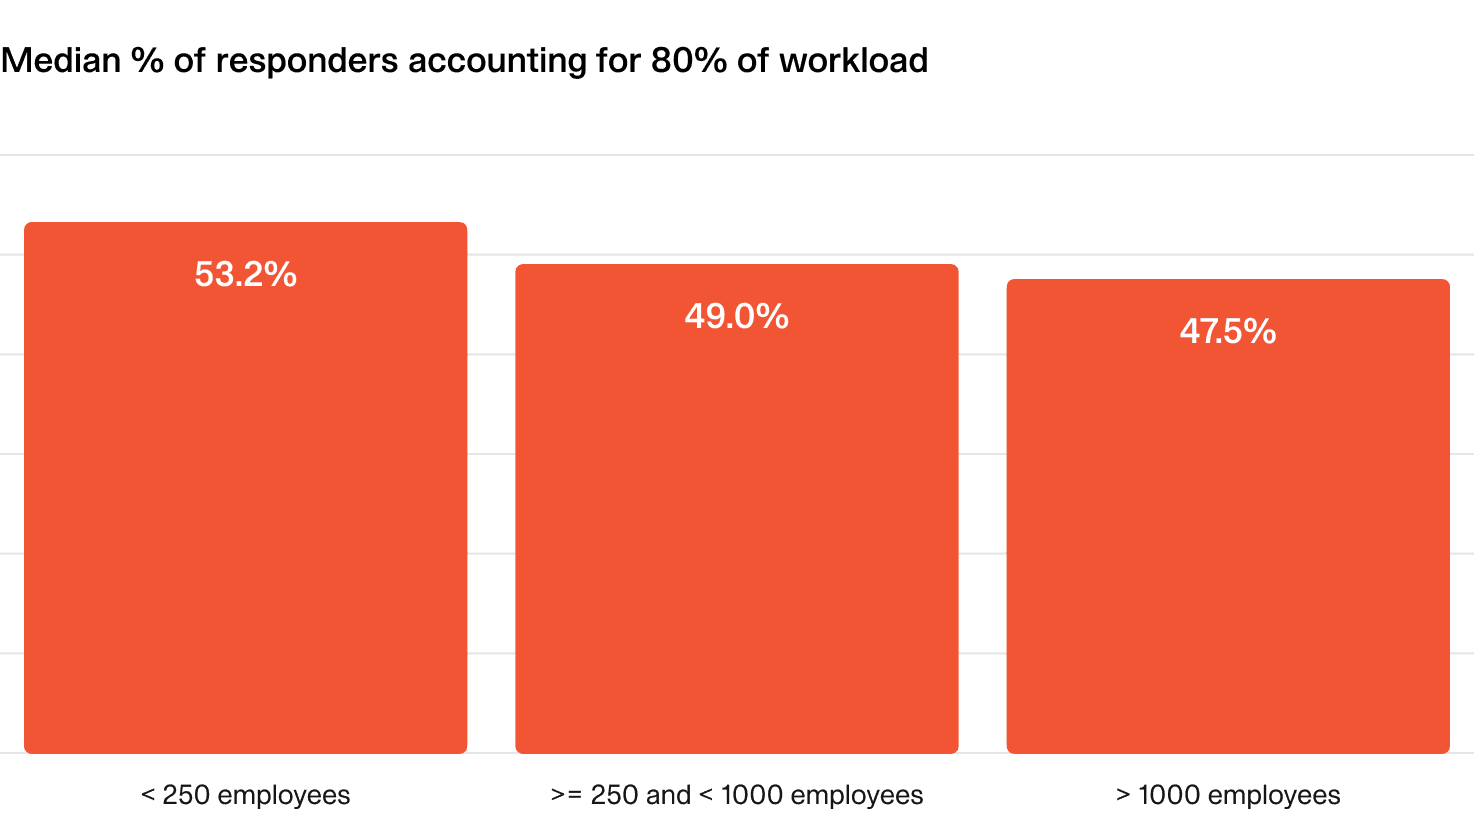
You should aim for more than half of your responders to share the majority of the workload.
One way to evaluate this is to look at the percentage of responders that account for 80% of the overall incident workload.
Smaller companies tend to distribute workload more evenly, but larger organizations may have dedicated teams or more outliers, adding nuance to this metric.
How can I improve?
- Encourage broader participation: Promote a culture where a wider range of team members engage in incident response. Offering shadowing opportunities and rotating responsibilities can help distribute knowledge and workload more evenly.
- Encourage incident debrief participation: Incident debriefs are a great way to develop understanding and expertise around your systems, and are an excellent mechanism for sharing knowledge from more experienced team members.
- Watch for "heroes": Over-reliance on a few individuals can stem from them repeatedly stepping in to handle incidents. While well-intentioned, this can prevent others from gaining hands-on experience and developing their skills. Encouraging broader participation helps build a more resilient team and prevents burnout.
- Monitor workload distribution: If you have access to it, regularly reviewing incident participation data to identify responders who are consistently overburdened can help to spot the problem.
External communications
3.1 Time to public communications
High-severity incidents often impact customers, making timely communication essential. Proactively updating your status page (or another communications channel) can reduce customer stress, prevent support overload, and build external trust.
This metric (filtered for major/critical incidents) measures how long it takes organizations to publish their first status page update—specifically for incidents where one was posted.
Why is it important?
When things go wrong, letting customers know you’re on it, quickly, helps maintain confidence.
What does “good” look like?
- Small organizations: First external communication within ~10 minutes.
- Large organizations: First external communication within ~20 minutes.
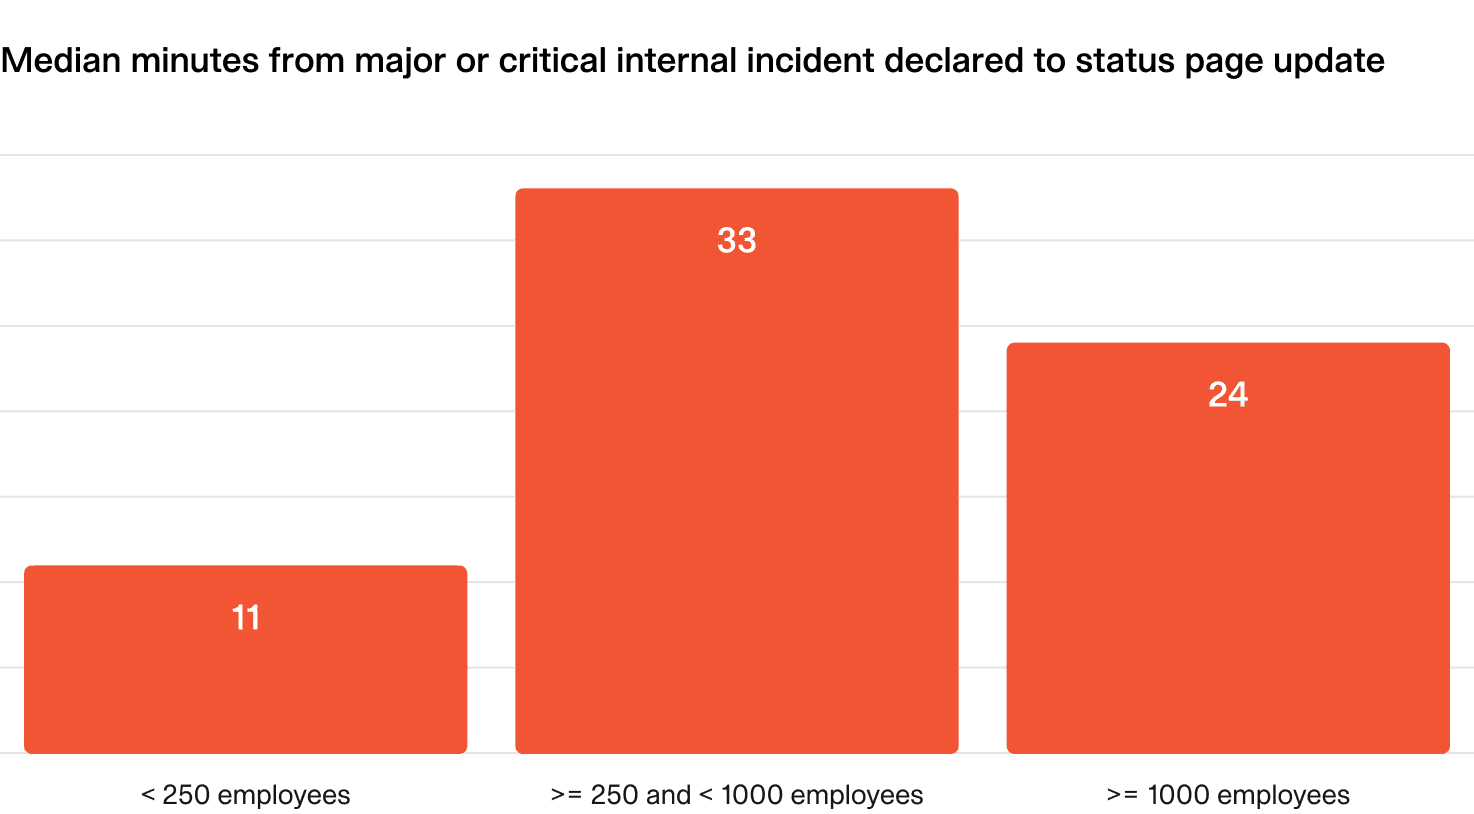
Interestingly, mid-sized organizations show the slowest response times, likely due to growing complexity without the streamlined processes seen in large enterprises.
How can I improve?
- Automate updates: Use nudges triggered by severity level or customer impact to ensure timely and consistent status page updates without manual effort.
- Promote transparency: Foster a culture where public communication is seen as valuable and encouraged, reinforcing the importance of keeping stakeholders informed.
- Use templates: Provide pre-approved templates for common incidents (e.g., “We’re currently experiencing issues with X”) to streamline updates and reduce the risk of errors under pressure.
- Assign communications roles: Clearly designate who is responsible for managing status page updates during incidents to ensure accountability and avoid confusion.
3.2 Regularity of public communications
Why is this important?
Regular status page updates can build trust and manage customer expectations by showing you’re actively addressing the issue.
What does “good” look like?
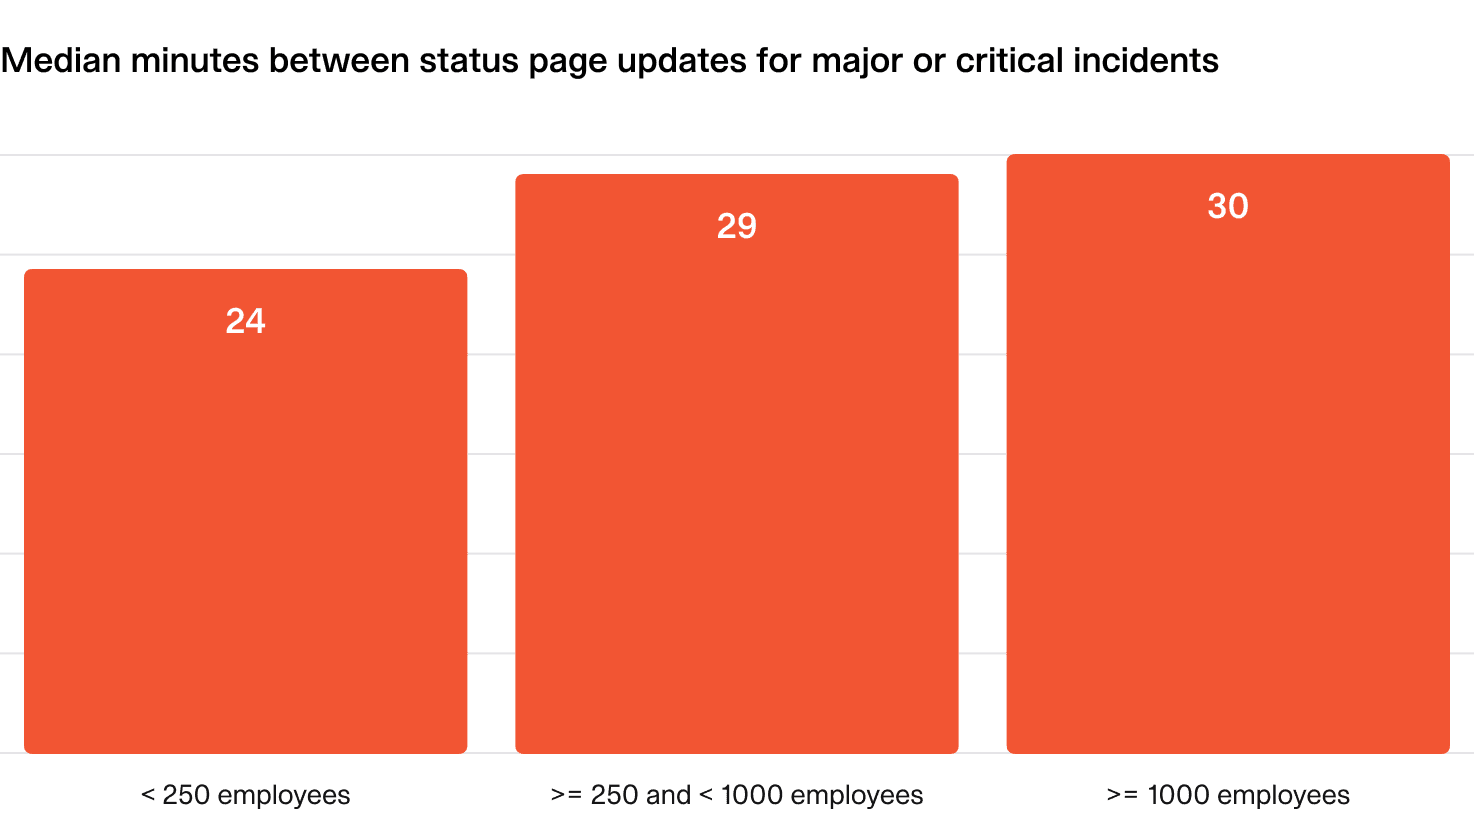
- Aim to share status page updates every 30 minutes during major and critical incidents.
- This reassures customers that progress is being made, without overburdening them with information.
How can I improve?
- Automate nudges: External communication can often be overlooked during incidents. Set up automated reminders to prompt timely and consistent status updates, ensuring your customers stay informed.
- Assign communications roles: Clearly define who is responsible for status page updates to ensure accountability and avoid gaps in communication during critical moments.
Post-incident
4.1 Conducting a full post-mortem process
Debriefing, analyzing, and documenting incidents offers valuable insights, but these activities can be costly. Most organizations reserve them for the most critical incidents, using severity as a guide for when they’re worth the effort.
This metric examines how often post-incident processes — like running debriefs and writing post-mortems — are conducted for high-severity incidents.
Why is it important?
After an incident is resolved, there are often steps you can take to learn and improve for the future.
By doing so, you may be able to prevent the incident from happening again or improve your response to similar incidents.
What does “good” look like?
Smaller companies often write fewer post-mortems since learning and analysis happen more informally.
In larger organizations, aiming to complete post-mortems for 80% of major and critical incidents is a sensible target.
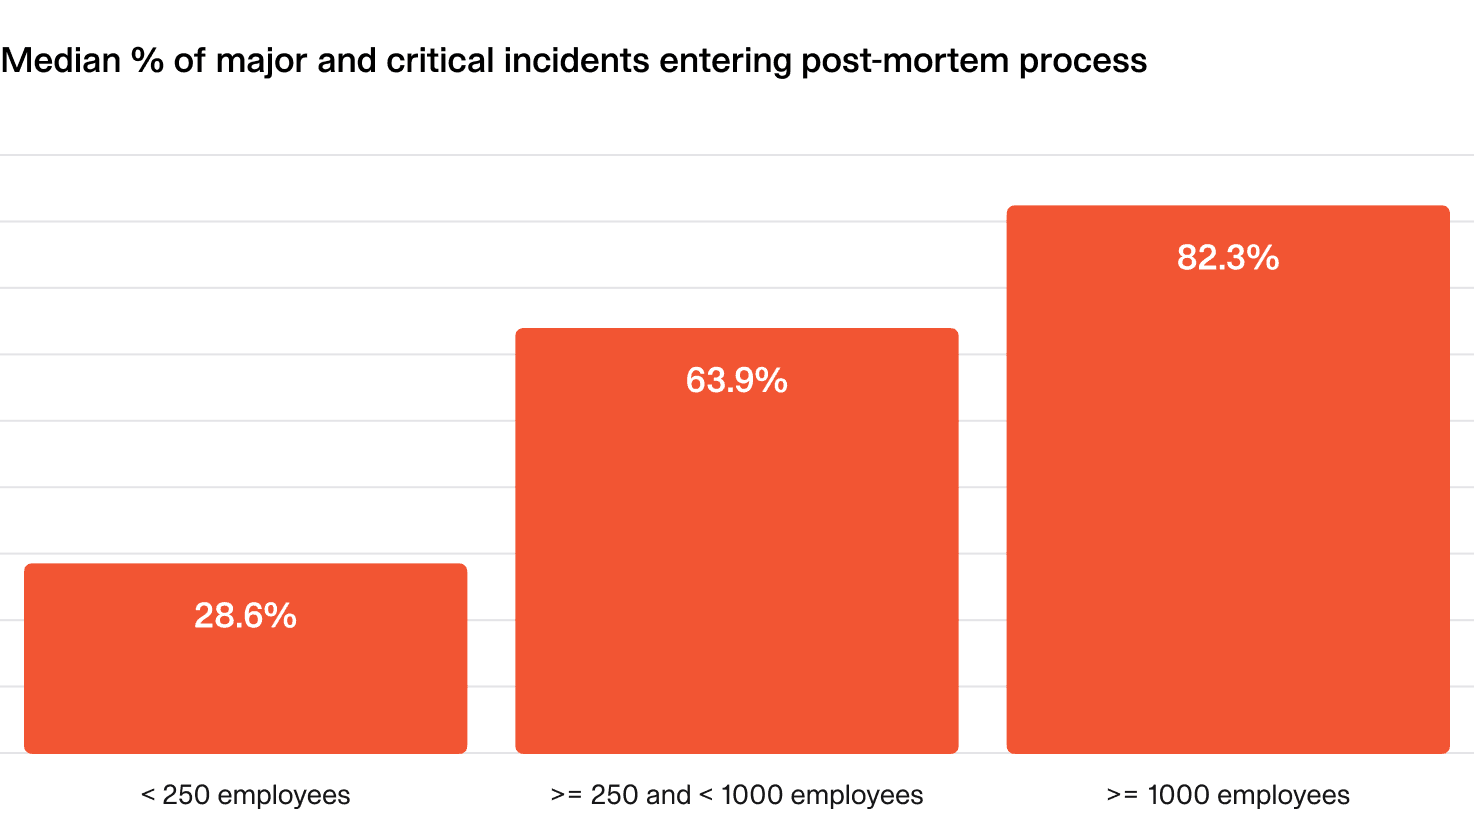
As expected, larger organizations proportionally write the most post-mortems for high severity incidents. This is often the result of policy, regulatory requirements and other organizational processes.
How can I improve?
- Enhance the user experience: If post-incident processes are painful and overly manual, responders will naturally avoid them. Improving the workflow by automating repetitive tasks, integrating with existing tools, and minimizing unnecessary steps can help. The easier the process, the more likely it will be valued, and consistently followed.
- Ensure real value: Processes should serve a clear purpose and provide tangible benefits to the organization. If it feels like a meaningless box-checking exercise, adoption will suffer, and engagement will drop.
- Invest in training: A well-documented process isn't enough—active, ongoing training is crucial for ensuring responders understand and follow it effectively. Conduct regular training sessions, run realistic simulations, and provide accessible resources such as quick-reference guides or interactive tutorials.
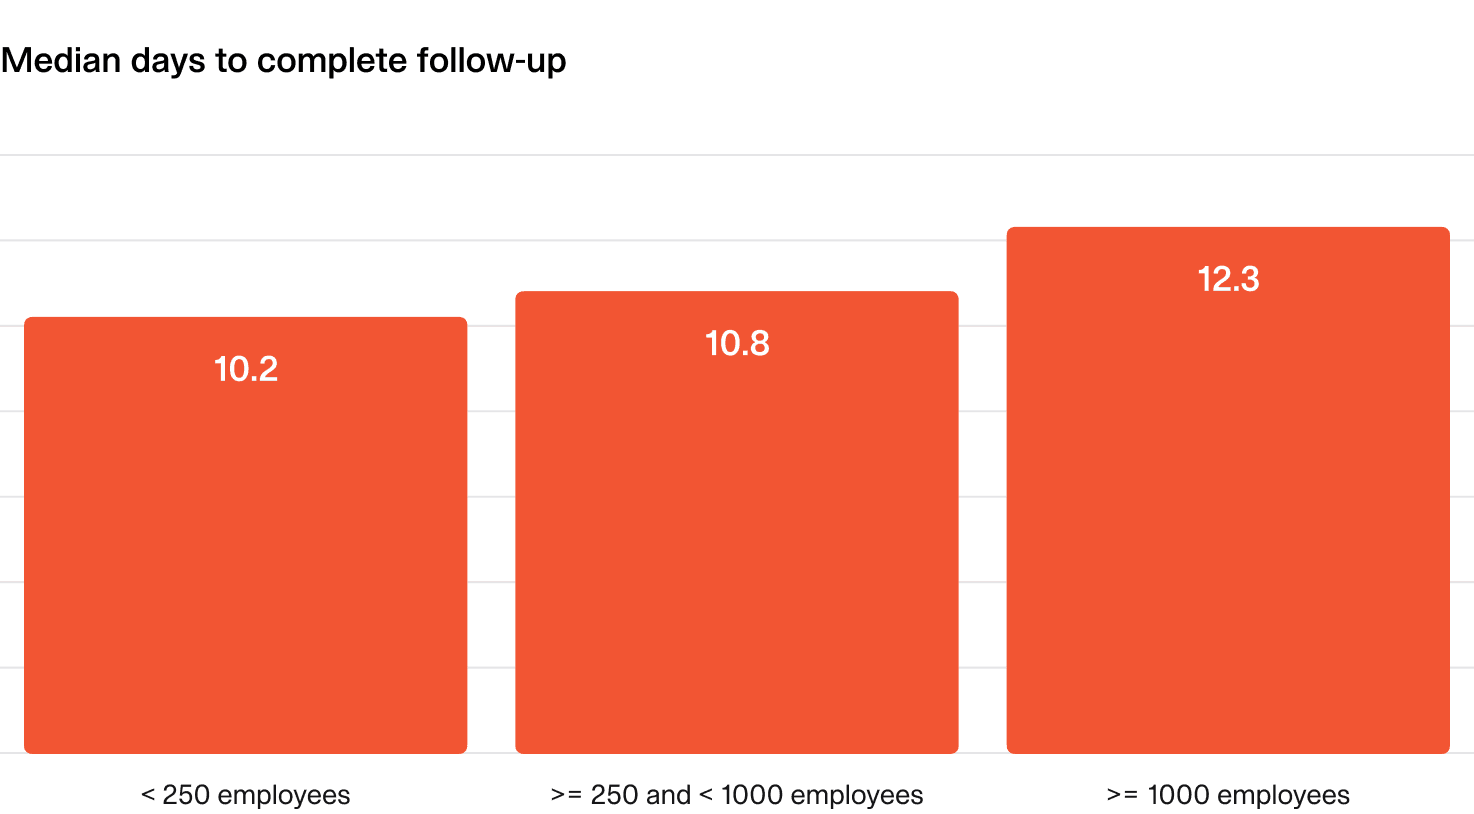
4.2 Time to complete follow-up actions
After an incident, fixing and improving our processes and systems is important. This metric tracks the median time (in days) to complete follow-up items, from creation to completion.
Why is this important?
Follow-up items should be completed promptly to avoid getting lost in the backlog, and to reduce the likelihood of repeat incidents. Of course, there’s plenty of nuance here to accommodate, like weighing up actions against other priorities.
What does “good” look like?
Follow-up items are completed within 2 weeks, regardless of organization size or priority.
How can I improve?
- Track meaningful actions: Focus on tracking follow-ups that teams find valuable and actionable. If tasks feel irrelevant, they’ll likely be ignored or deprioritized.
- Integrate with existing workflows: Make it easy to follow up by exporting follow-ups to tools teams already use, such as issue trackers. This ensures they are visible and prioritized alongside ongoing work.
- Set automated reminders: Prevent tasks from slipping through the cracks by setting up timely, automated reminders. Gentle nudges can help keep action owners accountable without micromanaging.
- Prioritize by criticality: Categorize follow-ups based on importance to ensure high-impact tasks are addressed first. A clear prioritization framework helps teams focus on what truly matters.
So good, you’ll break things on purpose
Ready for modern incident management? Book a call with one of our experts today.
We’d love to talk to you about
- All-in-one incident management
- Our unmatched speed of deployment
- Why we’re loved by users and easily adopted
- How we work for the whole organization


