Automatically generate incident names and summaries from alerts
December 24, 2024

Tired of waking up to incident names like: [CRITICAL] k8s-prod-cluster-east1: High pod eviction rate (>45%) detected in default namespace causing cascading OOM errors across statefulset replicas (oops-i-oomed-again-service-v2)?
Would you prefer it said:
- Name: “High Pod Eviction - Memory OOM in Production StatefulSet”
- Summary:
- Widespread pod evictions occurring in the
east1production cluster. - Over 45% of pods are being OOM killed.
oops-i-oomed-again-service-v2affected, with failures spreading across replicas.
- Widespread pod evictions occurring in the
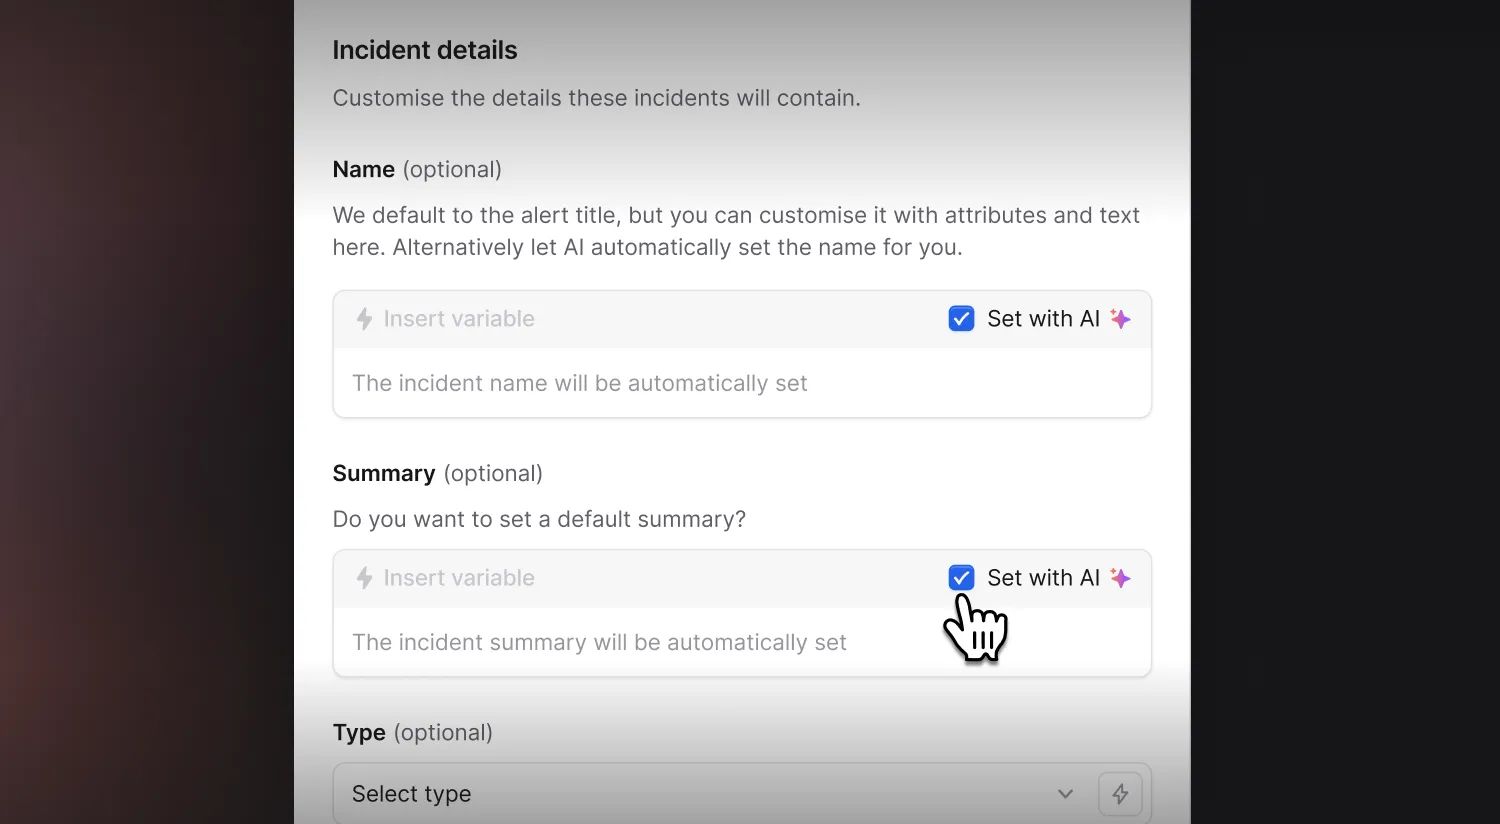
We've just rolled out AI-powered incident naming and summarization that automatically generates clear, descriptive names and summaries based on your alert data.
You can enable AI naming for specific incidents in your alert route while keeping manual naming for others, giving you the flexibility to customize based on your team's needs.
For example, you might want to:
- Automatically name incidents from customer support tickets based on their content.
- Generate descriptive summaries for monitoring alerts that include relevant metrics.
Also, we don’t modify the name of the underlying alert - meaning that if you, like us, have gotten used to blearily reading alert-name-soup, you’ll still be able to make use of your pattern-recognition abilities!
Grafana integration upgrades
When alerts come in from Grafana, the first step is often to check the dashboard that triggered the alert. Now, with upgrades to our Grafana integration, we’ll pull a screenshot of the dashboard and place it in the channel.
You can enable this by visiting Settings → Integrations → Grafana.
🚀 What else we’ve shipped
New
- You can now update incident status pages from a stream channel
- For the BugSnag alert source, a new alert will be created for every spike, even if the previous spike was not resolved.
Bug fixes
- If you manually change your volume or ringer switch on Android, we'll no longer try and revert it to what it was before you were paged
Improvements
- New lines are removed from PagerDuty Service descriptions in Slack, since they were being displayed poorly
- Our API and Terraform docs are now clearer on what values to use for escalation path attributes
- We've been doing some behind-the-scenes work to reduce noise from messages in the incident channel
- Long alert source names no longer escape the box in the configuration overview
- If you only have 1 postmortem template, the flow for creating a post-mortem is much quicker now
- Removed duplicate Zoom call-in-progress messages in Slack
So good, you’ll break things on purpose
Ready for modern incident management? Book a call with one of our experts today.
We’d love to talk to you about
- All-in-one incident management
- Our unmatched speed of deployment
- Why we’re loved by users and easily adopted
- How we work for the whole organization


