Datadog integration
February 1, 2023

When things go wrong and it's two in the morning, you don't want to be following trails of links to find the information you need. Enter our new Datadog integration — now when you trigger incidents using PagerDuty or OpsGenie, incident.io automatically pulls through information about any Datadog monitors that triggered the alert.
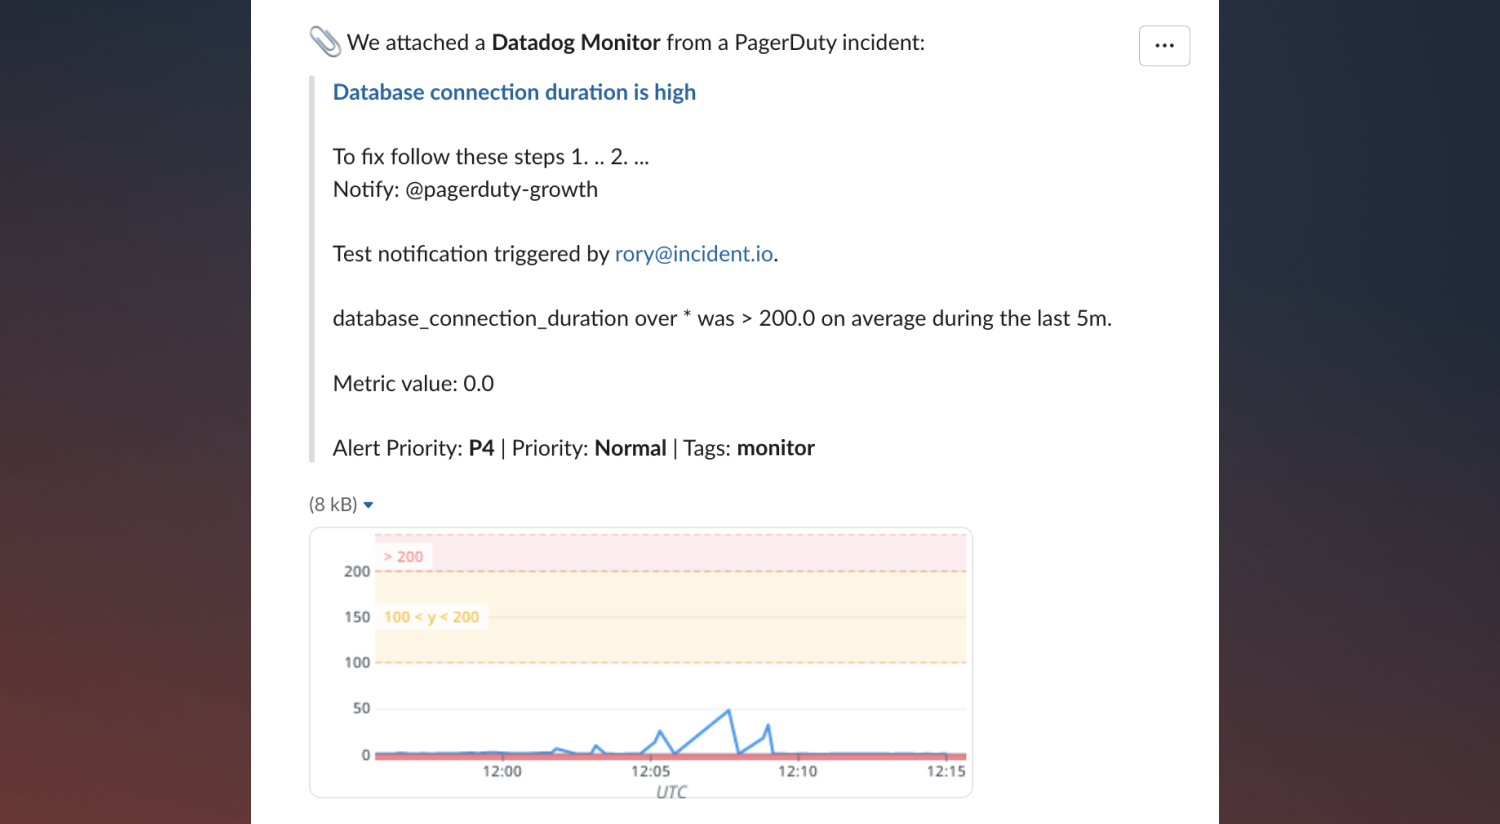
When you join your incident channel, you'll see a new message when an incident is triggered by Datadog that tells you:
- The name of the offending Datadog Monitor, with a link to go and see more at that point in time
- A snapshot image of the monitor, so you can see the recent history of the monitor and determine if this gradually got worse or if it was a sudden spike
- Up to 500 characters of the description of your monitor - so if you’ve things like runbooks linked, you can access them straight from your incident channel
- Any tags you’ve associated with your Datadog monitor
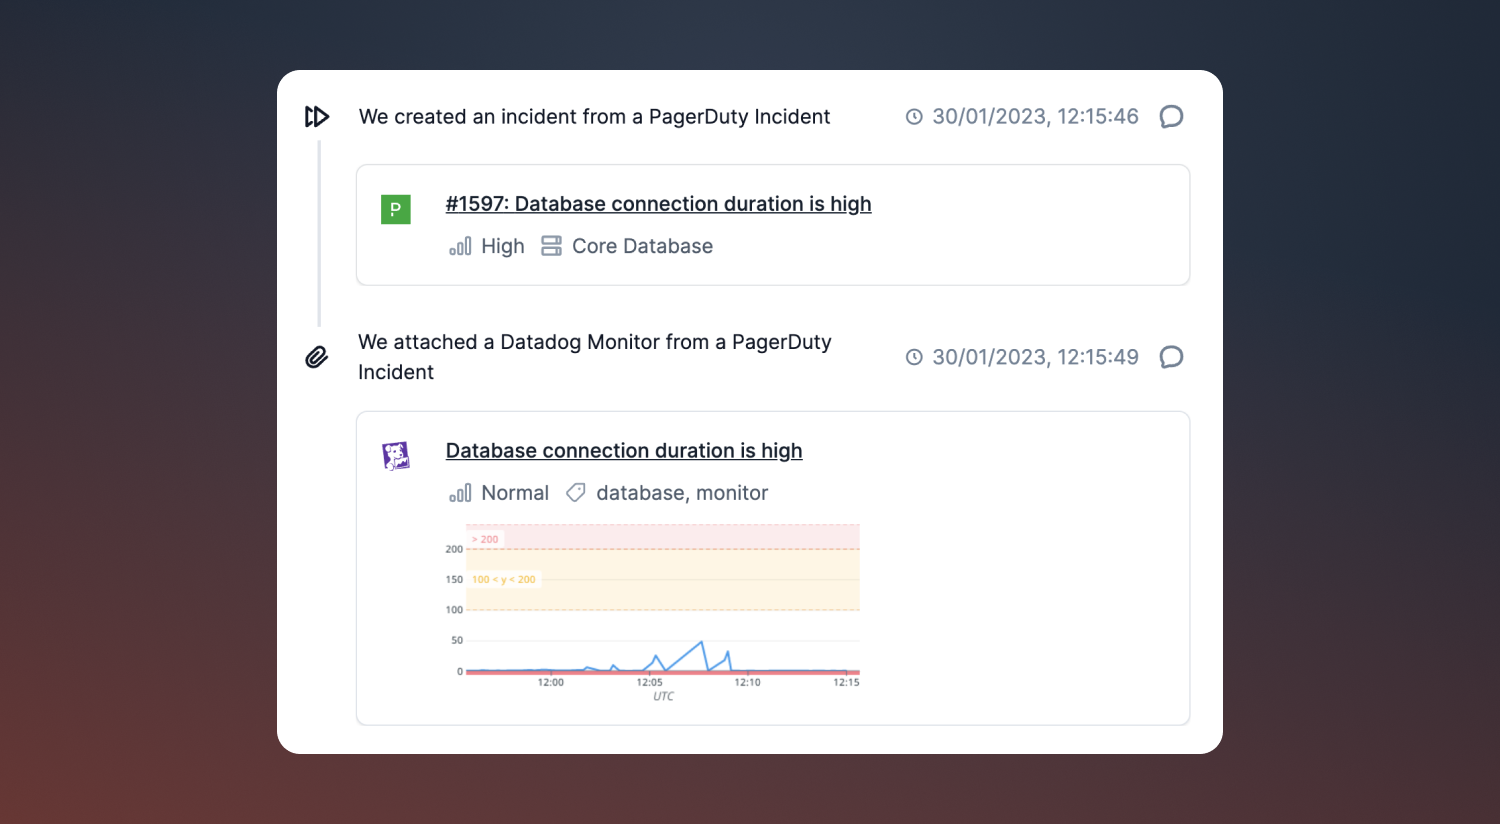
Additionally, the monitor now gets treated as an attachment. So, once things have died down, and you're working through your post-incident process, you can go to the incident homepage on the web and there'll be a link to the monitor there under both the Attachments tab, and listed in your Timeline.
In addition to incident.io automatically pulling through Datadog Monitors, you can also pin Slack messages containing Datadog links and incident.io will put them on your incident timeline in the dashboard and in post-mortems.
This is really useful for links to logs, traces and dashboards that might have helped you track down the cause of an incident after the initial monitor triggered.
What's more, if you paste in the link to any Datadog snapshots, Slack will unfurl the image, and if you pin that message, incident.io will add the linked image to your timeline and attach it to your generated post-mortem.
For more info on how to use Datadog with incident.io, check out our Datadog integration docs.
So good, you’ll break things on purpose
Ready for modern incident management? Book a call with one of our experts today.
We’d love to talk to you about
- All-in-one incident management
- Our unmatched speed of deployment
- Why we’re loved by users and easily adopted
- How we work for the whole organization


