Debugging deadlocks in Postgres
February 4, 2025 — 7 min read

ERROR: deadlock detected (SQLSTATE 40P01)What do you do when you see this error?
Deadlocks are a natural hurdle in backend development, but with a bit of digging and careful design they can be identified and resolved.
First, let’s whizz through the basics.
A brief intro
What is a lock?
Locks are used to control concurrent access to data in tables, preventing multiple processes from simultaneously accessing or mutating the same data.
When one process holds a lock, any other process which also requires the lock must wait until it has been released, for example when the first process has completed.
Though locks can be introduced explicitly in your code and queries, the majority are created implicitly by the database itself (in our case: Postgres), allowing your queries to run safely and predictably.
📖 A comprehensive guide about the many types of Postgres locks can be found here.
What is a deadlock?
Deadlock occurs when two or more processes cannot progress because each is waiting on another to release a lock.
Suppose an endpoint X initiates a transaction, completing the following:
- Update Incident
- Update Incident Custom Fields
- Update Incident Summary
Now suppose another endpoint Y performs similar but slightly different work:
- Update Incident Summary
- Update Incident
When both of these endpoints are triggered at the same time, they run a high chance of reaching deadlock:
X acquires a lock on the Incident while Y acquires a lock on the Incident Summary.
X proceeds to wait for a lock on the Incident Summary while Y waits for a lock on the Incident.
Fortunately for us, good old Postgres will only allow a process to wait on a lock for so long (the lock_timeout), and it will also check to see if a deadlock is in play, ending the conflict early and returning the above error.
How do I fix a deadlock?
The first, truest, and perhaps “only” solution to a deadlock is to redesign your transactions to operate in a consistent order.
Due to this, deadlocks are usually not seen as transient or load-inflicted errors, rather they are indications of poorly structured logic.
In the above example, the deadlock can be avoided if the Incident Summary is updated only after updating the Incident.
Where the above is impractical or impossible, there are also always alternative approaches.
To name a few:
- Introducing an explicit lock at the beginning of the transaction, for example with
FOR UPDATE. This could be a lock on the rows being operated on, or perhaps on an advisory lock. - Decreasing the scope of an explicit lock, for example with
FOR NO KEY UPDATE. - Adding retries with significant jitter, to avoid repeated deadlocks
Note however that all three of these will decrease parallelism and increase the chance of lock timeout errors.
Case study: The bulk upsert
Sometimes the cause of a deadlock doesn’t seem as straightforward as a few out-of-order steps.
We were seeing an occasional deadlock in a process that syncs our Catalog product.
The sync is triggered concurrently from multiple parts of the app, keeping Catalog data up to date on a periodic basis, but also when state is known to be shifting.
The customer impact of this error was low - the sync would be retried before long and all would be well, however something was amiss and we were keen to eliminate the pager noise with a proper solution.
The debugging process
To understand the nature of the deadlock we needed to identify the two competing processes.
The first step was to pull out our Runbook for debugging lock timeouts in Postgres.
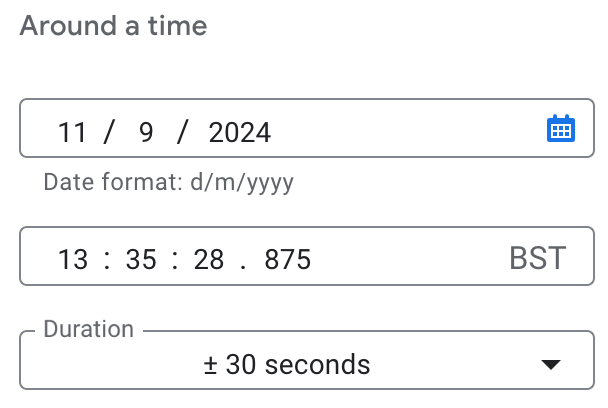
To diagnose the issue we needed two key pieces of information:
- The timestamp of the deadlock error.
- A trace or request ID. This is some fragment or identifier found on the seen error log which can also be found on most other logs produced by the same process / request lifetime.
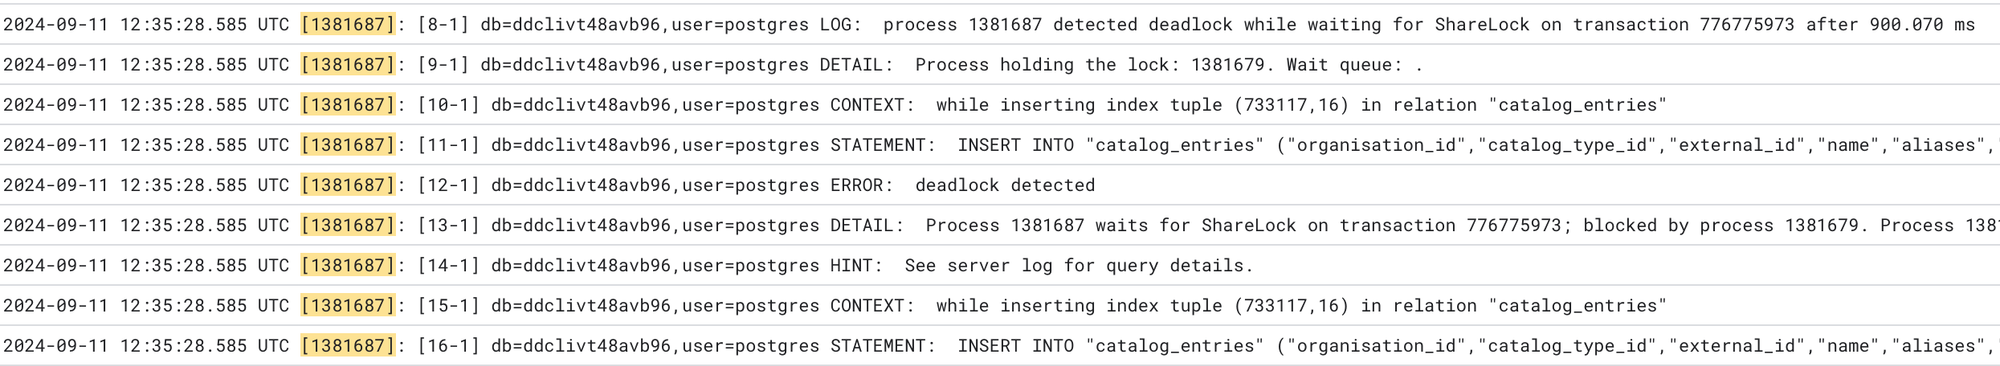
Using the Google Cloud Console to view Postgres logs, we searched for the trace ID around the time of the error.
This revealed the Postgres process ID (PID) of 1381687, the query being executed and the full query blocking it, all in one. Bingo!

Postgres had blessed us with everything we needed in just one log line, however typically the logs are spread across multiple lines, in which case we would then perform multiple searches:
$trace1 OR $pid1, to discover the second PID$pid2, to discover the second trace ID$trace2 OR $pid2, to see the full sequence of events of the competing process.
For example:
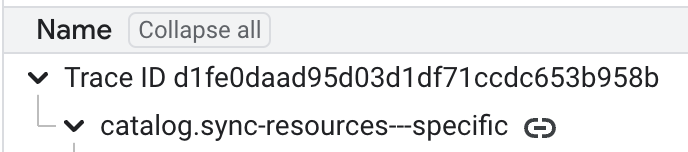
"d1fe0daad95d03d1df71ccdc653b958b" OR "[1381687]"
With the two offending queries identified, we were surprised to notice that they were exactly the same.
Following both traces in Google Trace explorer further revealed that both queries were also indeed invoked by the same code.
🤔 How can two identical transactions deadlock?
If the two concurrent processes acquire the same locks in the same order or sequence, then they shouldn’t deadlock, right? One will wait for the other to complete. If you are unlucky you will encounter a lock timeout.
However in this case, two seemingly identical procedures were triggering a deadlock. In particular, during a bulk upsert.
With one insert query we were inserting multiple rows of new data. If any row already existed and a conflict on a uniqueness constraint was seen, we would update the existing row instead of erroring. This is quite a common “create or update”, or “upsert” pattern.
At this point we discovered that the two procedures were not identical.
The rows being inserted were not sorted, in fact they were ordered randomly, having been placed in a map before being converted back into a slice (an array, effectively, in Go).
Further, Postgres acquires locks individually and sequentially during a bulk insert, rather than locking all affected rows at the beginning of the statement.
This meant that the two seemingly-atomic upsert operations were indeed comprised of many out-of-order steps, acquiring locks in random orders and blocking each other from proceeding.
In this case, the number of rows to insert was small enough to simply sort before upserting, solving the deadlock and concluding our investigation 🙌
Lessons learned
Deadlocks can seem scary! But they boil down to a fundamentally simple problem.
Use Postgres logs to your advantage and understand which processes are in conflict.
Don’t underestimate seemingly simple operations, particularly if concealed beneath an ORM. The order of operations matters at a much lower level!

Louis Heath
Product Engineer
See related articles

Don't add a read replica until you've read this
Our learnings from implementing a product-wide read replica migrations, including some useful patterns for routing queries to replica and primary
 Johanna Larsson
July 21, 2026

We rebuilt our post-mortems from the ground up
Today we're launching our new post-mortems experience, and I want to walk you through what we've done and why.
 Pete Hamilton
March 17, 2026

Bloom filters: the niche trick behind a 16× faster API
This post is a deep dive into how we improved the P95 latency of an API endpoint from 5s to 0.3s using a niche little computer science trick called a bloom filter.
 Mike Fisher
November 14, 2025
So good, you’ll break things on purpose
Ready for modern incident management? Book a call with one of our experts today.
We’d love to talk to you about
- All-in-one incident management
- Our unmatched speed of deployment
- Why we’re loved by users and easily adopted
- How we work for the whole organization


