Insights comparison view
August 23, 2024

Understanding incidents and analyzing trends is crucial for building resilience in your organization. Insights makes this possible by showcasing key data and metrics within incident.io.
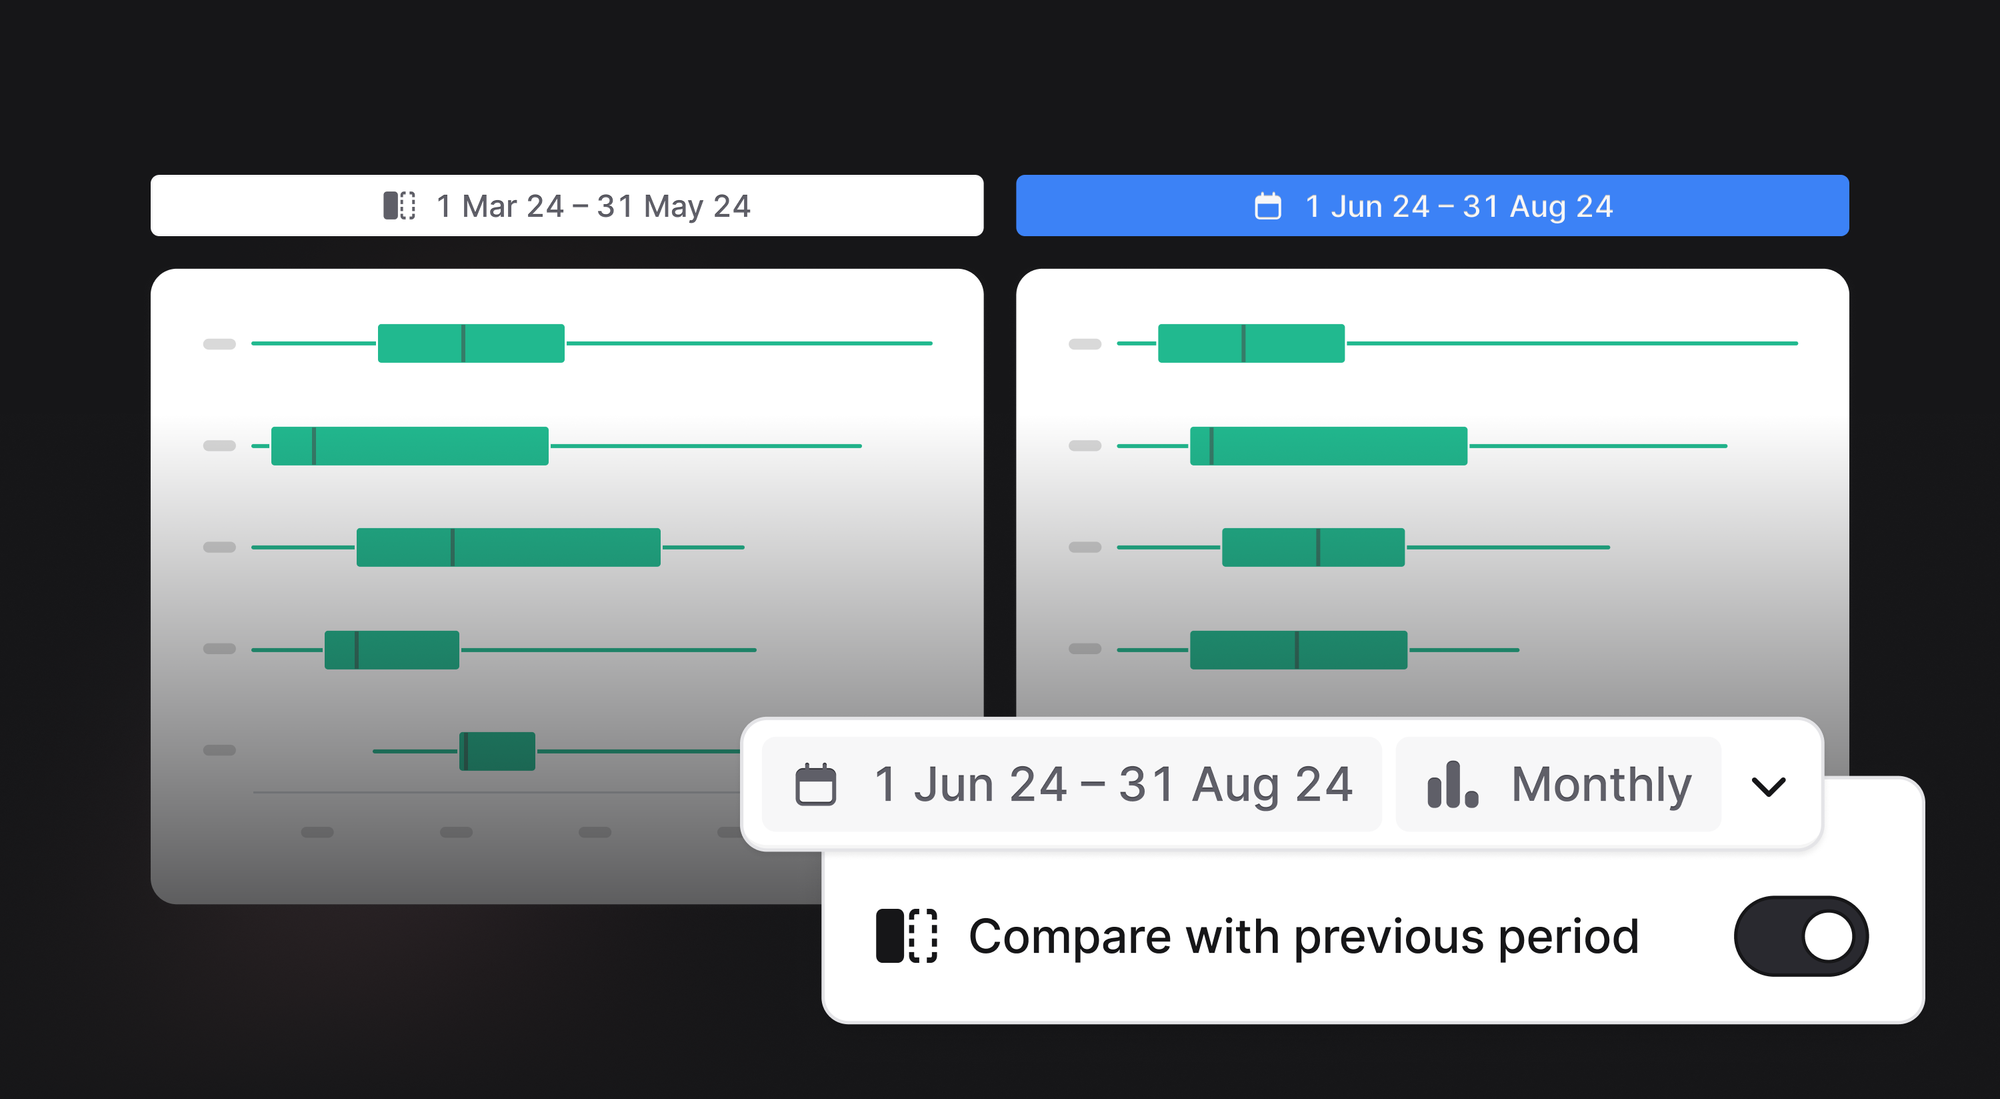
This week, we've enhanced Insights with a new side-by-side view, enabling you to compare data from two time periods in a single dashboard.
With just a few clicks, you can now compare your MTTX for this quarter versus last, see how your team's workload has evolved, and examine month-by-month follow-up completion rates.

To get started, head to Insights, click the date picker, and select "Compare with previous period".
Whether you're compiling monthly or quarterly reports or quickly identifying behavioral changes week-to-week, our Insights comparison view makes the process effortless.
So good, you’ll break things on purpose
Ready for modern incident management? Book a call with one of our experts today.

We’d love to talk to you about
- All-in-one incident management
- Our unmatched speed of deployment
- Why we’re loved by users and easily adopted
- How we work for the whole organization


