24/7 schedule coverage policy
August 11, 2026
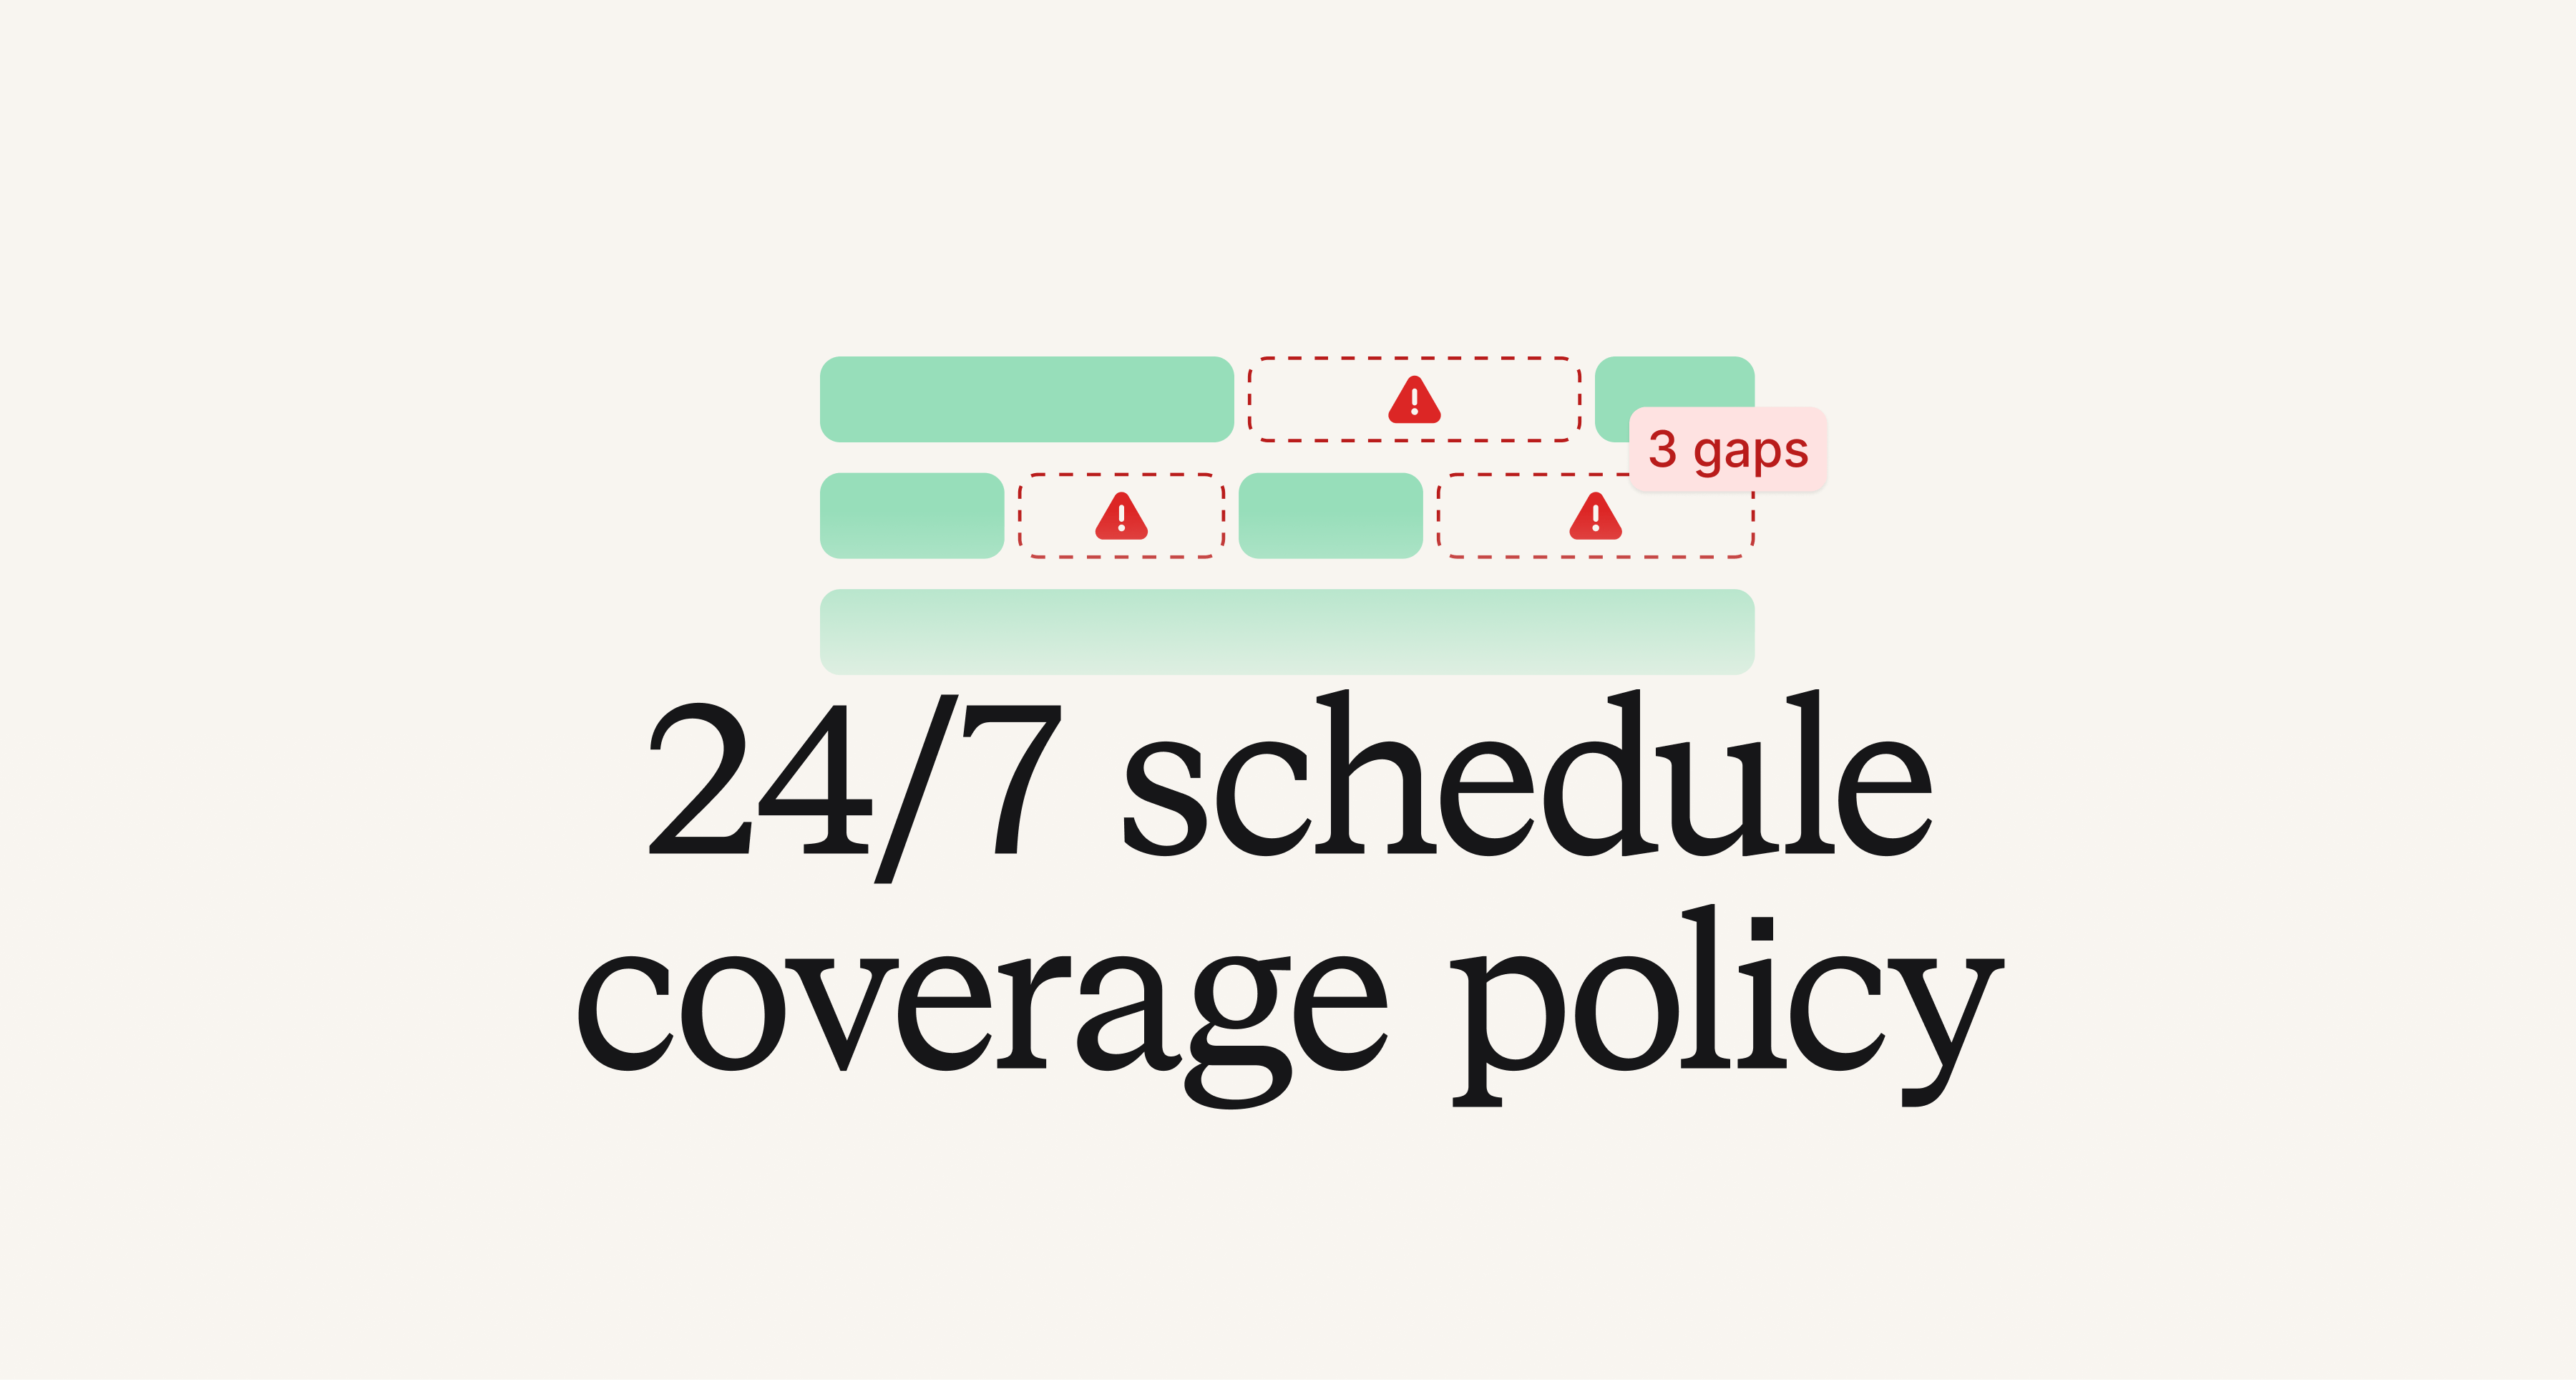
One of the most stressful parts of running an on-call program is making sure there is always someone that can be reached to actually answer a page. No one wants an escalation to happen and it just… reach no one. So, we’ve added another safeguard for organizations to leverage: 24/7 schedule coverage policies!
This policy will identify any gaps in a schedule or rotation no matter if the issue stems from users being deactivated (ie. from layoffs), users missing on-call seats, or if there is just simply no one scheduled to be on-call (ie. poor schedule or override configuration).
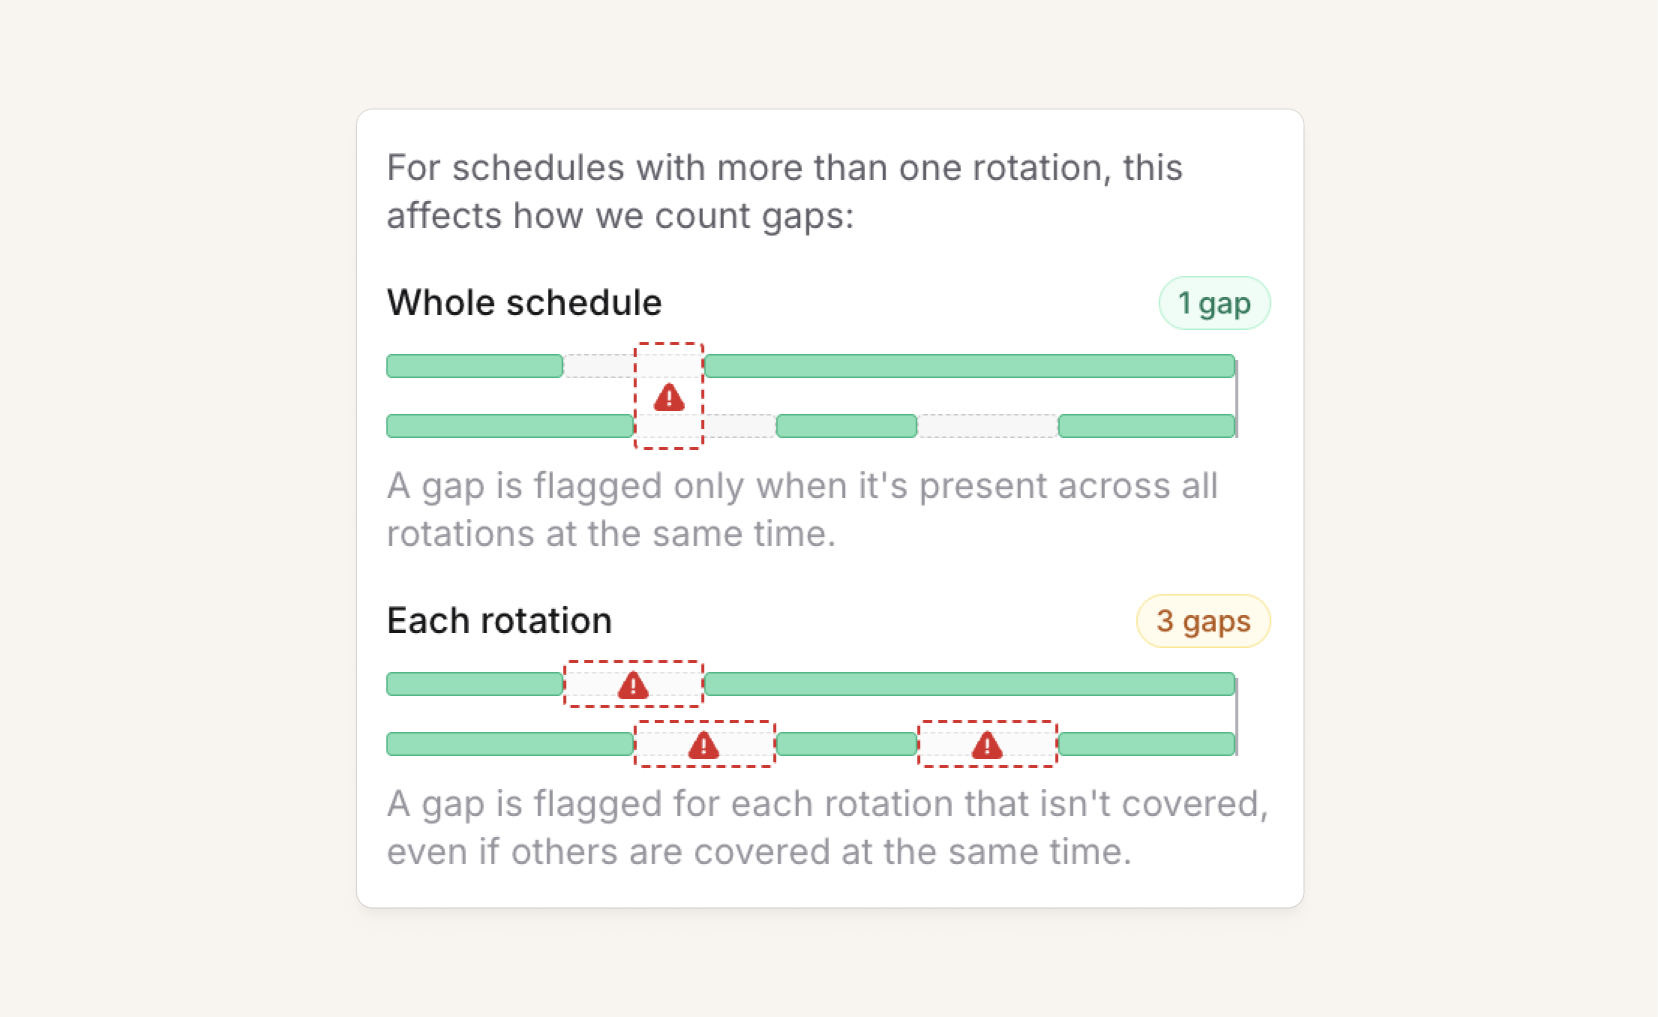
When configuring a policy, it’s possible to select schedules for ensured coverage by picking specific team-owned schedules or any schedules that are actively used in an escalation path, for example. You can also decide to apply the policy across the whole schedule or by individual rotation(s).
You can also configure who is notified if there is a gap in coverage. So, if you want to make sure it always goes to a specific individual or all of the schedule’s owning team members, you can do so.
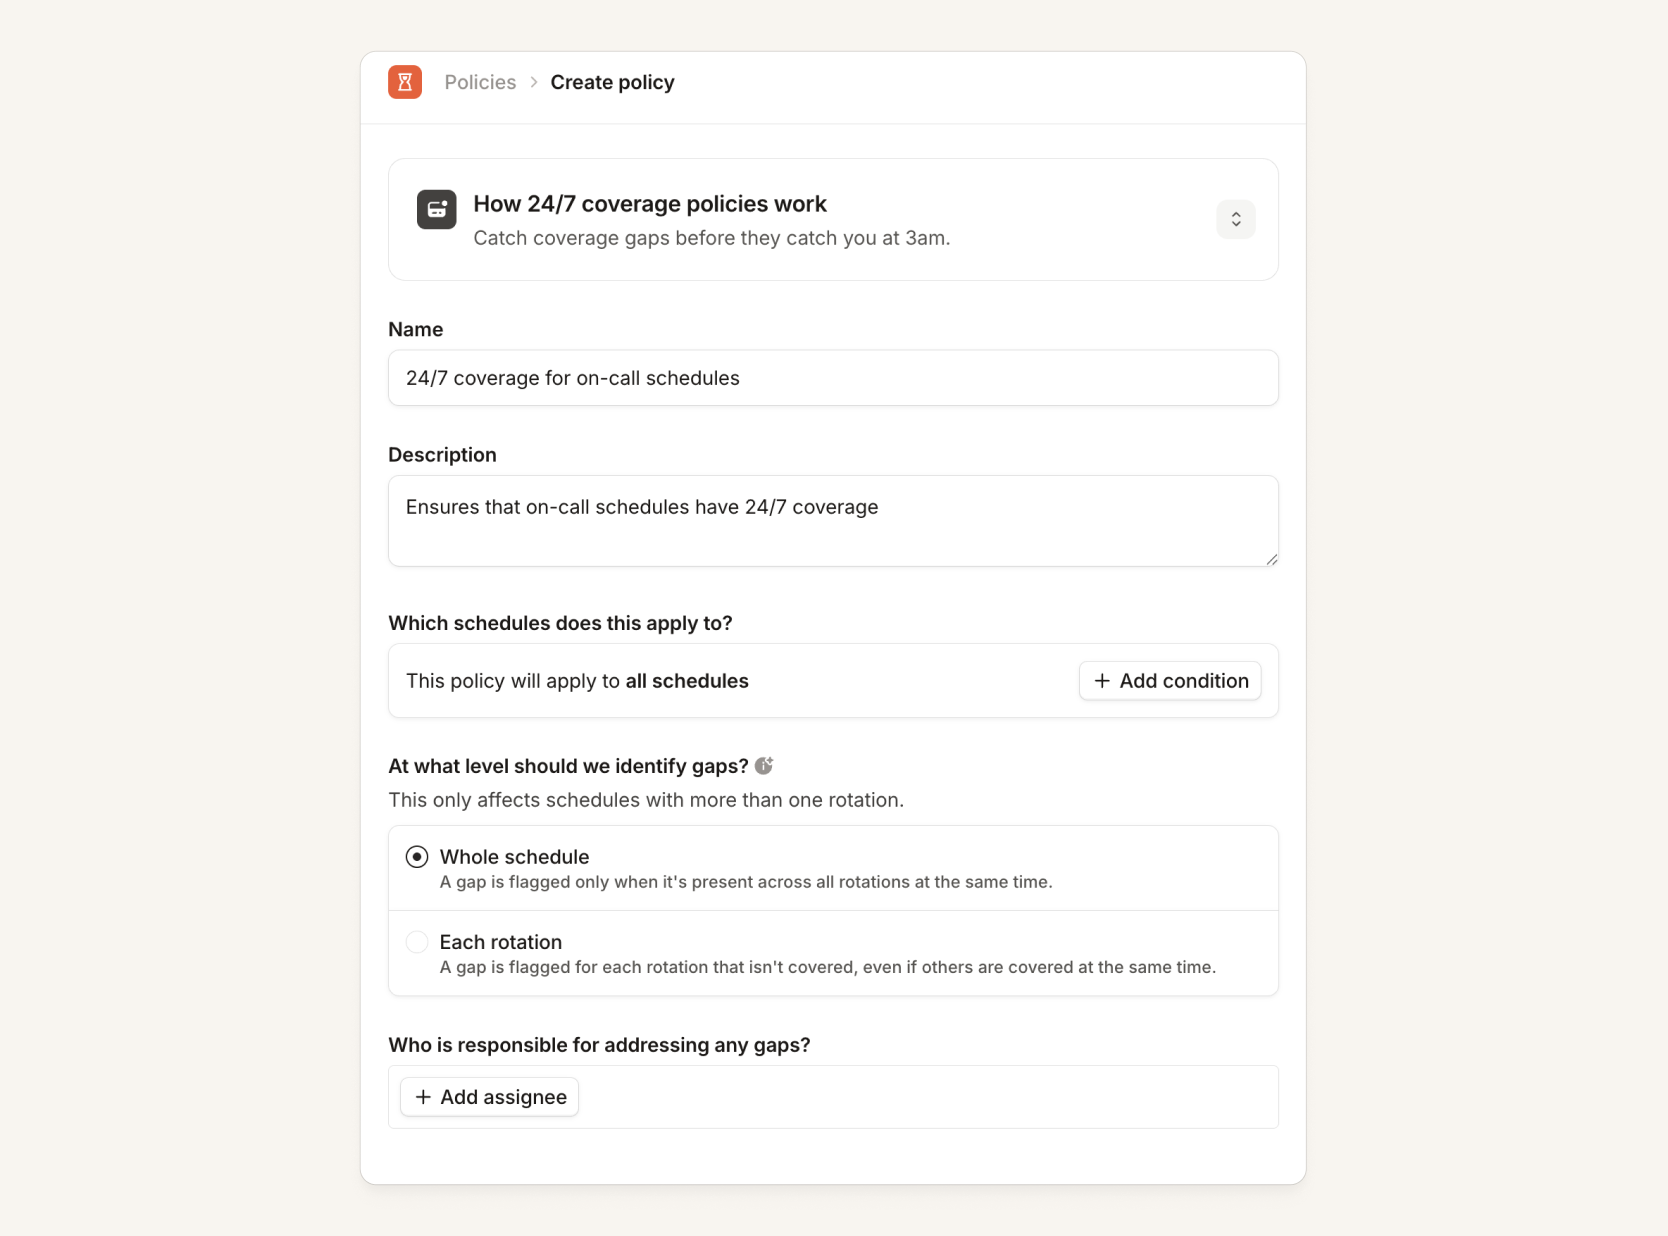
For full details on how to set this up, view the help docs here.
Improved alert and escalation message buttons
We've expanded the set of actions available on alert and escalation messages in both Slack and Teams.
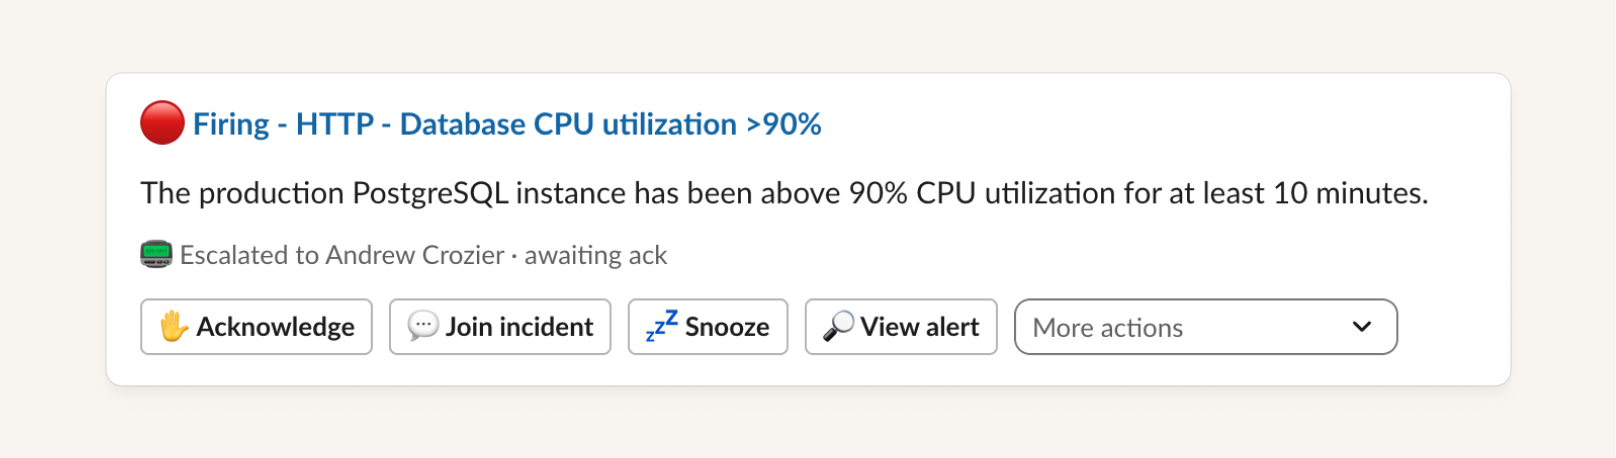
We’ve heard from customers that wanted to be able to acknowledge an escalation from an alert pulse message, or to resolve an alert from an escalation message.
So, we've added a more complete set of actions to each of these message surfaces, for example:
- You can acknowledge, snooze, escalate to the next level and so on from an alert pulse message
- We've also added information about escalations to alert pulse messages so you have that context when deciding what actions you'd like to take
Team usage of alert sources and routes
Our alert routing encourages you to utilize Catalog to share routing configuration across your teams. This is useful to reduce the amount of configuration you need to manage and ensures more consistency across your organization. However, it can make it harder to know which team is using which alert sources and routes.
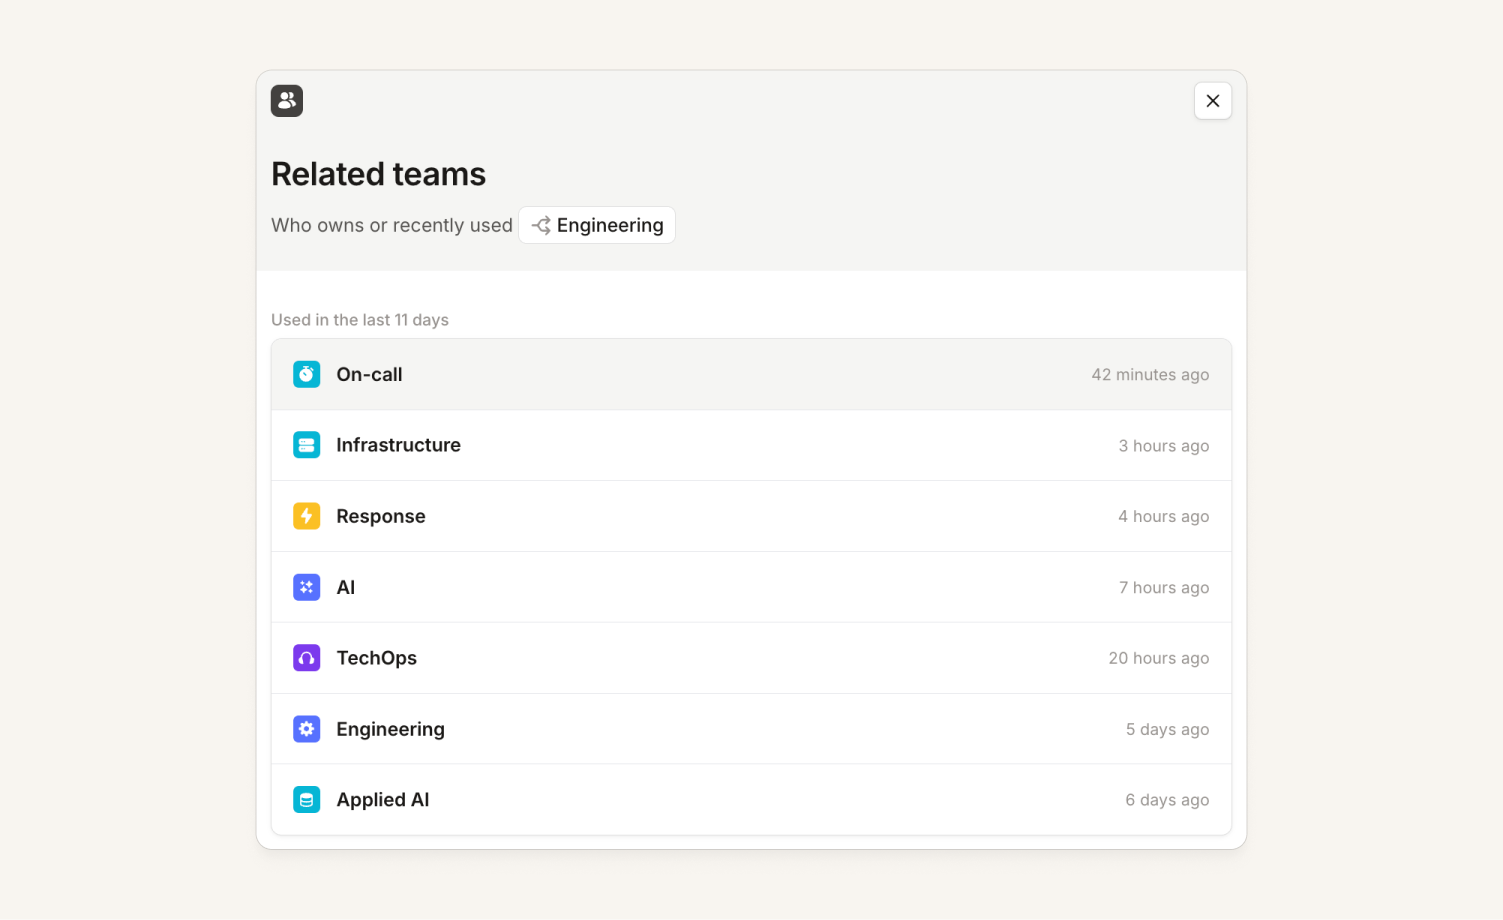
Now, we'll track which teams have used an alert source or route in the last 30 days, and let you filter sources and routes by team.
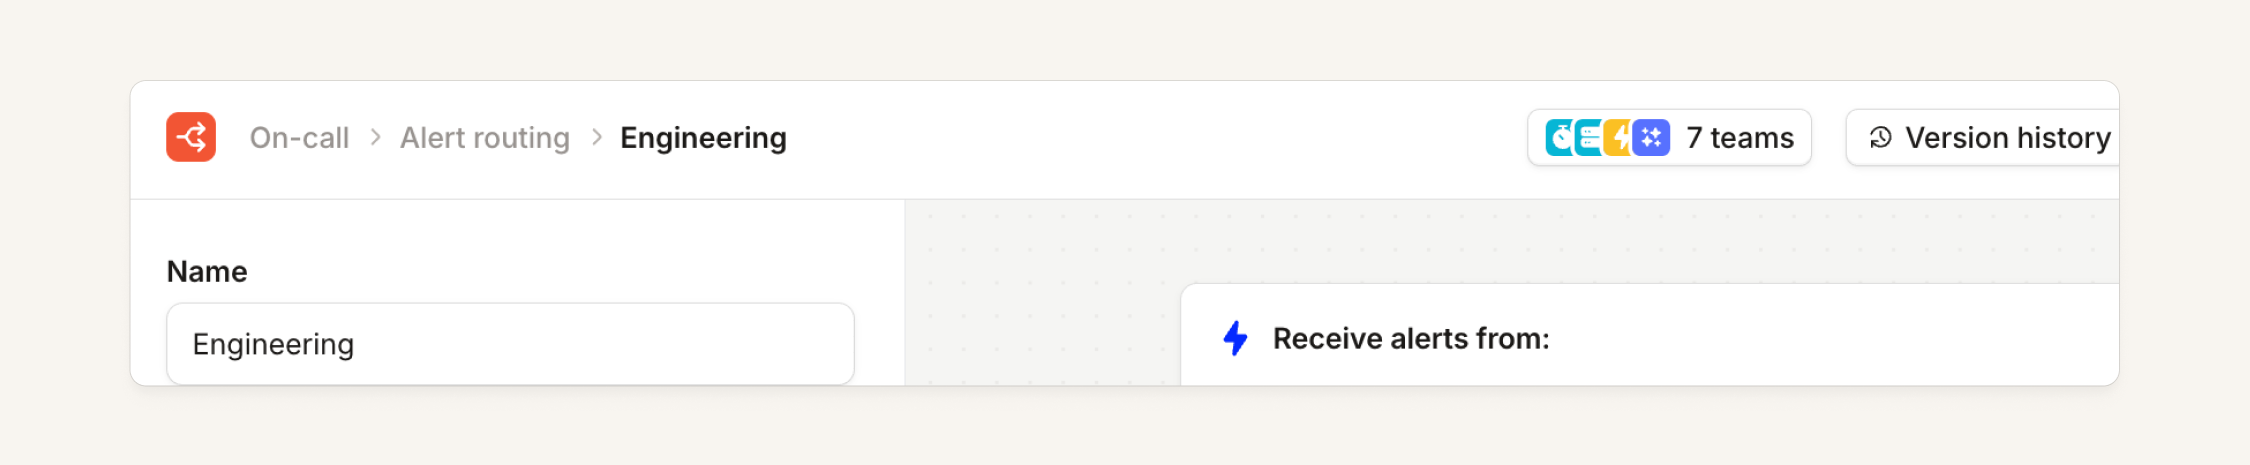
This comes with a few benefits:
- As an admin, I can now look at my organization's sources and routes and understand who's using what
- As a member of a team, I can now see those sources/routes listed in my team's settings page, even if we're not "owners" of those sources/routes from a permissions perspective
We've also tidied up the routing page, adding the option to view content in list views, adding filters, and reducing the "fade" effect if you moused over something in the graph view.
Textual view for escalation paths
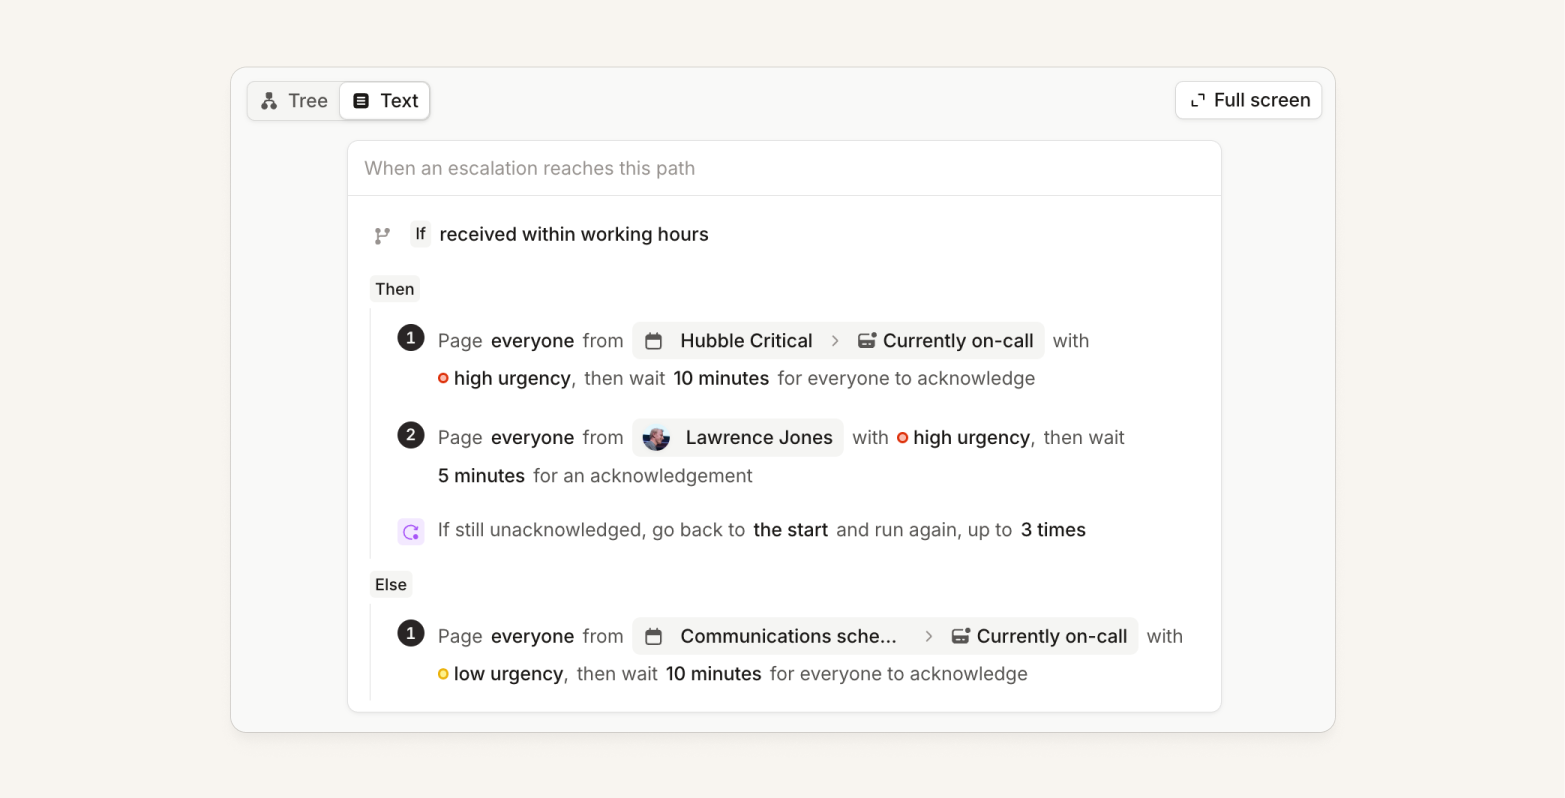
You can now view escalation paths in a more condensed textual format. This works both when viewing, editing and restoring a version of an escalation path.
You can toggle between this and the graph view using the little switch at the top left, and we remember your preference whenever you open an escalation path again.
Beta Terraform resources for managing rotation schedules
We've released in beta new, improved, Terraform resources for managing rotation schedules:
The main quality of life improvement is removing "rotation versions" from Terraform. Now, adding or removing someone from a rotation means editing the lineup in the rotation resource, and optionally choosing when you want the change to happen:
- immediately (the default)
- after the current shift
- or after a full rotation
This means customers can update one resource and get a simple plan, instead of constantly adding new rotation versions and having to figure out the correct effective_from timestamp to put in.
Add duration metrics from the Insights MTTX dashboard
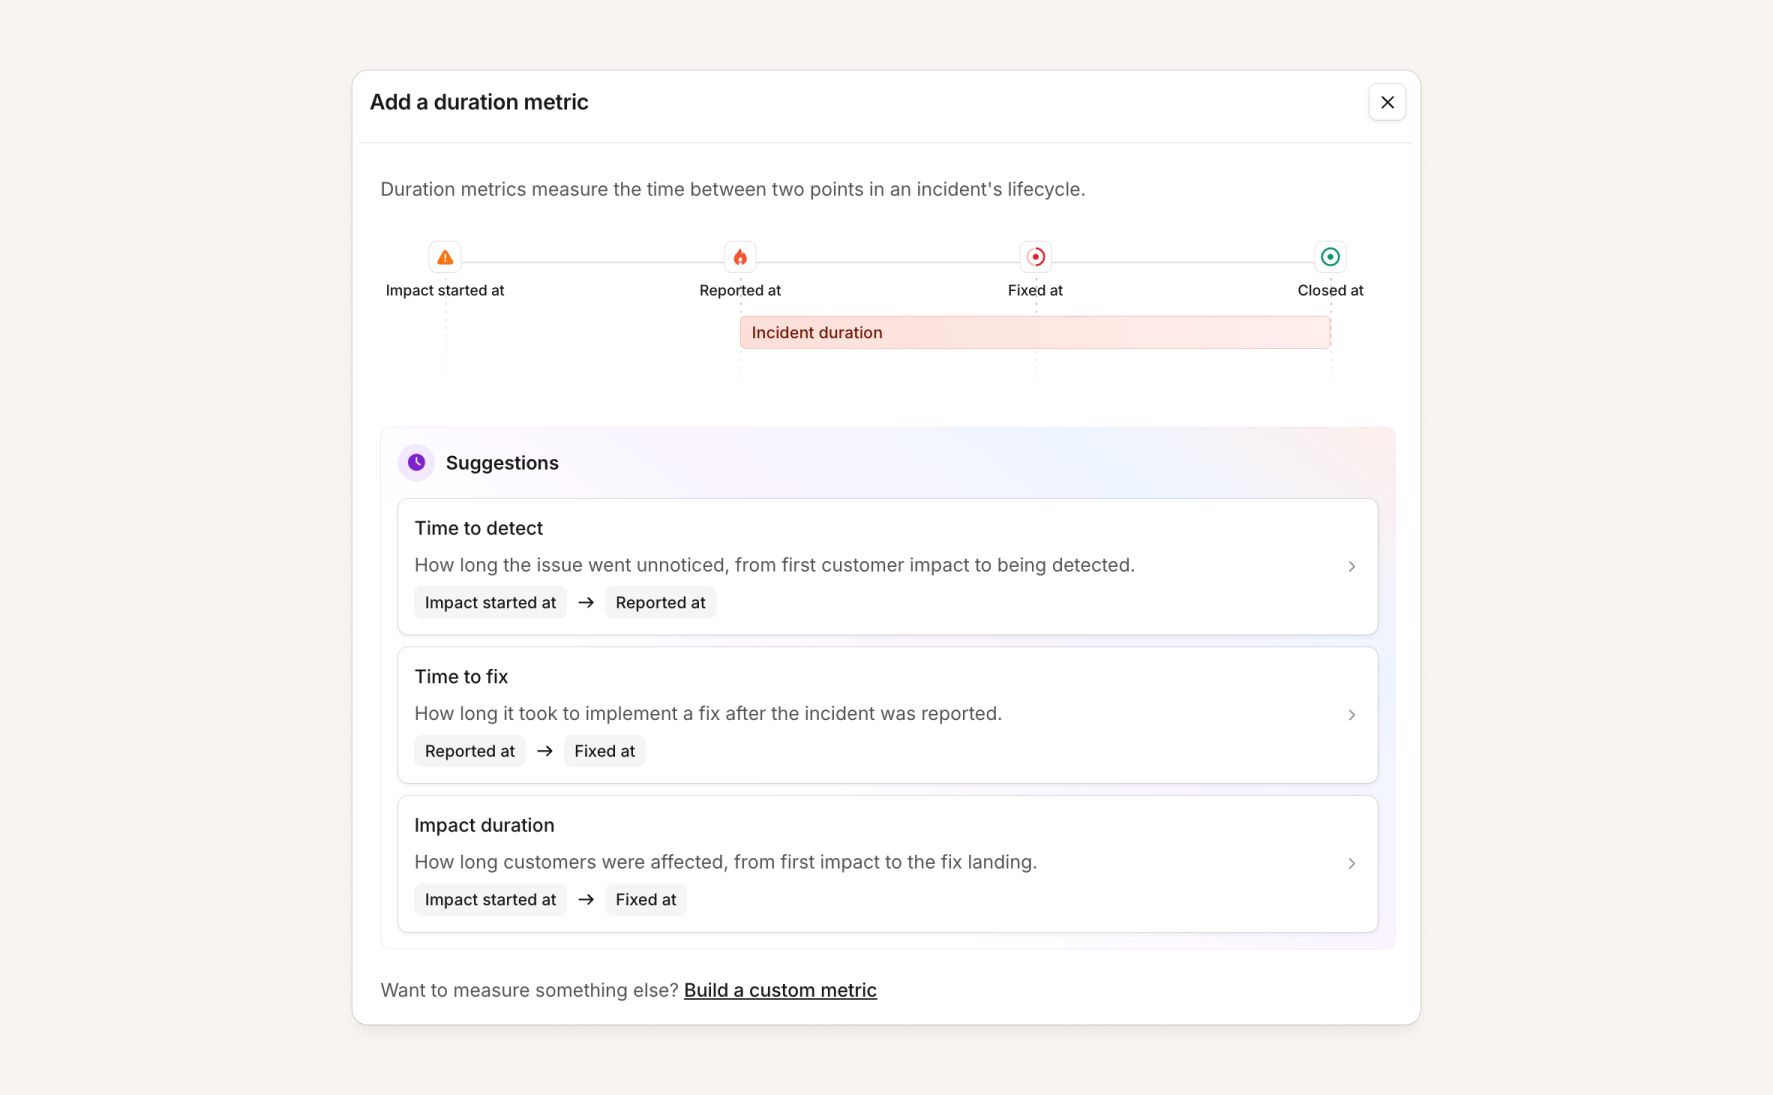
While customers have always been able to add new duration metrics, like mean time to mitigate, the configuration was quite tucked away in Settings. We're now surfacing it right where people go to look at these metrics:
- You can add a duration metric directly from the Insights MTTX dashboard
- We'll suggest relevant metrics based on the incident lifecycle and what's already been configured
New settings pages
We’ve added three new settings pages for additional and easier configuration, including:
- Calls settings
- AI governance settings
- On-call notification settings
Calls settings
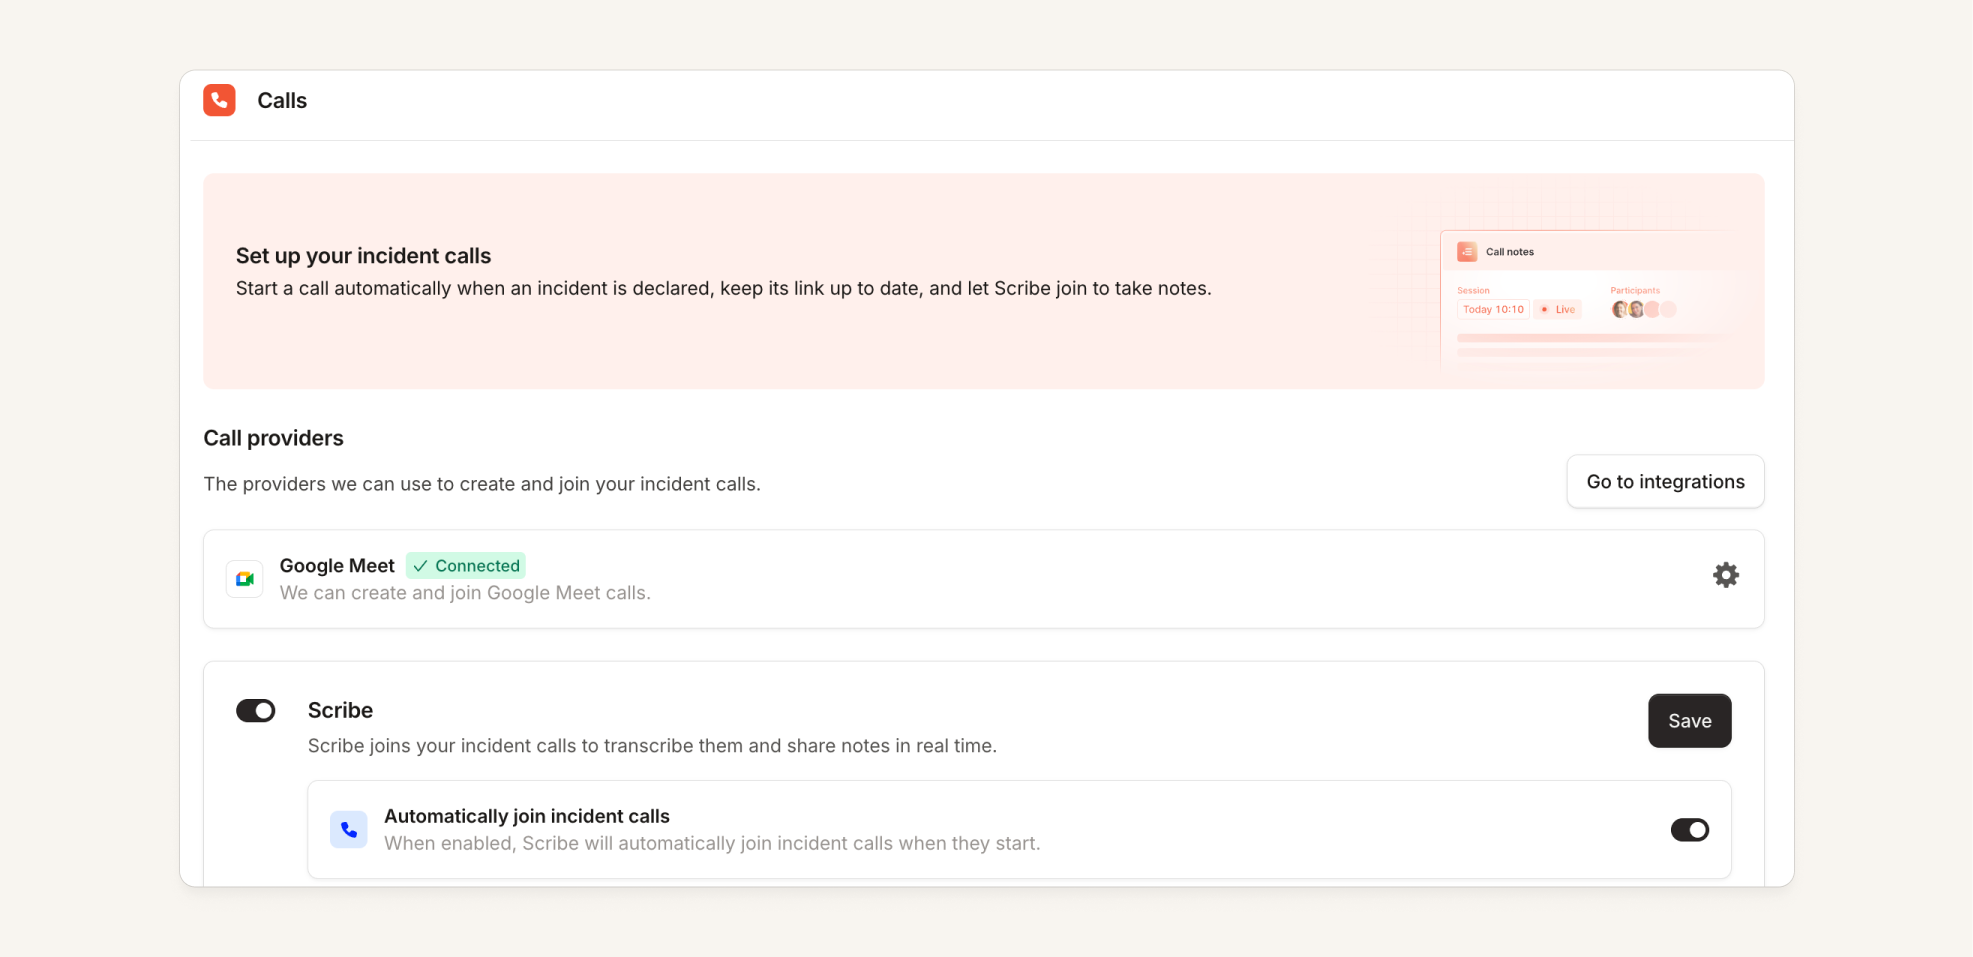
We've created a new Settings page for all your call and Scribe-related configuration. We previously had a number of settings spread out in different places like Automations, or on the integrations themselves. Now, all these settings live together and allow you to easily see which call providers you have set up, if they are in a good state, and which you wish to use for features like automatically creating a call.
AI governance
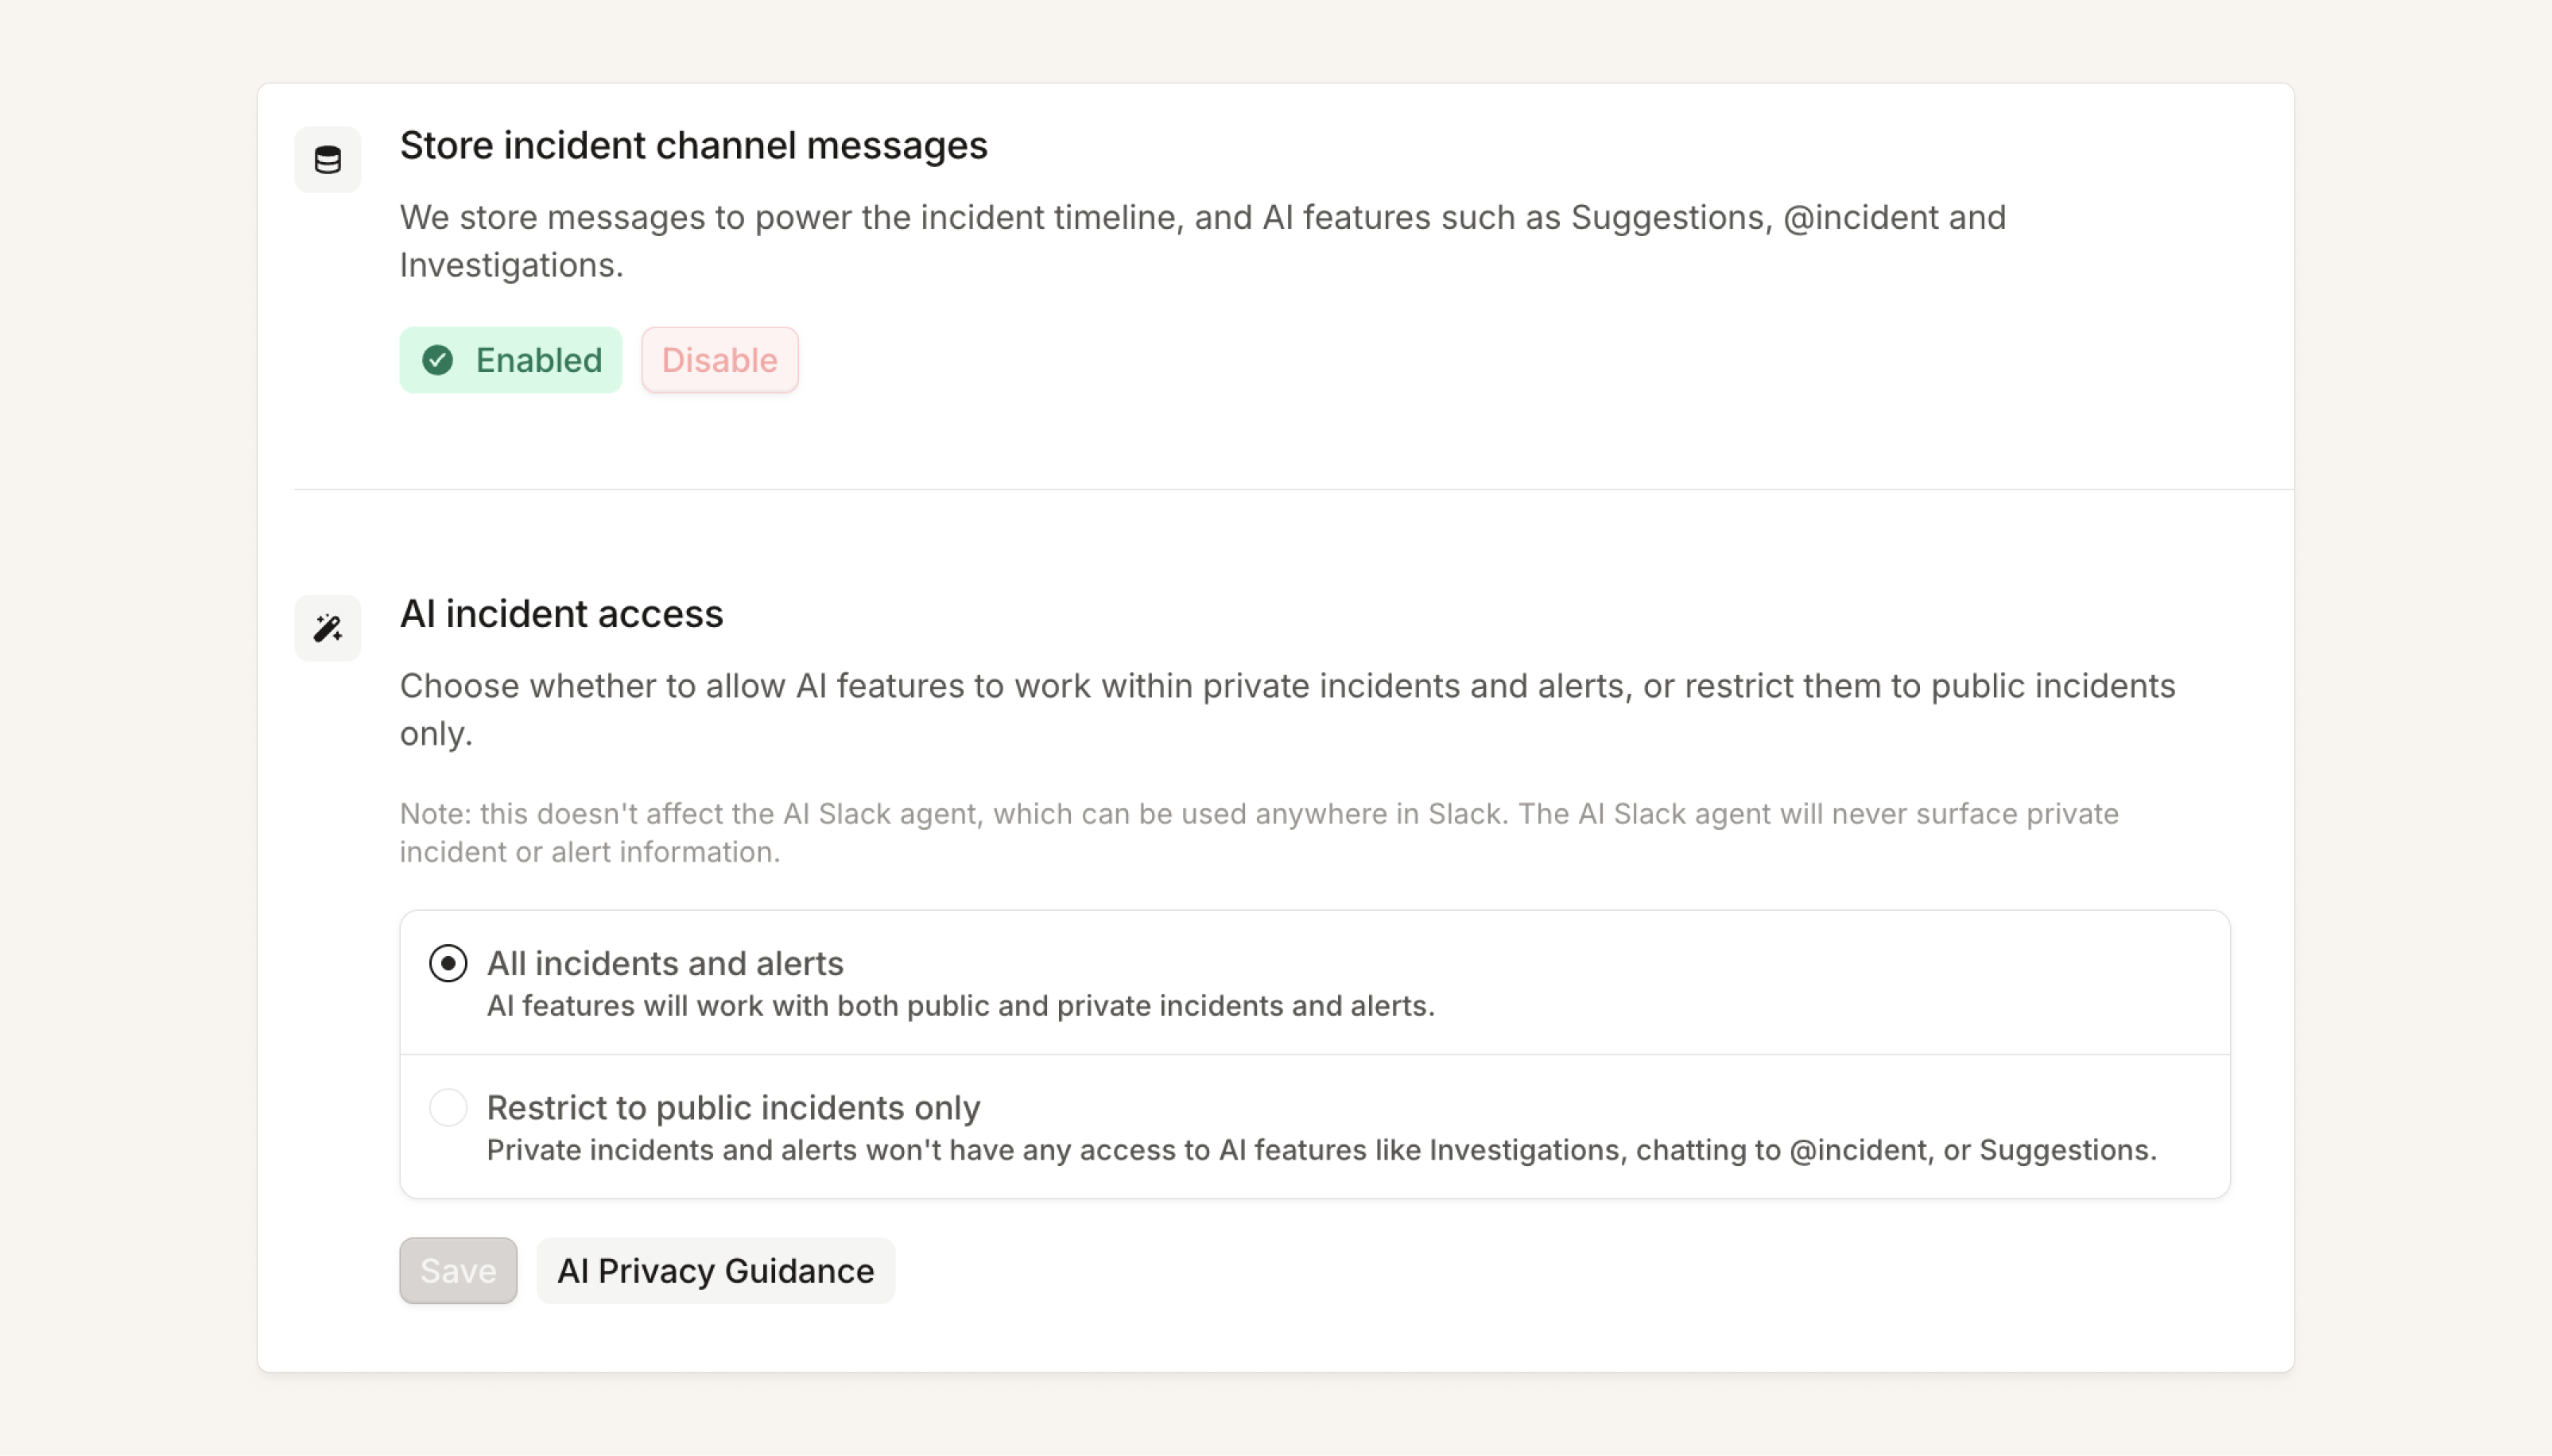
Secondly, there's now a Settings → AI governance page, which brings AI security settings together. It also makes it very clear if you've opted out of any AI subprocessors. This includes if you opted out of everything, out of some AI features or have everything turned on (as expected).
On-call notification settings
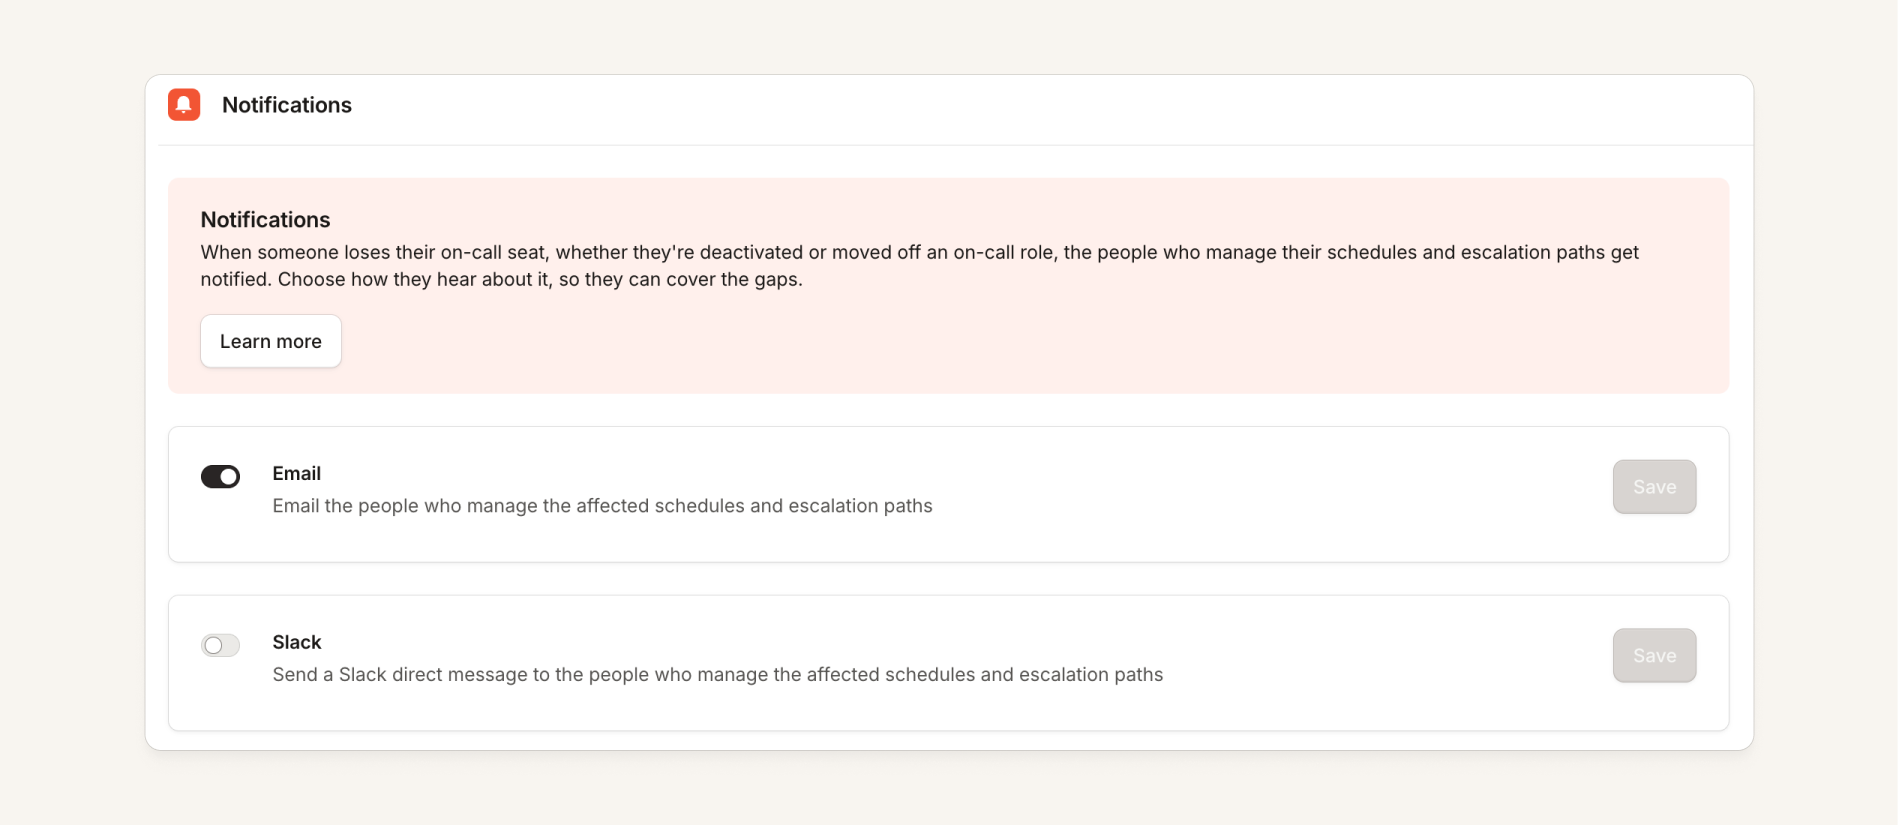
Finally, organizations can now choose how to notify schedule and escalation path managers when a user loses their on-call seat.
Previously: organizations could notify managers via email when a user was deactivated. This behavior was enabled for all organizations by default.
Now: organizations can also notify those managers via Slack or Teams DM when a user loses their on-call seat or is deactivated. There is a new page at Settings → On-call → Notifications to toggle if these messages are sent, and each option toggles independently.
Telemetry support for AWS and new discovered sources view
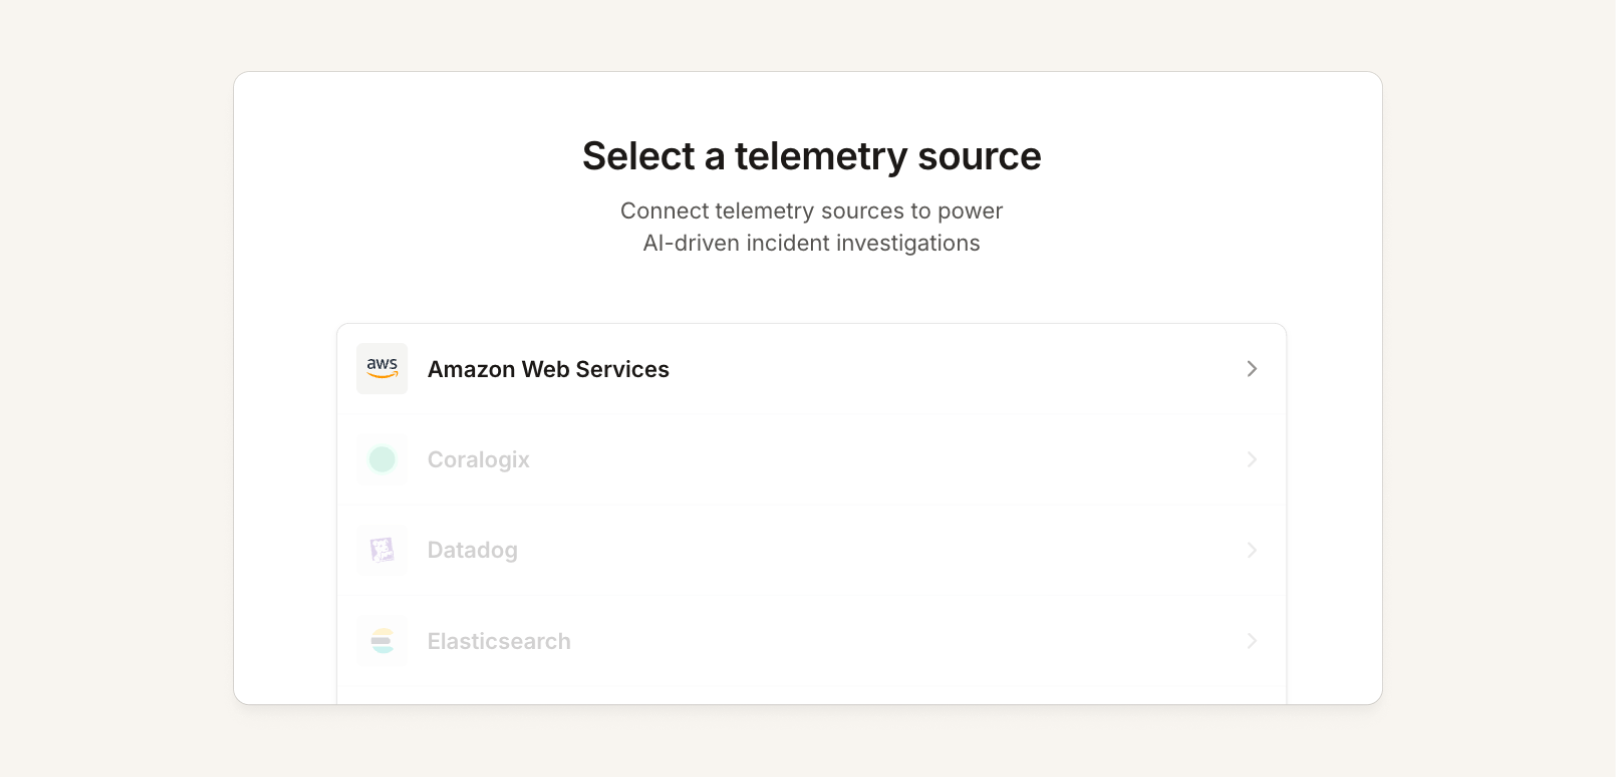
You can now connect AWS as a telemetry source provider, similar to GCP! Customers can connect via an OIDC IAM role, or access keys, and we then discover their accounts and data sources. We now support:
- CloudWatch: Metrics and Logs
- Kubernetes (via EKS)
- OpenSearch: Logs
- Postgres (via RDS/Aurora)
- MySQL (via RDS/Aurora)
Before this, organizations would have had to connect SQL sources manually rather than them be discovered automatically, so we also shipped a new UI to support that. AWS has a new "sources" view that lets you test if we can actually reach any discovered sources, and configure ones that have issues or require further setup.
Insights tab within Teams uplift
We've now migrated the Insights tab from within you teams experience (ie. Payments team). This is essentially the At a glance dashboard, but scoped to your team. We've also added some improvements over the old tab view:
- Child teams are now included in the metrics
- For example: the Engineering team's dashboard would include incidents from Infrastructure, Payments, Security, and any other team beneath it in the hierarchy, rather than only incidents directly tagged to Engineering.
- "Matches any" filtering
- The dashboard supports our new "Matches any filters" mode, so you can express OR conditions across fields. The team filter always applies on top, so you never lose the team scoping.
What else we've shipped
New
- If you're using
/incidentor/incfor another app (for example a homegrown tool), you can now use/incident-ioinstead (view this guide for more details). - On-call readiness policies can now be scoped with a new "is a member of any schedule" condition, so you can target everyone on a schedule without picking each one individually. This removes the need to manually select schedules one by one, which previously became impractical for organizations with large numbers of schedules.
- The time window shown on the status page timeline is now configurable.
- The Pager load (external) dashboard has been updated with a simplified layout and improved filters (ie. escalation target and user are now global filters)
- We can now connect to firewalled Jira Server/DC instances via a connector (now known as proxy), without customers needing to allow inbound access from us!
- Suggestions now support sending direct messages.
- You can now see the helptext for a catalog-backed custom field's selected value directly under the field, just like severity descriptions, instead of it disappearing once you close the dropdown.
- You can now filter your workflows list by step, trigger, state (draft, active, or disabled), and creator or editor (including "me"), making it much easier to find workflows without opening each one. Filters are also reflected in the URL so filtered views can be shared and revisited.
Improvements
Your teamssection is now aboveYour organizationin the left navigation- Alert source labels on the mobile app's escalations list now display readable names instead of raw internal identifiers.
- Improved loading of Kanban view on home screen with large number of incidents.
- We've increased the component limit on internal status pages from 200 to 300, and pages now show an accurate count when components are still being truncated.
- Incident list exports now separate document URL and exported document URL.
- We've made some under-the-hood performance improvements to the escalations list page so that it loads faster now.
Bug fixes
- When a user is added to a SCIM group, we now update their roles immediately.
- Fixed an error when configuring post-incident flow to assign a custom incident role.
- Fixed an issue where the old sidebar navigation hid the "Add" control on the Routing settings page, making it impossible to create a new alert source or route. The control is now visible again for all users, regardless of which sidebar experience they're on.
- Duration metrics returned by the public API (e.g. Time to Repair) now match what's shown in Insights, even when the underlying timestamps have since been cleared. The API response also now includes a
statusfield so you can tell a withheld value apart from one that was never calculated. - Fixed a bug where tapping an incident link on iPhone opened the mobile app to a blank white screen instead of the incident. Incident deep links now navigate to the correct destination.
- Fixed an issue where ServiceNow directory syncs could time out on large user tables, causing catalog entries for ServiceNow user groups to show unresolved IDs instead of manager and member names.
- Fixed an issue where
GET /v3/catalog_resourcesandGET /v3/catalog_typesreturned a catalog type name that the alert attributes API rejected. Both endpoints now also return anengine_resource_typefield with the exact value needed to create alert attributes via the API or Terraform. - Fixed a bug where editing an upcoming scheduled version of a rotation and adding responders could silently revert the save back to the current version's responder list, with no error shown. Upcoming version edits now save correctly.
- Fixed an issue where workflow and expression conditions using "Incident Mode is one of..." would never match, silently preventing issue tickets, workflows, and automations gated on incident mode from firing.
- Fixed an issue where if your team was Linear backed and you removed the Linear integration, you could no longer visit the Team Settings page.
- Fixed a bug where clearing a timestamp using
/inc timein Slack appeared to work but didn't actually remove the value once saved. Clearing a timestamp in Slack now behaves consistently with the dashboard. - Fixed an issue on status pages with sub-pages where a component group's uptime percentage could be lower than every individual component inside it, caused by the group and its components measuring uptime over different time windows.
- Fixed an issue where the "Last updated at" timestamp on Microsoft Teams incident announcements always displayed in UTC instead of your organization's configured timezone.
- Fixed an issue where certain responses from Sentry's token refresh endpoint could permanently mark the Sentry integration as broken.
- Fixed an issue where creating or editing a single-select custom field could silently fail to save if an option's value contained a leading or trailing space, tab, or line break, with no error shown. Stray whitespace is now trimmed automatically, and any remaining validation errors (like duplicate or overly long option values) now show clearly against the affected option.
- Fixed an issue where a workflow saved with a manual trigger form could end up referencing a form field that no longer existed, making the workflow impossible to open or edit.
So good, you’ll break things on purpose
Ready for modern incident management? Book a call with one of our experts today.
We’d love to talk to you about
- All-in-one incident management
- Our unmatched speed of deployment
- Why we’re loved by users and easily adopted
- How we work for the whole organization