New: AI-native post-mortems are here! Get a data-rich draft in minutes.
Insights updates: Enhanced analytics and reporting features
May 28, 2024

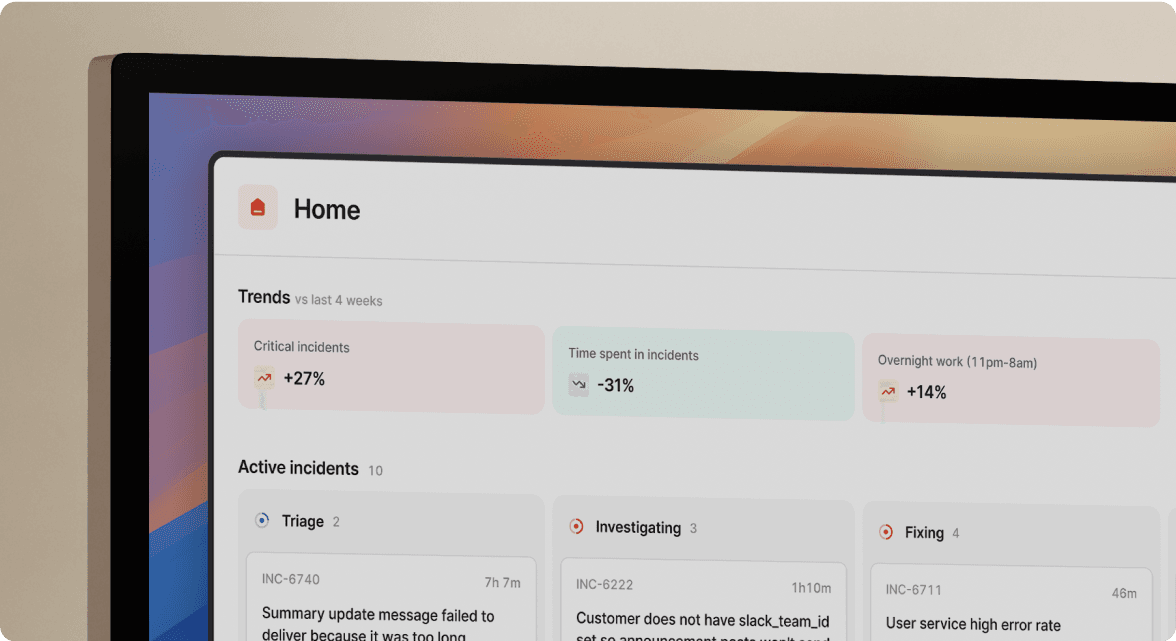
Our Insights product allows you to understand your performance throughout different stages of the incident management process starting from On-Call through to Response and the Post-incident stage. We provide you with critical charts and tables in concise dashboards that will help you answer critical questions related to MTTX, time spent on incident, pager impact, follow ups and more.
With Insights, you’ll be able to learn from your incidents and drive outcomes such as:
- Improving operational efficiency: by monitoring, improving and ensuring people are following key processes such as the Post-incident flow and completing follow-ups
- Optimising resource allocation: by using incident data to help prioritise roadmap and tech investment decisions
- Improving response health: by understanding the pager load, how much people are being woken up, and how effective they can be
We feel that great insights are critical to sustained, on-going excellent incident management. Our first set of changes to deliver on this experience has been to:
- Create a section dedicated to Post-incident insights
- Improve our existing dashboards by improving the UX, adding new functionality and tables
💓 Post-incident insights
The Post-incident process is key to ensure that follow-ups and incident learnings are captured and can be utilised for better incident management in the future. With a sub-optimal process for tracking all things Post-incident, organisations risk not learning and encountering similar or worse issues in the future.
We’ve added a Post-incident section to our Insights product that’s currently focused around the Post-incident flow and Follow-ups which will allow you to improve operational efficiency by:
- Understanding where users aren’t following your designated process for a given Post-incident flow
- Understanding the completion rates of follow-ups and the time taken to complete them
Follow-ups Dashboard

Completing follow-ups are an essential part of the incident management process to ensure that an incident has an appropriate short-term and potentially long-term fix. If these follow-ups are left uncompleted, there’s a risk that another incident occurs for a similar reason. Therefore, it’s extremely important to be able to track follow-ups and ensure that they’re being completed in a timely manner. Our follow-ups dashboard will help achieve this and answer important questions such as:
- In the last quarter, which team has the most outstanding follow-ups?
- What’s the status of my organisations follow-ups over time?
- On average, how long does it take each of my teams to complete their follow-ups?
Post-incident flow Dashboard

The Post-incident flow is designed to help you achieve a repeatable process that makes it easier learn from past incidents. To achieve this, it’s imperative that your flows and post-incident flow tasks are followed and completed. Our dashboard related to the Post-incident flow will provide clarity on all of your different flows and tasks within a flow so that you can answer important questions such as:
- How often do my teams opt-in or opt-out of a specific post-incident flow and which specific incidents did they choose to opt-in for?
- Which of my teams takes the longest to complete a specific post-incident task for a given flow?
👀 Improving our existing Dashboards

We understand that it’s not only important to have the insights within our product but it’s important to be able to easily navigate the data and investigate any abnormalities. With this, we’ve focused on improving the user experience so that there’s more data, it’s quicker to find and you’re able to do a more thorough investigation that will help drive the outcomes that you want. To solve this problem, we’ve introduced the following improvements:
- Additional MTTX tables: You can easily view durations of each stage of an incident by incident and severity. This will help to answer questions such as where are we spending most of our time in a given incident? Which stage could we have been more efficient?
- Improved performance and loading speeds: We’ve improved the performance and loading speed of charts and tables. Navigating through your data will be so much quicker now which means you can find your insights and come up with a plan of action in less time!
- Expose Underlying Data: You can view the underlying data for an entire chart or a specific part of the chart without needing to download a CSV. This will allow you to easily navigate your data and click-through to relevant incidents to continue your investigation. For example, if I saw an unusually high number of SEV0 incidents, I could view the underlying data which will provide me with a list of the incidents and a corresponding link to each incident within our dashboard.
🚀 What else we’ve shipped
Improvements
- Improved alert attribute name suggestion for nested json fields
- Handle long incident names better in the incident dashboard by truncating them based on the width of the dashboard
- Improve copy of message displayed when trying to delete a custom field that is being used in an auto-export follow-up configuration
- Handle the case where Slack sometimes does not send the selected project/issue type in the export follow-up to Jira form
- Improve error message when attempting to delete a status page.
- Improve explanation of how we link debriefs to incidents.
- Surface Postmortem Destination Permissions failure in dashboard.
- Truncate attachment details when merging incidents with a large number of attachments.
- We now show the timezone of the shift in the schedules timezone, not the user's timezone, if it doesn't match
- Your JIRA alerts will now update their payload in place if we receive updates to the ticket that created it
- Updated the name of our workflow step to make it obvious that you're posting to a public status page
- The
/inc attachcommand will now tell you if it failed, and why
Bug fixes
- Fix bug which prevented basic plans from installing the Zendesk integration
- We fixed a bug which was stopping users from requesting an update via slack
- We've stopped showing follow-up priorities if your plan doesn't allow them
- Show tagged slack users properly in actions on dashboard.
- Fix bug where clearing the event title / description in debrief settings would cause the page to error.
- Trim whitespace from post-mortem URLs
- We fixed a bug that was stopping some users from updating a customer status page from Slack
- We're now correctly setting all the custom fields whenever an incident is accepted
- Fix bug where selected options in "Customise view" in incidents list page is cleared out when filters are changed
- Workflow steps which send a message to a channel now correctly handles mixture of links and italics
- Completing a post-mortem as part of a post-incident flow now sends a message to the channel
New
- You can set a postmortem link when creating a retrospective incident through the API
- You can now filter incidents by Team as well as by User
So good, you’ll break things on purpose
Ready for modern incident management? Book a call with one of our experts today.
We’d love to talk to you about
- All-in-one incident management
- Our unmatched speed of deployment
- Why we’re loved by users and easily adopted
- How we work for the whole organization


